. 2024 Mar 1;15(3):181.
doi: 10.1038/s41419-024-06486-z.

Depletion of the N6-Methyladenosine (m6A) reader protein IGF2BP3 induces ferroptosis in glioma by modulating the expression of GPX4

Affiliations

Depletion of the N6-Methyladenosine (m6A) reader protein IGF2BP3 induces ferroptosis in glioma by modulating the expression of GPX4

Limei Deng et al. Cell Death Dis. .

Abstract

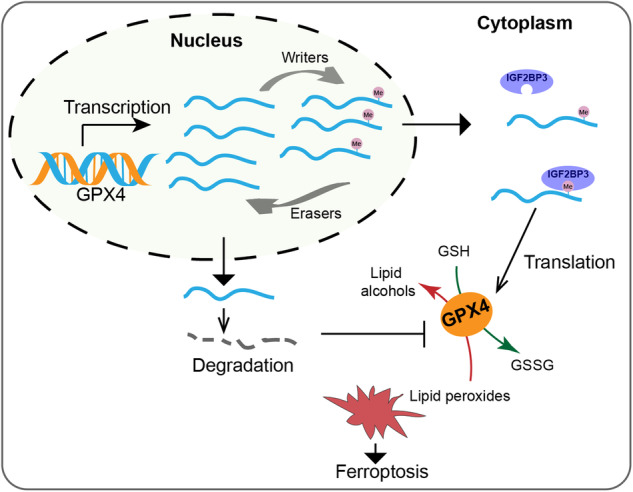
Emerging evidence highlights the multifaceted contributions of m6A modifications to glioma. IGF2BP3, a m6A modification reader protein, plays a crucial role in post-transcriptional gene regulation. Though several studies have identified IGF2BP3 as a poor prognostic marker in glioma, the underlying mechanism remains unclear. In this study, we demonstrated that IGF2BP3 knockdown is detrimental to cell growth and survival in glioma cells. Notably, we discovered that IGF2BP3 regulated ferroptosis by modulating the protein expression level of GPX4 through direct binding to a specific motif on GPX4 mRNA. Strikingly, the m6A modification at this motif was found to be critical for GPX4 mRNA stability and translation. Furthermore, IGF2BP3 knockdown glioma cells were incapable of forming tumors in a mouse xenograft model and were more susceptible to phagocytosis by microglia. Our findings shed light on an unrecognized regulatory function of IGF2BP3 in ferroptosis. The identification of a critical m6A site within the GPX4 transcript elucidates the significance of post-transcriptional control in ferroptosis.


Conflict of interest statement

The authors declare no competing interests.

Figures

Fig. 1
Fig. 1. Prognostic significance of m6A regulators in human TCGA-LGG.
A Survival map showing correlation of expression of 22 m6A regulators with survival time in TCGA-LGG. The red and blue colors indicate poor and favorable prognosis, respectively, with the color intensity corresponding to the magnitude of hazard ratio (HR). A bounding box around tiles shows statistical significance (p < 0.05). B KM curves showing overall survival for TCGA-LGG patients with high and low expression of ZCCHC4, RBM15, IGF2BP2, IGF2BP3, YTHDC2, YTHDF2, HNRNPA2B1, and ALKBH5. C Expression distribution of IGF2BP3 between tumor and normal tissues in TCGA-LGG patients. D Expression distribution of IGF2BP3 in different grades of TCGA-LGG and TCGA-GBM patients. E Expression distribution of IGF2BP3 in IDH-mutant or IDH-wildtype TCGA-LGG patients. F Expression distribution IGF2BP3 in 1p/19q codeletion or 1p/19q non-codeletion TCGA-LGG patients. Statistical significance levels are indicated as follows: *, p < 0.05; **, p < 0.01; ***, p < 0.001.
Fig. 2
Fig. 2. IGF2BP3 impacts on cell viability and proliferation in glioma cells.
A U87, U251, and HS683 cells were infected with shNC, shIGF2BP3-1, and shIGF2BP3-2 lentivirus. The IGF2BP3 knockdown efficiency was verified by RT-qPCR. Paired two-tailed t-test was used to compare the results (n = 3). B CCK-8 showing cell viability of U87, U251, and HS683 cells with IGF2BP3 knockdown compared to control cells. Paired two-tailed t-test was used to compare the results (n = 3). C Colony formation assay showing effects of IGF2BP3 knockdown on clonogenicity in U87, U251, and HS683 cells. Paired two-tailed t-test was used to compare the results (n = 3). D Cell cycle analysis showing IGF2BP3 knockdown led to S-phase arrest in U87 cells. Multiple t-test was used to compare the results (n = 4). E Cell apoptosis analysis demonstrating an increase in cell apoptosis and cell death upon IGF2BP3 knockdown in U87 cells. Adding of apoptosis inhibitor zVAD-fmk resulted in partial mitigation of the apoptosis triggered by IGF2BP3 knockdown (Multiple t-test, n = 3). Data are presented as the mean ± standard deviation (SD) from three independent experiments. ***p < 0.001, **p < 0.01, *p < 0.05.
Fig. 3
Fig. 3. IGF2BP3 knockdown induces ferroptosis in glioma cells.
Flow cytometry histograms show A the levels of lipid peroxides assessed using BODIPY-C11 probe staining, and B ROS levels measured by DCF probe in IGF2BP3-KD U87 and HS683 cells compared to control cells. Cells were treated RSL3 to induce ferroptosis. C Immunofluorescence images showing 4-HNE expression in IGF2BP3-KD U87 and HS683 cells compared with control cells. D The fluorescent intensity in (C) was quantified using Image Pro-Plus software, and the data were analyzed using paired two-tailed t-test (n = 3). E Transmission electron microscopy images revealed that IGF2BP3-KD U87 cells exhibited smaller mitochondria with heightened membrane density and decreased mitochondrial cristae (indicated by red arrows). F CCK-8 analysis showing DFO treatment rescue cell viability in IGF2BP3-KD U87 and HS683 cells (multiple t-tests). Data are presented as the mean ± standard deviation (SD) from three independent experiments. ***p < 0.001, **p < 0.01, *p < 0.05.
Fig. 4
Fig. 4. Correlation of IGF2BP3 and GPX4 expression.
A Western blot detecting NRF2, FSP1, and GPX4 protein levels in IGF2BP3-KD U87 and HEK 293 T cells compared with control cells. B RT-qPCR analysis detecting GPX4 mRNA level in IGF2BP3-KD U87 and HEK 293 T cells compared with control cells (Paired two-tailed t-test). C-D The GPX4 protein expression level was verified by western blot (C) and mRNA expression level was verified by RT-qPCR (D) in IGF2BP3 overexpressing U87 and HEK 293 T cells compared with GFP control cells (Paired two-tailed t-test). E U87 cells were infected with shIGF2BP3-2 lentivirus to knockdown IGF2BP3 or infected with shNC lentivirus as a control. Subsequently, cells were infected with pCHD-GPX4 to overexpress GPX4. The GPX4 protein expression level was verified by western blot. F U87 cells were infected with shIGF2BP3-2 lentivirus to knockdown IGF2BP3 or infected with shNC lentivirus as a control. Subsequently, cells were infected with pCDH-NRF2 to overexpress NRF2 or infected with pCDH empty vector as a control. The GPX4 protein expression level was verified by western blot. G Tissue microarray chip containing clinical glioma patients’ tumor samples (n = 60) was analyzed using mIHC to detect the protein expression levels of IGF2BP3, NRF2, and GPX4. The expression correlation between IGF2BP3 and GPX4 or NRF2 was fitted using a linear regression approach. H Correlation between IGF2BP3 and GPX4 mRNA expression levels in TCGA-LGG and TCGA-GBM samples. Pearson correlation was conducted to analyze the correlation. I U87 cells were infected with shIGF2BP3-2 lentivirus to knockdown IGF2BP3 or infected with shNC lentivirus as a control. Subsequently, cells were infected with pCHD-GPX4 to overexpress GPX4. The levels of lipid peroxides were assessed using BODIPY-C11 probe staining, and ROS levels was measured by DCF probe. The results were presented as flow cytometry histograms. J Cell apoptosis analysis demonstrating GPX4 overexpression partial rescued the cell apoptosis and cell death induced by IGF2BP3 knockdown in U87 cells (multiple t-tests). Data are presented as the mean ± standard deviation (SD) from three independent experiments. ***p < 0.001, **p < 0.01, *p < 0.05.
Fig. 5
Fig. 5. The nucleotide A575 in GPX4 (NM_002085) transcript is critical for GPX4 protein expression.
A Cartoon diagram illustrating the Coding Sequence (CDS) and 3’UTR of GPX4 (NM_002085) transcript. The amino acid numbering was highlighted in magenta, and the nucleotide numbering was highlighted in red. Three potential IGF2BP3 binding sequences and the UGA codons are indicated in the diagram. B RNA pull-down assay to assess the binding potency of three RNA sequences with IGF2BP3. Three potential IGF2BP3 binding RNA sequences were synthesized with or without m6A modification and then mixed with lysate from U87 and HS683 cells. The RNA-protein complexes were pulled down, and an anti-IGF2BP3 western blot was performed to detect the interaction between IGF2BP3 and the RNA sequences. C MeRIP assay revealing m6A enrichment of different GPX4 mutants. U87 and HS683 cells were infected with lentivirus overexpressing GPX4-WT, GPX4-A575T, GPX4-A694T, or GPX4-A575/694 T. Total RNA was extracted, and mRNA was purified. The mRNA was then enriched using an anti-m6A antibody and quantified by qPCR (Paired two-tailed t-test). D-E The U87 and HS683 cells were infected with lentivirus overexpressing GPX4-WT, GPX4-A575T, GPX4-A694T, or GPX4-A575/694T. The GPX4 protein and mRNA expression levels were verified by western blot (D) and qPCR (E). F-G The U87 and HS683 cells were infected with lentivirus overexpressing GPX4-WT, GPX4-U73C, GPX4-U73C-A575T, GPX4-U73C-A694T, or GPX4-U73C-A575/694T. The GPX4 protein and mRNA expression levels were verified by western blot (F) and qPCR (G). H HEK 293 T cells were infected with lentivirus overexpressing GPX4-WT or GPX4-A575T, and treated with Actinomycin D for 0, 3, and 6 h. RNA was extracted, and qPCR was performed to verify the expression level of GPX4. The degradation lines were generated using linear regression approach. I The U87 and HS683 were infected with lentivirus overexpressing GPX4-WT or GPX4-A575T. Cytoplasmic and whole cells’ RNA was extracted, and the expression rate of GPX4 in the cytoplasm relative to the whole cells was verified using qPCR. J IGF2BP3 was overexpressed together with GPX4-WT or GPX4-A575T, the expression level of GPX4 was verified by western blot. Data are presented as the mean ± standard deviation (SD) from three independent experiments. ***p < 0.001, **p < 0.01, *p < 0.05.
Fig. 6
Fig. 6. IGF2BP3 knockdown glioma cells fail to form tumors in xenograft mice model and are more susceptible to human microglia cells.
A 5 ×10⁶ U87 cells with or without IGF2BP3 knockdown were subcutaneously injected into the rear flank of nude mice. Mice were sacrificed, and the tumors were excised (n = 4). B The volume of tumors was measured every two days before mice were sacrificed, tumor volume was calculated using the formula V = (W2 × L) / 2, where V represents the tumor volume, W indicates the tumor width, and L denotes the tumor length; the weight of the tumors and mice was measured after mice were sacrificed (n = 4). C The expression of IGF2BP3 in xenograft tumors and normal mice brains was assessed using IHC. The differences in IGF2BP3 expression between tumors and brains were quantified using Image Pro-Plus software and analyzed using paired two-tailed t-test (n = 4). D U87-GFP and HS683-GFP cells with or without IGF2BP3 knockdown were co-cultured with human microglia-mCherry cells. The phagocytic function of microglia cells was visualized using confocal microscopy. E U87 and HS683 cells were infected with shIGF2BP3-2 lentivirus to knockdown IGF2BP3 or infected with shNC lentivirus as a control. The protein expression levels of STING and p-STING in U87 and HS683 cells, as well as in human microglia cells co-cultured with U87 and HS683 cells, were verified using western blot analysis. F The p-STING expression level in HS683 cells with or without IGF2BP3 knockdown was assessed using immunofluorescence. The fluorescent intensity was quantified using Image Pro-Plus software, and the data were analyzed using paired two-tailed t-test. Data are presented as the mean ± standard deviation (SD) from three independent experiments. ***p < 0.001, **p < 0.01, *p < 0.05.
Fig. 7
Fig. 7. Graphic diagram illustrating the importance of GPX4 mRNA binding to IGF2BP3 and its m6A modification for GPX4 protein expression.
After transcription, the level of m6A in GPX4 mRNA is dynamically modulated by regulators. GPX4 mRNA with m6A modification on A575 site is prone to cytoplasmic transportation and can bind to IGF2BP3, facilitating its translation into protein. In contrast, GPX4 mRNA without m6A modification is more susceptible to degradation. Reduced GPX4 protein expression leads to the accumulation of lipid peroxidation, resulting in ferroptosis.

Similar articles

Cited by

References

    1. Villa C, Miquel C, Mosses D, Bernier M, Di, Stefano AL. The 2016 World Health Organization classification of tumours of the central nervous system. La Presse Médicale. 2018;47:e187–e200. doi: 10.1016/j.lpm.2018.04.015. - DOI - PubMed
    1. Miller KD, Ostrom QT, Kruchko C, Patil N, Tihan T, Cioffi G, et al. Brain and other central nervous system tumor statistics, 2021. CA: a Cancer J Clin. 2021;71:381–406. - PubMed
    1. Eckel-Passow JE, Lachance DH, Molinaro AM, Walsh KM, Decker PA, Sicotte H, et al. Glioma Groups Based on 1p/19q, IDH, and TERT Promoter Mutations in Tumors. New Engl J Med. 2015;372:2499–508. doi: 10.1056/NEJMoa1407279. - DOI - PMC - PubMed
    1. Brat D, Verhaak R, Aldape K, Yung W, Salama S, Cooper L, et al. Comprehensive, integrative genomic analysis of diffuse lower-grade gliomas. N Engl J Med. 2015;2481:10. - PMC - PubMed
    1. Ceccarelli M, Barthel FP, Malta TM, Sabedot TS, Salama SR, Murray BA, et al. Molecular Profiling Reveals Biologically Discrete Subsets and Pathways of Progression in Diffuse Glioma. Cell. 2016;164:550–63. doi: 10.1016/j.cell.2015.12.028. - DOI - PMC - PubMed

Publication types

MeSH terms