. 2024 Feb 14:18:1357499.
doi: 10.3389/fncel.2024.1357499. eCollection 2024.

Substrate-bound and soluble domains of tenascin-C regulate differentiation, proliferation and migration of neural stem and progenitor cells

Affiliations

Substrate-bound and soluble domains of tenascin-C regulate differentiation, proliferation and migration of neural stem and progenitor cells

Kristin Glotzbach et al. Front Cell Neurosci. .

Abstract

Introduction: The lack of regenerative capacity of the central nervous system is one of the major challenges nowadays. The knowledge of guidance cues that trigger differentiation, proliferation, and migration of neural stem and progenitor cells is one key element in regenerative medicine. The extracellular matrix protein tenascin-C (Tnc) is a promising candidate to regulate cell fate due to its expression in the developing central nervous system and in the adult neural stem cell niches. Of special interest are the alternatively spliced fibronectin type III (FnIII) domains of Tnc whose combinatorial diversity could theoretically generate up to 64 isoforms in the mouse. A total of 27 isoforms have already been discovered in the developing brain, among others the domain combinations A1D, CD, and A124BCD.

Methods: In the present study, these domains as well as the combination of the constitutively expressed FnIII domains 7 and 8 (78) were expressed in Chinese hamster ovary cells as pseudo-antibodies fused to the Fc-fragment of a human immunoglobulin G antibody. The fusion proteins were presented to primary mouse neural stem/progenitor cells (NSPCs) grown as neurospheres, either as coated culture substrates or as soluble additives in vitro. The influence of the domains on the differentiation, proliferation and migration of NSPCs was analyzed.

Results: We observed that the domain combination A124BCD promoted the differentiation of neurons and oligodendrocytes, whereas the domain A1D supported astrocyte differentiation. The constitutively expressed domain 78 had a proliferation and migration stimulating impact. Moreover, most effects were seen only in one of the presentation modes but not in both, suggesting different effects of the Tnc domains in two- and three-dimensional cultures.

Discussion: This knowledge about the different effect of the Tnc domains might be used to create artificial three-dimensional environments for cell transplantation. Hydrogels spiked with Tnc-domains might represent a promising tool in regenerative medicine.

Keywords: alternatively spliced fibronectin III domains; dichotomy of coated substrate and soluble additives; differentiation; migration; neural stem/progenitor cells; proliferation; tenascin-C.


Conflict of interest statement

The authors declare that the research was conducted in the absence of any commercial or financial relationships that could be construed as a potential conflict of interest.

Figures
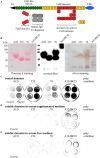
FIGURE 1
FIGURE 1
Characterization of purified Fc recombinants and coating test. (A) Schematic overview of a Tnc monomer with the location of the analyzed FnIII domains and their link to the human IgG Fc fragment. (B) Examination of the purity of the produced Fc recombinants via Ponceau S staining, western blot analysis and silver staining. (C) Coating test with coated domains on cell culture dishes. Fc-constructs were visualized by the anti-Fc-antibody. (D) Coating test with soluble domains in serum-supplemented medium on cell culture dishes. Fc-constructs were visualized by the anti-Fc-antibody. (E) Coating test with soluble domains in serum-free medium on cell culture dishes. Fc-constructs were visualized by the anti-Fc-antibody.
FIGURE 2
FIGURE 2
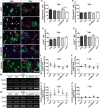
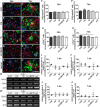
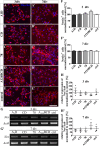
Differentiation assay of neurons and astrocytes treated with the soluble FnIII domains of Tnc. (A–E’) Exemplary images of the ICC for βIII-tubulin-positive neurons (red) and GFAP-positive astrocytes (green). Nuclei were stained with Hoechst (blue). (F–G’) Quantitative evaluation of the percentage of βIII-tubulin-positive and GFAP-positive cells normalized to the control. The mean of the control was set as a baseline of 100%. (H,H’) Exemplary images of the PCR for Tubb3, Gfap, and Actb. (I–J’) Evaluation of the relative expression of the gene Tubb3 and Gfap in relation to the expression of Actb. The values were normalized to the control which was set as a baseline of 100%. [scale bar: 100 μm; div = days in vitro; mean ± SEM; ICC: N = 3, n = 18; (F,F’,G) ANOVA with post-hoc Bonferroni’s test, (G’) Kruskal–Wallis test with post-hoc Dunn’s test; PCR: N = 3, n = 3; (I–J’) Kruskal–Wallis test with post-hoc Dunn’s test; *p ≤ 0.05].
FIGURE 3
FIGURE 3
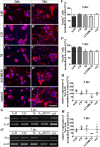
Differentiation assay of neurons and astrocytes cultured on coated FnIII domains of Tnc. (A–E’) Exemplary images of the ICC for βIII-tubulin-positive neurons (red) and GFAP-positive astrocytes (green). Nuclei were stained with Hoechst (blue). (F–G’) Quantitative evaluation of the percentage of βIII-tubulin-positive and GFAP-positive cells normalized to the control. The mean of the control was set as a baseline of 100%. (H,H’) Exemplary images of the PCR for Tubb3, Gfap, and Actb. (I-J’) Evaluation of the relative expression of the gene Tubb3 and Gfap in relation to the expression of Actb. The values were normalized to the control which was set as a baseline of 100%. [scale bar: 100 μm; div = days in vitro; mean ± SEM; ICC: N = 3, n = 18; (F,G) ANOVA with post-hoc Bonferroni’s test, (F’,G’) Kruskal–Wallis test with post-hoc Dunn’s test; PCR: N = 3, n = 3; (I–J’) Kruskal–Wallis test with post-hoc Dunn’s test; *p ≤ 0.05].
FIGURE 4
FIGURE 4
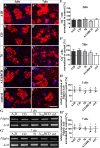
Differentiation assay of oligodendrocytes cultured on coated FnIII domains of Tnc. (A–E’) Exemplary images of the ICC for O4-positive oligodendrocytes (red). Nuclei were stained with Hoechst (blue). (F,F’) Quantitative evaluation of the percentage of O4-positive cells normalized to the control. The mean of the control was set as a baseline of 100%. (G,G’) Exemplary images of the PCR for Pdgfra and Actb. (H,H’) Evaluation of the relative expression of the gene Pdgfra in relation to the expression of Actb. The values were normalized to the control which was set as a baseline of 100%. [scale bar: 100 μm; div = days in vitro; mean ± SEM; ICC: N = 3, n = 18; (F’) ANOVA with post-hoc Bonferroni’s test, (F) Kruskal–Wallis test with post-hoc Dunn’s test; PCR: N = 3, n = 3; (H,H’) Kruskal–Wallis test with post-hoc Dunn’s test].
FIGURE 5
FIGURE 5
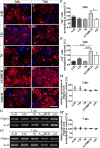
Differentiation assay of oligodendrocytes treated with soluble FnIII domains of Tnc. (A–E’) Exemplary images of the ICC for O4-positive oligodendrocytes (red). Nuclei were stained with Hoechst (blue). (F,F’) Quantitative evaluation of the percentage of O4-positive cells normalized to the control. The mean of the control was set as a baseline of 100%. (G,G’) Exemplary images of the PCR for Pdgfra and Actb. (H,H’) Evaluation of the relative expression of the gene Pdgfra in relation to the expression of Actb. The values were normalized to the control which was set as a baseline of 100%. [scale bar: 100 μ m; div = days in vitro; mean ± SEM; ICC: N = 3, n = 18; (F,F’) Kruskal–Wallis test with post-hoc Dunn’s test; PCR: N = 3, n = 3; (H,H’) Kruskal–Wallis test with post-hoc Dunn’s test; *p ≤ 0.05, ***p ≤ 0.001].
FIGURE 6
FIGURE 6
Differentiation assay of progenitor cells cultured on coated FnIII domains of Tnc. (A–E’) Exemplary images of the ICC for nestin-positive progenitor cells (red). Nuclei were stained with Hoechst (blue). (F,F’) Quantitative evaluation of the percentage of nestin-positive cells normalized to the control. The mean of the control was set as a baseline of 100%. (G,G’) Exemplary images of the PCR for Nes and Actb. (H,H’) Evaluation of the relative expression of the gene Nes in relation to the expression of Actb. The values were normalized to the control which was set as a baseline of 100%. [scale bar: 100 μm; div = days in vitro; mean ± SEM; ICC: N = 3, n = 18; (F’) ANOVA with post-hoc Bonferroni’s test, (F) Kruskal–Wallis test with post-hoc Dunn’s test; PCR: N = 3, n = 3, (H,H’) Kruskal–Wallis test with post-hoc Dunn’s test].
FIGURE 7
FIGURE 7
Differentiation assay of progenitor cells treated with soluble FnIII domains of Tnc. (A–E’) Exemplary images of the ICC for nestin-positive progenitor cells (red). Nuclei were stained with Hoechst (blue). (F–F’) Quantitative evaluation of the percentage of nestin-positive cells normalized to the control. The mean of the control was set as a baseline of 100%. (G,G’) Exemplary images of the PCR for Nes and Actb. (H,H’) Evaluation of the relative expression of the gene Nes in relation to the expression of Actb. The values were normalized to the control which was set as a baseline of 100%. [scale bar: 100 μm; div = days in vitro; mean ± SEM; ICC: N = 3, n = 18; (F,F) Kruskal–Wallis test with post-hoc Dunn’s test; PCR: N = 3, n = 3; (H,H’) Kruskal–Wallis test with post-hoc Dunn’s test].
FIGURE 8
FIGURE 8
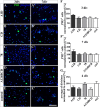
Proliferation assay of NSPCs cultured on coated FnIII domains of Tnc. (A-E’) Exemplary images of the ICC for PH3-positive progenitor cells (green) under differentiation condition. Nuclei were stained with Hoechst (blue). (F,F’) Quantitative evaluation of the percentage of PH3-positive cells under differentiation conditions normalized to the control. The mean of the control was set as a baseline of 100%. (G) Quantification of the average of cell divisions tracked with a video microscope under proliferation condition for 4 div. The values were normalized to the control which was set as a baseline of 100%. [scale bar: 100 μm; div = days in vitro; mean ± SEM; ICC: N = 3, n = 18; (F’) ANOVA with post-hoc Bonferroni’s test, (F) Kruskal–Wallis test with post-hoc Dunn’s test; video microscope: N = 3, n = see chapter 2.7; (G) Kruskal–Wallis test with post-hoc Dunn’s test].
FIGURE 9
FIGURE 9
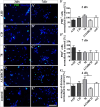
Proliferation assay of NSPCs treated with soluble FnIII domains of Tnc. (A-E’) Exemplary images of the ICC for PH3-positive progenitor cells (green) under differentiation condition. Nuclei were stained with Hoechst (blue). (F,F’) Quantitative evaluation of the percentage of PH3-positive cells under differentiation conditions normalized to the control. The mean of the control was set as a baseline of 100%. (G) Quantification of the average of cell divisions tracked with a video microscope under proliferation condition for 4 div. The values were normalized to the control which was set as a baseline of 100%. [scale bar: 100 μm; div = days in vitro; mean ± SEM; ICC: N = 3, n = 18; (F,F’) Kruskal–Wallis test with post-hoc Dunn’s test; video microscope: N = 3, n = see chapter 2.7; (G) Kruskal–Wallis test with post-hoc Dunn’s test; *p ≤ 0.05].
FIGURE 10
FIGURE 10
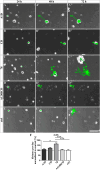
Analysis of the migration of NSPCs cultured on coated FnIII domains of Tnc for 4 div. (A-E”) Exemplary images of migrating NSPCs under proliferation conditions in a video microscope. Migrated distance was labeled in green. (F) Quantitative evaluation of the traveled distance per day by one cell normalized to the control. The mean of the control was set as a baseline of 100%. [scale bar: 100 μm; div = days in vitro; mean ± SEM; N = 3, n = see chapter 2.8; (F) Kruskal–Wallis test with post-hoc Dunn’s test; *p ≤ 0.05, ***p ≤ 0.001].
FIGURE 11
FIGURE 11
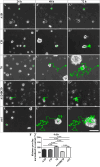
Analysis of the migration of NSPCs treated with soluble FnIII domains of Tnc for 4 div. (A-E”) Exemplary images of migrating NSPCs under proliferation conditions in a video microscope. Migrated distance was labeled in green. (F) Quantitative evaluation of the traveled distance per day by one cell normalized to the control. The mean of the control was set as a baseline of 100%. [scale bar: 100 μm; div = days in vitro; mean ± SEM; N = 3, n = see chapter 2.8; (F) Kruskal–Wallis test with post-hoc Dunn’s test; ***p ≤ 0.001].
FIGURE 12
FIGURE 12
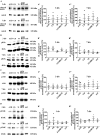
Analysis of the activation of intracellular signaling pathways including the proteins notch, Erk, Akt and FAK in NSPCs cultured on coated FnIII domains of Tnc. (A–D) Exemplary images of western blots using antibodies against cleaved notch, notch, pErk, tErk, pAkt, tAkt, pFAK and tFAK. (A’–D”) Quantification of the relative expression of the phosphorylated or cleaved proteins in relation to the total proteins. The values were normalized to the control. The mean of the control was set as a baseline of 100%. (div = days in vitro; mean ± SEM; N = 3, n = 3; Kruskal–Wallis test with post-hoc Dunn’s test).
FIGURE 13
FIGURE 13
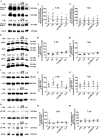
Analysis of the activation of intracellular signaling pathways including the proteins notch, Erk, Akt and FAK in NSPCs treated with soluble FnIII domains of Tnc. (A–D) Exemplary images of western blots using antibodies against cleaved notch, notch, pErk, tErk, pAkt, tAkt, pFAK, and tFAK. (A’–D”) Quantification of the relative expression of the phosphorylated or cleaved proteins in relation to the total proteins. The values were normalized to the control. The mean of the control was set as a baseline of 100%. (div = days in vitro; mean ± SEM; N = 3, n = 3; Kruskal–Wallis test with post-hoc Dunn’s test).
FIGURE 14
FIGURE 14
Analysis of the relative expression of Sam68/Khdrbs1, Vav3, and Tnc in NSPCs cultured on coated FnIII domains of Tnc. (A–A’) Exemplary images of western blots using antibodies against Sam68 and α-tubulin. (B,C) Quantification of the relative expression of Sam68 in relation to α-tubulin. The values were normalized to the control. The mean of the control was set as a baseline of 100%. (D,D’) Exemplary images of the PCR for the genes Khdrbs1, Vav3, Tnc, and Actb. (E–J) Evaluation of the relative expression of the genes Khdrbs1, Vav3, and Tnc in relation to the expression of Actb. The values were normalized to the control which was set as a baseline of 100%. (div = days in vitro; mean ± SEM; N = 3, n = 3; Kruskal–Wallis test with post-hoc Dunn’s test).
FIGURE 15
FIGURE 15
Analysis of the relative expression of Sam68/Khdrbs1, Vav3, and Tnc in NSPCs treated with soluble FnIII domains of Tnc. (A,A’) Exemplary images of western blots using antibodies against Sam68 and α-tubulin. (B,C) Quantification of the relative expression of Sam68 in relation to α-tubulin. The values were normalized to the control. The mean of the control was set as a baseline of 100%. (D,D’) Exemplary images of the PCR for the genes Khdrbs1, Vav3, Tnc, and Actb. (E–J) Evaluation of the relative expression of the genes Khdrbs1, Vav3, and Tnc in relation to the expression of Actb. The values were normalized to the control which was set as a baseline of 100%. (div = days in vitro; mean ± SEM; N = 3, n = 3; Kruskal–Wallis test with post-hoc Dunn’s test).

Similar articles

References

    1. Adamsky K., Schilling J., Garwood J., Faissner A., Peles E. (2001). Glial tumor cell adhesion is mediated by binding of the FNIII domain of receptor protein tyrosine phosphatase β (RPTPβ) to tenascin C. Oncogene 20 609–618. 10.1038/sj.onc.1204119 - DOI - PubMed
    1. Balch C., Dedman J. R. (1997). Annexins II and V inhibit cell migration. Exp. Cell Res. 237 259–263. 10.1006/excr.1997.3817 - DOI - PubMed
    1. Bartsch S., Bartsch U., Dorries U., Faissner A., Weller A., Ekblom P., et al. (1992). Expression of tenascin in the developing and adult cerebellar cortex. J. Neurosci. 12 736–749. 10.1523/JNEUROSCI.12-03-00736.1992 - DOI - PMC - PubMed
    1. Bauch J., Faissner A. (2022). The extracellular matrix proteins tenascin-C and tenascin-R retard oligodendrocyte precursor maturation and myelin regeneration in a cuprizone-induced long-term demyelination animal model. Cells 11:1773. 10.3390/cells11111773 - DOI - PMC - PubMed
    1. Bell S. C., Pringle J. H., Taylor D. J., Malak T. M. (1999). Alternatively spliced tenascin-C mRNA isoforms in human fetal membranes. Mol. Hum. Reprod. 5, 1066–1076. 10.1093/molehr/5.11.1066 - DOI - PubMed

Grants and funding

The author(s) declare financial support was received for the research, authorship, and/or publication of this article. This study was promoted by a grant from the Deutsche Forschungsgemeinschaft (grant number: 397037958).