

3D imaging of aqueous veins and surrounding sclera using a dual-wavelength photoacoustic microscopy
- PMID: 38420307
- PMCID: PMC10898558
- DOI: 10.1364/BOE.505288
3D imaging of aqueous veins and surrounding sclera using a dual-wavelength photoacoustic microscopy
Abstract
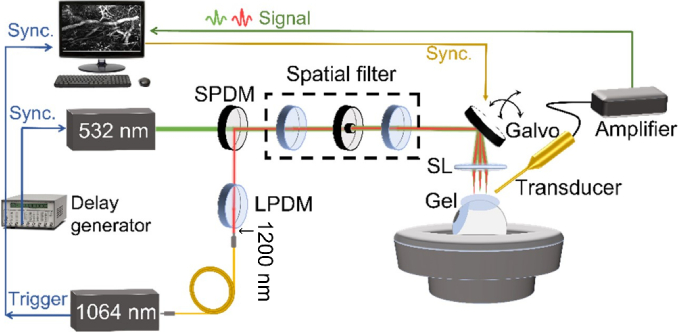
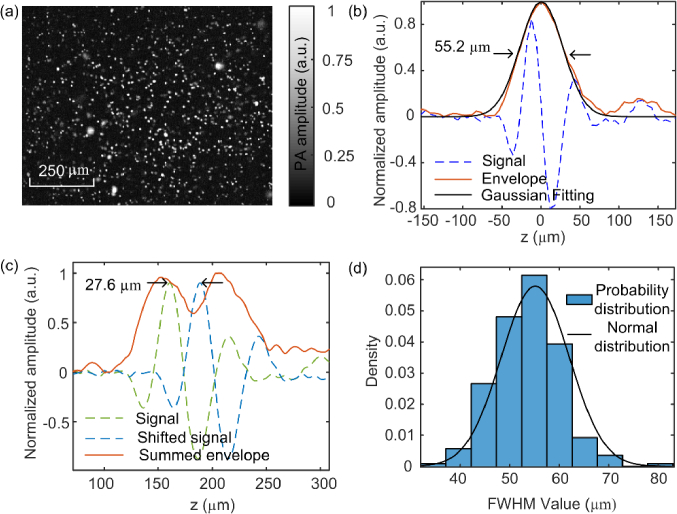
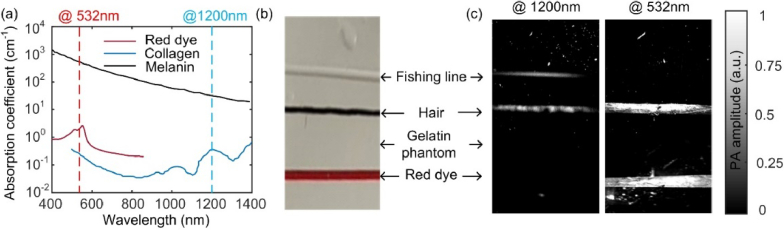
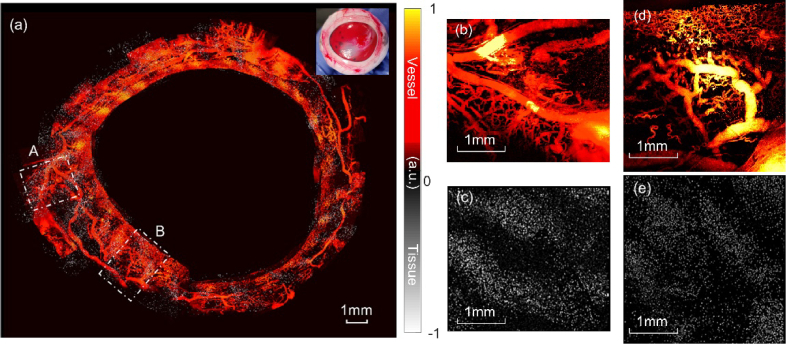
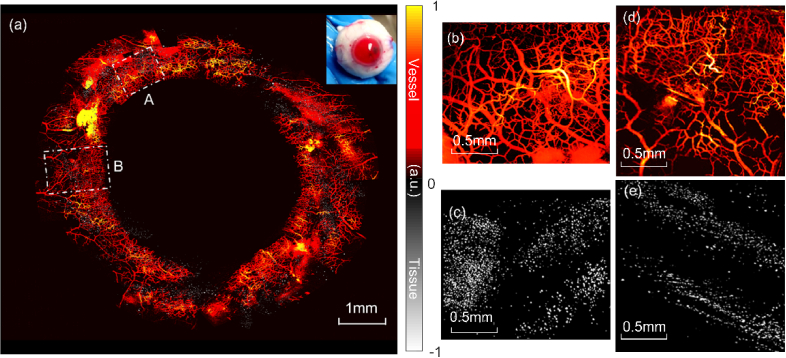
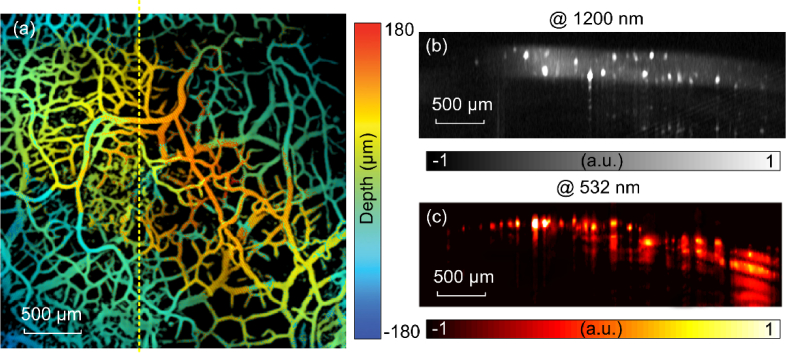
Understanding aqueous outflow resistance at the level of aqueous veins has been a challenge to the management of glaucoma. This study investigated resolving the anatomies of aqueous veins and the textures of surrounding sclera using photoacoustic microscopy (PAM). A dual wavelength PAM system was established and validated using imaging phantoms, porcine and human globes perfused with an optical contrast agent ex vivo. The system shows lateral resolution of 8.23 µm and 4.70 µm at 1200 nm and 532 nm, respectively, and an axial resolution of 27.6 µm. The system is able to separately distinguish the aqueous veins and the sclera with high contrast in full circumference of the porcine and human globes.
© 2023 Optica Publishing Group.
Conflict of interest statement
The authors declare no conflicts of interest.
Figures

Similar articles
-
Method for the biomechanical analysis of aqueous veins and perilimbal sclera by three-dimensional photoacoustic imaging and strain field calculation.Sci Rep. 2021 Nov 11;11(1):22108. doi: 10.1038/s41598-021-01458-1. Sci Rep. 2021. PMID: 34764362 Free PMC article.
-
Noninvasive chorioretinal imaging in living rabbits using integrated photoacoustic microscopy and optical coherence tomography.Opt Express. 2017 Jul 10;25(14):15947-15955. doi: 10.1364/OE.25.015947. Opt Express. 2017. PMID: 28789105 Free PMC article.
-
Optical-resolution photoacoustic microscopy with ultrafast dual-wavelength excitation.J Biophotonics. 2020 Jun;13(6):e201960229. doi: 10.1002/jbio.201960229. Epub 2020 Mar 3. J Biophotonics. 2020. PMID: 32049415
-
[Imaging of the Intrascleral Aqueous Drainage System - New Insights for Glaucoma Surgery Targeting the Trabecular Meshwork].Klin Monbl Augenheilkd. 2018 Mar;235(3):309-314. doi: 10.1055/s-0042-123193. Epub 2017 Feb 10. Klin Monbl Augenheilkd. 2018. PMID: 28187473 Review. German.
-
Pulsatile flow into the aqueous veins: manifestations in normal and glaucomatous eyes.Exp Eye Res. 2011 May;92(5):318-27. doi: 10.1016/j.exer.2011.03.011. Epub 2011 Mar 31. Exp Eye Res. 2011. PMID: 21440541 Free PMC article. Review.
References
-
- Flaxman S. R., Bourne R. R. A., Resnikoff S., et al. S. Vision Loss Expert Group of the Global Burden of Disease , “Global causes of blindness and distance vision impairment 1990-2020: a systematic review and meta-analysis,” Lancet Global Health 5(12), e1221–e1234 (2017).10.1016/S2214-109X(17)30393-5 - DOI - PubMed
LinkOut - more resources
Full Text Sources
Miscellaneous