. 2024 Feb 28;10(1):21.
doi: 10.1038/s41540-024-00346-4.

Integrative temporal multi-omics reveals uncoupling of transcriptome and proteome during human T cell activation

Affiliations

Integrative temporal multi-omics reveals uncoupling of transcriptome and proteome during human T cell activation

Harshi Weerakoon et al. NPJ Syst Biol Appl. .

Abstract

Engagement of the T cell receptor (TCR) triggers molecular reprogramming leading to the acquisition of specialized effector functions by CD4 helper and CD8 cytotoxic T cells. While transcription factors, chemokines, and cytokines are known drivers in this process, the temporal proteomic and transcriptomic changes that regulate different stages of human primary T cell activation remain to be elucidated. Here, we report an integrative temporal proteomic and transcriptomic analysis of primary human CD4 and CD8 T cells following ex vivo stimulation with anti-CD3/CD28 beads, which revealed major transcriptome-proteome uncoupling. The early activation phase in both CD4 and CD8 T cells was associated with transient downregulation of the mRNA transcripts and protein of the central glucose transport GLUT1. In the proliferation phase, CD4 and CD8 T cells became transcriptionally more divergent while their proteome became more similar. In addition to the kinetics of proteome-transcriptome correlation, this study unveils selective transcriptional and translational metabolic reprogramming governing CD4 and CD8 T cell responses to TCR stimulation. This temporal transcriptome/proteome map of human T cell activation provides a reference map exploitable for future discovery of biomarkers and candidates targeting T cell responses.


Conflict of interest statement

The authors declare no competing interests.

Figures
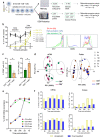
Fig. 1
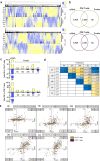
Fig. 1. Minor changes to T cell proteome during early stages of activation.
a Schematic of CD4 and CD8 T cells isolation, TCR stimulation, and parallel transcriptomic and proteomic analysis at 6-time points using RNA sequencing (RNA-seq) and data-dependent acquisition proteomic analysis (DDA-proteomics), respectively. The number of transcripts/proteins pre- and post-quality control is indicated, along with criteria for differential expression (DE) analysis. b Characterization of stages of T cell activation using the T cell activation markers, CD69 and CD226, and proliferative T cells (CTV-) by flow cytometry; early activation (CD69highCD226lowCTV+) and late activation (CD69highCD226lowCTV-). c Bar graphs show the mean percentage and the standard error of the mean (SEM) error bars of CD69+ and CTV- T cells at 7d. Significance was determined using Mann-Whitney rank analysis to compare between CD4 and CD8 T cells. *p < 0.05. d Principal component analysis shows the relationship of mRNA and protein data from three biological replicates across different time points. e The ratio of mRNA and protein differentially expressed at different time points in relation to their corresponding unstimulated controls (0 h = 1). f Bar charts indicate DE genes and proteins in CD4 T cells and CD8 T cells as a percentage of total mRNA/ proteins detected at each time point in relation to unstimulated cells (0 h). yellow: upregulated, blue: downregulated mRNA/ proteins.
Fig. 2
Fig. 2. Proteome and transcriptome rewire at late stages of T cell activation.
a Heatmaps show the expression patterns of commonly quantified mRNA transcripts and proteins in CD4 and CD8 T cells. Yellow: upregulated, blue: downregulated. Row clustering but not column clustering was applied when generating the heatmap. b Venn diagrams showing the overlap between quantified mRNA and protein obtained from transcriptomic and proteomic data. c DE proteins encoded by mRNA differentially expressed at 6 h following activation. The number of the proteins regulated at each time point is shown. FDR < 0.05. The dotted line represents the total number of proteins upregulated (yellow) or downregulated (blue). d Pearson correlation between DE genes and proteins over the entire time course of T-cell activation. Blue to yellow gradient shows low to high correlation values for CD4 and CD8 T cells at each time point. e Scatter graph with four quadrants indicates the distribution and correlation between gene and protein expression changes in both CD4 and CD8 T cells at different time points following activation. Each region lists the percentage of T cells falling in each category. mRNA distribution is represented in the “x” axis and protein distribution in the “y” axis. ‘R’ represents the Pearson correlation coefficient.
Fig. 3
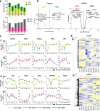
Fig. 3. CD4 and CD8 T cells become more divergent following TCR stimulation.
a Stacked bar graphs showing the total number of proteins and mRNA transcripts DE between CD4 and CD8 T cells at each time point. Columns represent transcripts and proteins overexpressed in each T cell subset. b Volcano plots showing proteins mRNA DE between CD4 and CD8 T cells at 0 h. Names of the top 10 overexpressed mRNA and proteins in CD8 and CD4 T cells are indicated. c Expression kinetics of proteins upregulated in CD4 (i) and CD8 (ii) T cells and their corresponding mRNA transcripts. Intensities of each time point are shown as mean and the standard error of the mean (SEM) error bars (n = 3). d Heatmap shows the relationship of protein/mRNA expression between DE CD4 and CD8 T cells over the time course. mRNA and protein commonly quantified between two T cell subsets were used. Average linkage and Pearson distance measurement were used in column clustering. The clusters of mRNA transcripts and proteins are indicated by distinct colors.
Fig. 4
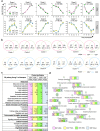
Fig. 4. Metabolic signatures in distinct phases of T cell responses.
a Co-expression cluster of transcriptome and proteome data from CD4 and CD8 T cells. DE mRNA transcripts of each dataset were clustered using mFuzz soft clustering (R package). mRNA or protein intensities at each time point are shown as the mean and the standard error of the mean (SEM) error bars. Number of mRNA/proteins included in each cluster are indicated for CD4 and CD8 T cells, respectively. mRNA transcripts with log2fc > 1.5 or < -1.5 and proteins with log2fc ≥ 1.0 or ≤ –1.0 were considered as DE. Data is shown as fold change of mRNA and protein intensities in activated T cells relative to 0 h. b Venn diagrams show the overlap of mRNA and protein identified in each cluster between activated CD4 and CD8 T cells. c Enriched KEGG pathways (FDR < 0.05) for co-expression clusters (defined in Fig. 4A) of CD4 and CD8 T cell. d Molecular interaction, reaction, and relation network showing the relationship of the top first 20 enriched KEGG pathways categorized under ‘metabolism’ (FDR < 0.05). The network was generated using all DE mRNA transcripts and proteins. The size of each node directly correlates with the number of genes included. Edges represent sharing of 20% or more genes between two nodes while the thickness of the edge directly correlates with the number of overlapping genes. The number in each colored box indicates the co-expression clusters in Fig. 4a from where the corresponding mRNA transcript/ protein was enriched.
Fig. 5
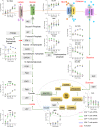
Fig. 5. Rewiring of aerobic glycolysis and glutaminolysis results in T cell expansion.
T cells utilize glutamine through the glutaminolysis pathway to produce energy during the activation. Graphs show the dynamic protein and gene expression patterns of the main glucose and glutamine transporters and the rate-limiting/ key enzymes of aerobic glycolysis and glutaminolysis during CD4 and CD8 T cell activation (6 h–24 h) and proliferation (3d and 7d). Expressed proteins are named as follows: GLUT-1 (SLC2A1)—the main glucose transporter in T cells, SLC7A5, SLC3A2, and SLC1A5—glutamine transporters, SLC16A3 —lactate transporter, HK2, PFKP, and PKM—the rate-limiting enzymes of glycolysis, PFKFB3—a key allosteric activator of glycolysis, LDH—the enzyme which converts pyruvate to lactate, GLS—the enzyme which converts glutamine to glutamate and ME2—the enzyme which converts malate to pyruvate in the mitochondrial matrix. Data is shown as fold change of mRNA and protein intensities in activated T cells relative to 0 h. mRNA or protein intensities at each time point are shown as the mean and the standard error of the mean (SEM) error bars.

Similar articles

References

    1. Shah K, Al-Haidari A, Sun J, Kazi JU. T cell receptor (TCR) signaling in health and disease. Signal Transduct. Target. Ther. 2021;6:412. doi: 10.1038/s41392-021-00823-w. - DOI - PMC - PubMed
    1. Kumar BV, Connors TJ, Farber DL. Human T cell development, localization, and function throughout life. Immunity. 2018;48:202–213. doi: 10.1016/j.immuni.2018.01.007. - DOI - PMC - PubMed
    1. Shinzawa M, et al. Reversal of the T cell immune system reveals the molecular basis for T cell lineage fate determination in the thymus. Nat. Immunol. 2022;23:731–742. doi: 10.1038/s41590-022-01187-1. - DOI - PMC - PubMed
    1. Prlic M, Hernandez-Hoyos G, Bevan MJ. Duration of the initial TCR stimulus controls the magnitude but not functionality of the CD8+ T cell response. J. Exp. Med. 2006;203:2135–2143. doi: 10.1084/jem.20060928. - DOI - PMC - PubMed
    1. Au-Yeung BB, et al. A sharp T-cell antigen receptor signaling threshold for T-cell proliferation. Proc. Natl Acad. Sci. USA. 2014;111:E3679–88. doi: 10.1073/pnas.1413726111. - DOI - PMC - PubMed