. 2024 Jan-Dec;16(1):2323236.
doi: 10.1080/19490976.2024.2323236. Epub 2024 Feb 28.

Multi-omics reveals deoxycholic acid modulates bile acid metabolism via the gut microbiota to antagonize carbon tetrachloride-induced chronic liver injury

Affiliations

Multi-omics reveals deoxycholic acid modulates bile acid metabolism via the gut microbiota to antagonize carbon tetrachloride-induced chronic liver injury

Li Zhang et al. Gut Microbes. 2024 Jan-Dec.

Abstract

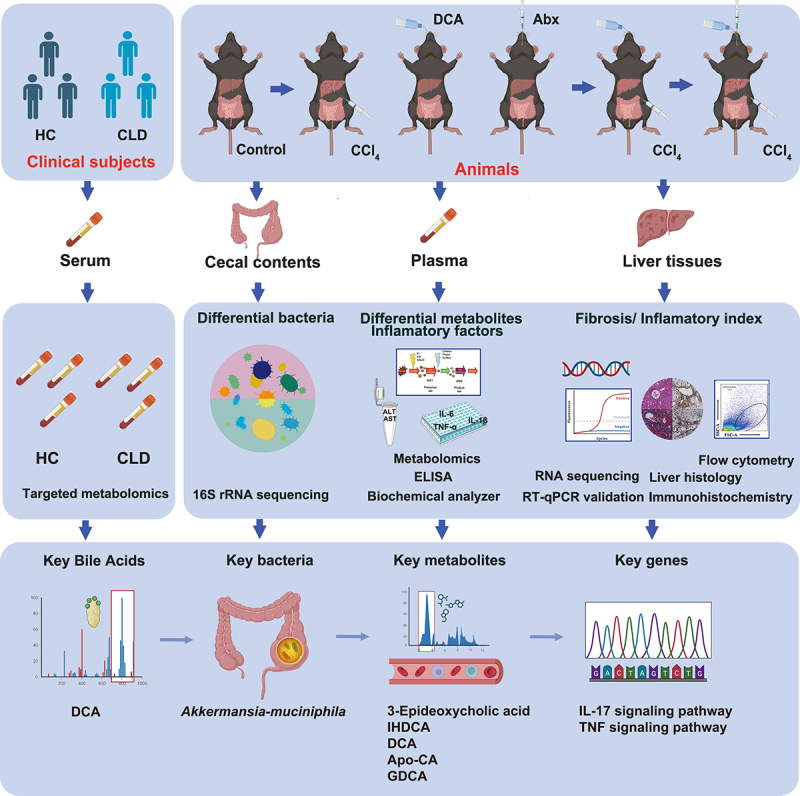
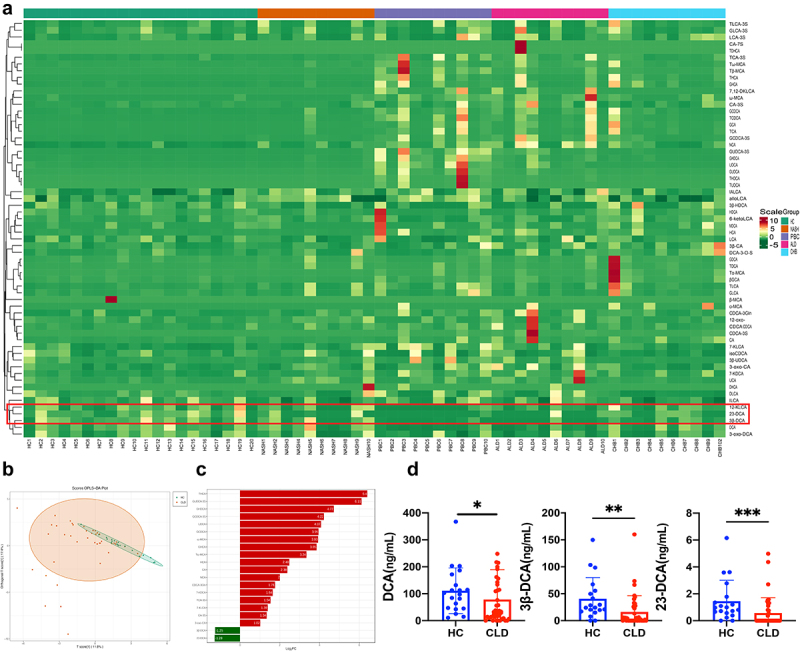
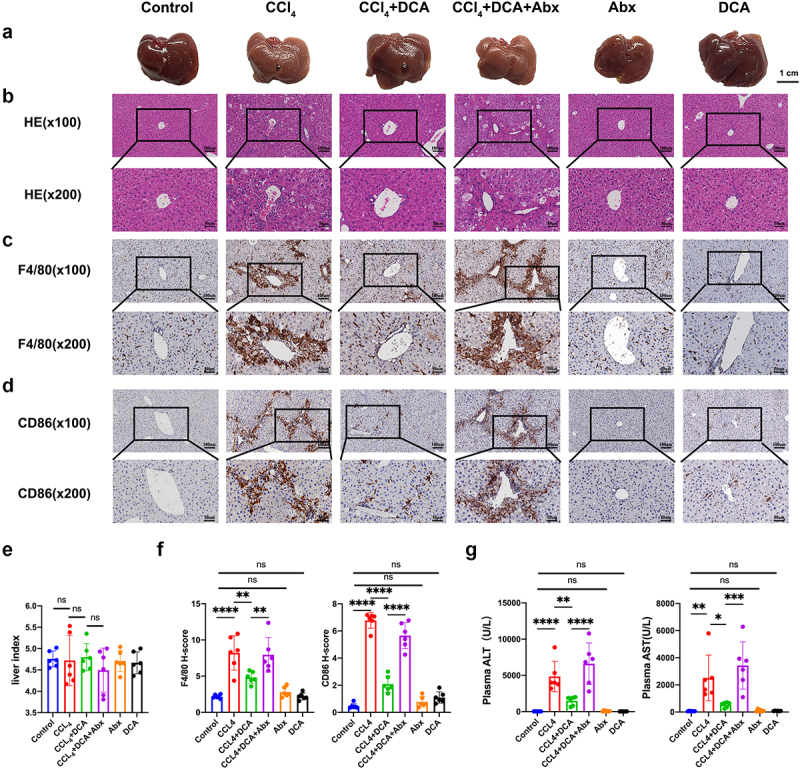
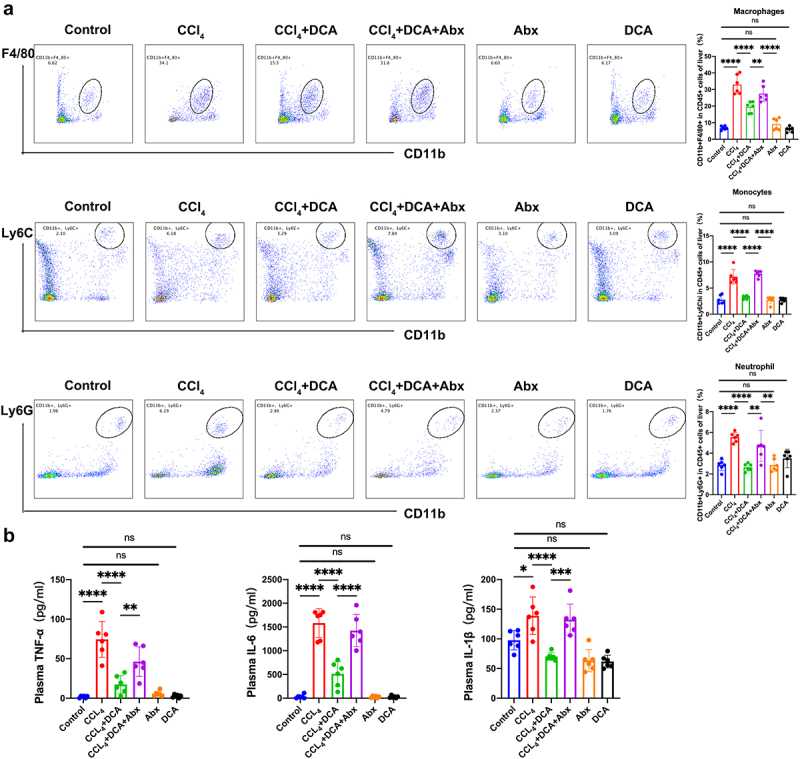
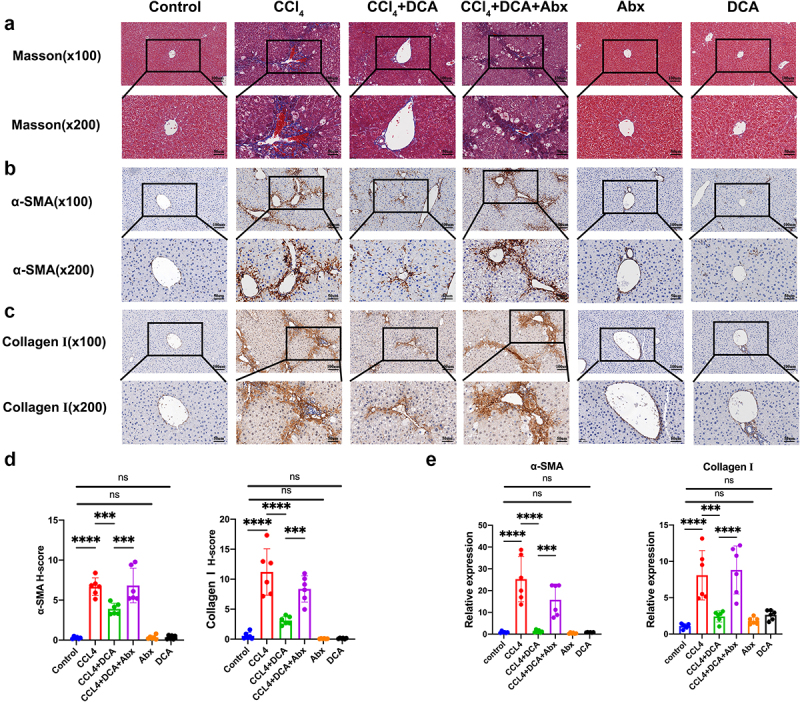
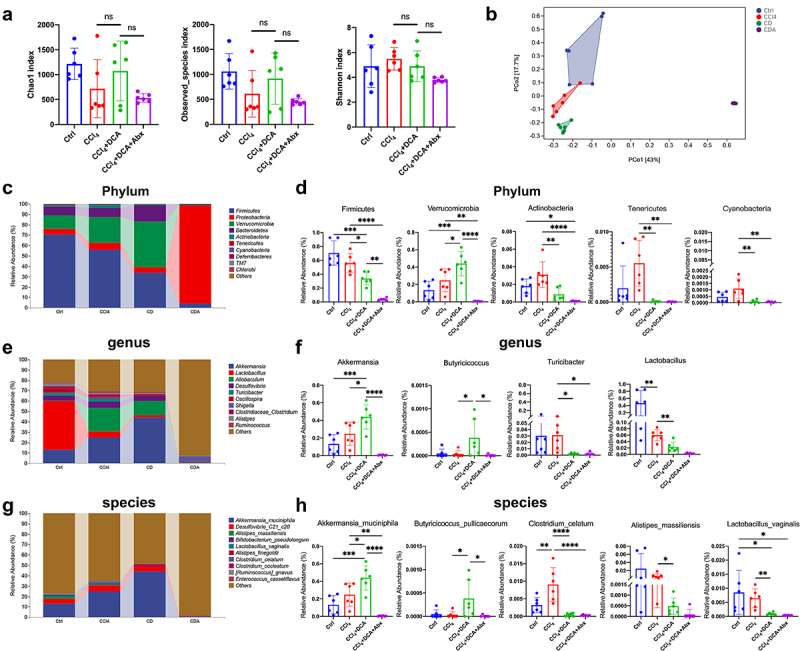
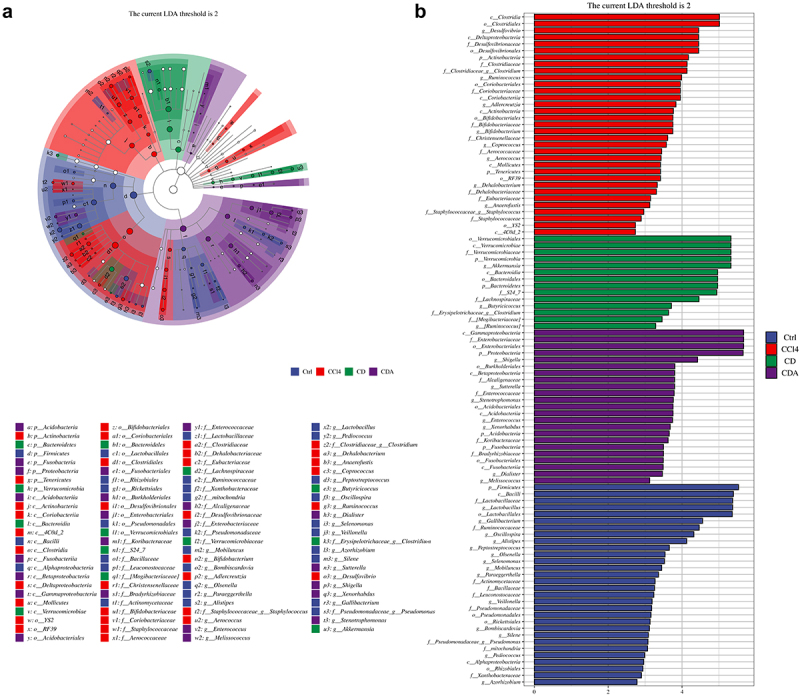
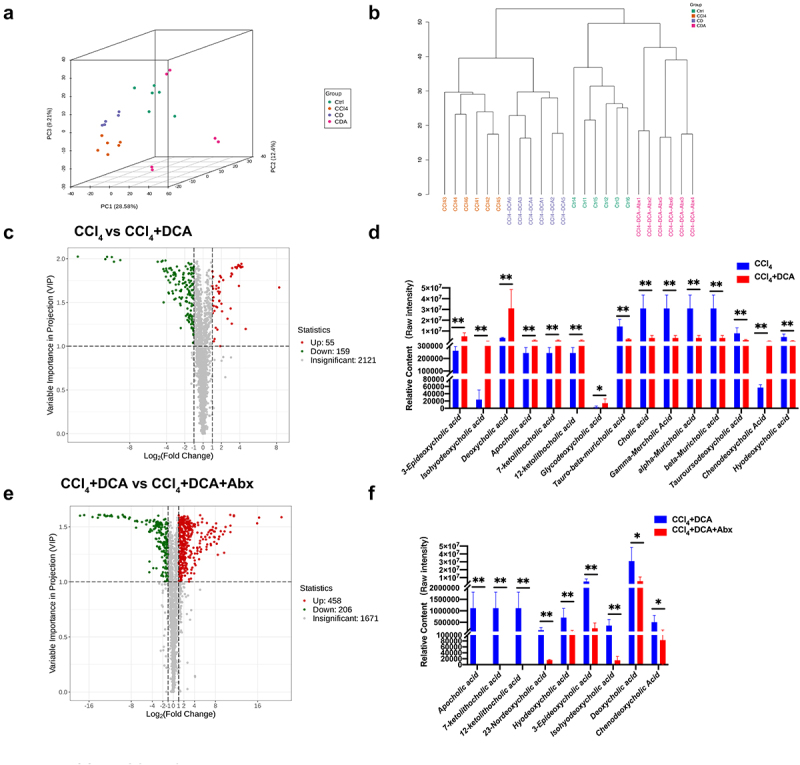
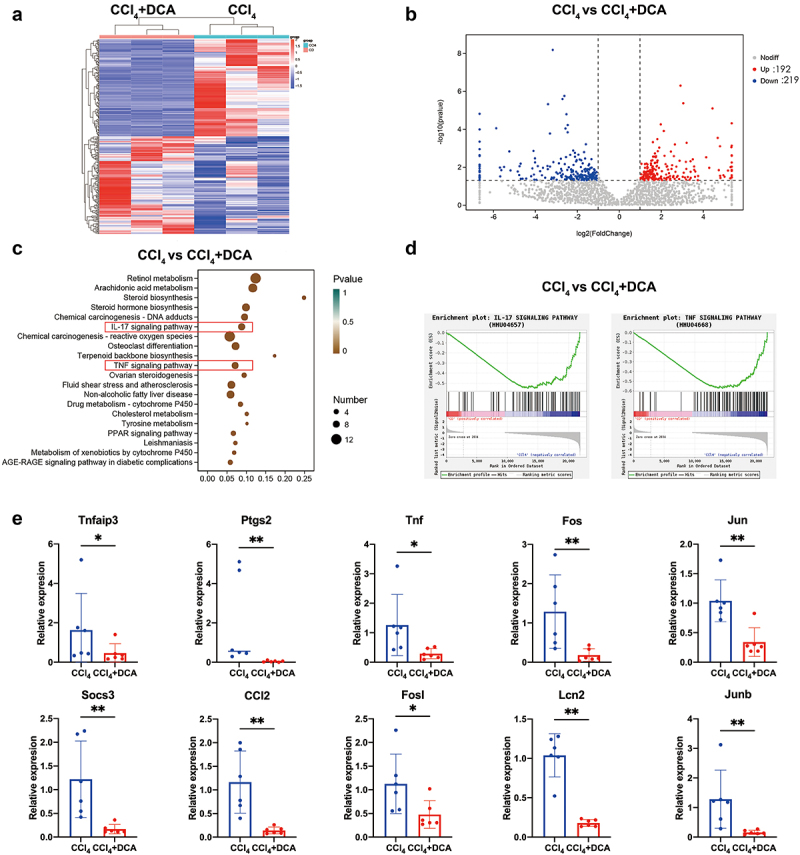
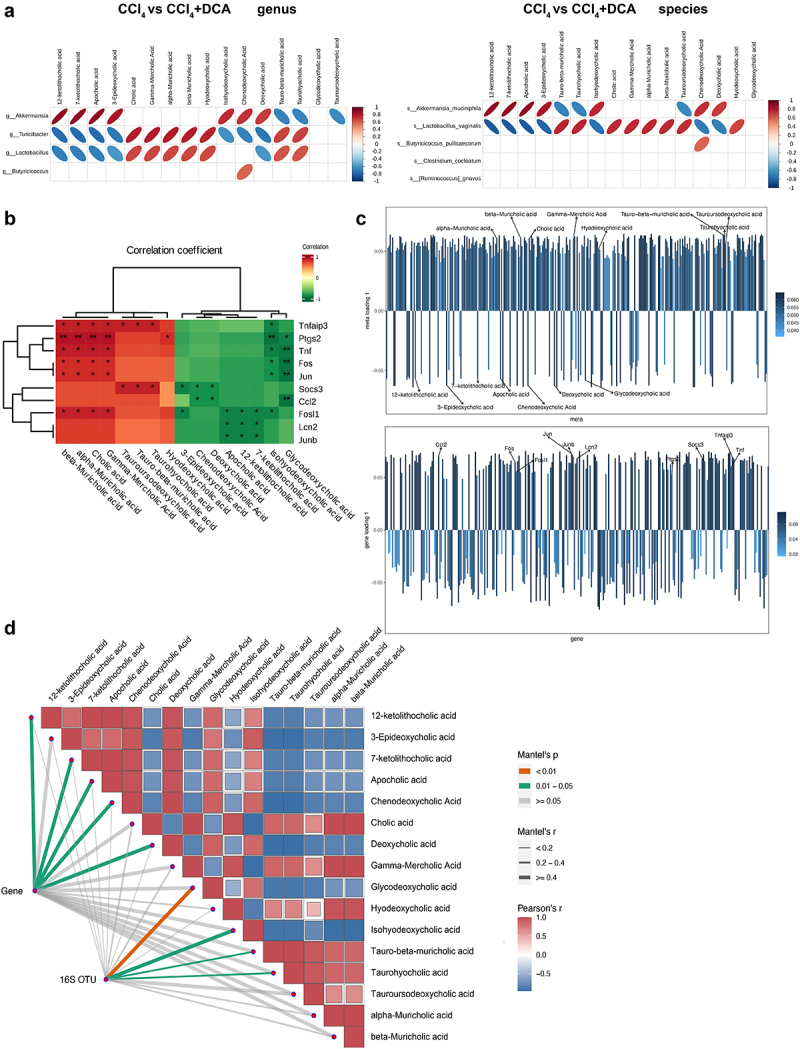
Deoxycholic acid (DCA) serves essential functions in both physiological and pathological liver processes; nevertheless, the relationship among DCA, gut microbiota, and metabolism in chronic liver injury remain insufficiently understood. The primary objective of this study is to elucidate the potential of DCA in ameliorating chronic liver injury and evaluate its regulatory effect on gut microbiota and metabolism via a comprehensive multi-omics approach. Our study found that DCA supplementation caused significant changes in the composition of gut microbiota, which were essential for its antagonistic effect against CCl4-induced chronic liver injury. When gut microbiota was depleted with antibiotics, the observed protective efficacy of DCA against chronic liver injury became noticeably attenuated. Mechanistically, we discovered that DCA regulates the metabolism of bile acids (BAs), including 3-epi DCA, Apo-CA, and its isomers 12-KLCA and 7-KLCA, IHDCA, and DCA, by promoting the growth of A.muciniphila in gut microbiota. This might lead to the inhibition of the IL-17 and TNF inflammatory signaling pathway, thereby effectively countering CCl4-induced chronic liver injury. This study illustrates that the enrichment of A. muciniphila in the gut microbiota, mediated by DCA, enhances the production of secondary bile acids, thereby mitigating chronic liver injury induced by CCl4. The underlying mechanism may involve the inhibition of hepatic IL-17 and TNF signaling pathways. These findings propose a promising approach to alleviate chronic liver injury by modulating both the gut microbiota and bile acids metabolism.

Keywords: Chronic liver injury; deoxycholic acid; gut microbiota; inflammation; metabolism; transcriptome.


Conflict of interest statement

No potential conflict of interest was reported by the author(s).

Figures

Figure 1.
Figure 1.
Experimental design and procedure HC=Healthy control; CLD=Chronic liver disease; DCA=Deoxycholic acid; Abx=Antibiotic cocktail.
Figure 2.
Figure 2.
Characteristics of bile acids profiles in CLD patients (a) heatmap cluster analysis comparing CLD patients and healthy controls. The left cluster line represents the metabolite cluster, and the upper cluster line represents the sample cluster; (b) OPLS-DA score plot illustrating the differentiation between CLD patients and healthy controls; (c) bar chart depicting the differences in metabolite levels between CLD patients and healthy individuals; (d) histograms displaying the levels of 23-DCA, 3β-DCA, and DCA in CLD patients compared to healthy controls. HC: healthy control (n = 20); NASH: nonalcoholic steatohepatitis (n = 10); PBC: primary biliary cholangitis (n = 10); ALD: alcoholic liver disease (n = 10); CHB: chronic hepatitis B; CLD: chronic liver disease (n = 40), *P < .05, **P < .01, ***P < .001.
Figure 3.
Figure 3.
Effect of DCA on the pathological and plasma biochemical indexes of liver inflammation in mice (a) typical appearance of liver; (b) Representative liver histology by H&E staining (×100 and × 200); (c) immunohistochemical staining of F4/80 in liver tissue (×100 and × 200); (d) immunohistochemical staining of CD86 in liver tissue (×100 and × 200); (e) liver index of mice in different groups; (f) quantitative results of histochemical staining of F4/80 and CD86 in liver tissue. (g) Plasma ALT and AST levels. n = 6,*P < .05,**P < .01,***P < .001,****P < .0001. “ns” indicates no significant difference.
Figure 4.
Figure 4.
Effect of DCA on the hepatic inflammatory cells and plasma inflammatory factors in mice (a) detection of inflammatory cells in liver by flow cytometry [flow cytometry plot (left) and bar graph (right)]. Liver macrophages were identified as CD45+F4/80+CD11b+cells. Liver monocytes were identified as CD45+CD11b+Ly6C hi cells. Liver neutrophils were identified as CD45+Ly6G+CD11b+cells; (b) plasma levels of TNF-α, IL-6 and IL-1β. n = 6, *P < .05, **P < .01, ***P < .001, ****P < .0001. “ns” indicates no significant difference.
Figure 5.
Figure 5.
Effect of DCA on the pathological and mRNA expression of liver fibrosis in mice (a) Masson staining of liver tissue (×100 and × 200); (b) immunohistochemical staining of α-SMA (×100 and × 200); (c) immunohistochemical staining of collagen I in liver tissue (×100 and × 200); (d) quantitative results of histochemical staining for α-SMA and collagen I; (e) mRNA expression of α-SMA and collagen I in liver tissue. n = 6, *P < .05, **P < .01, ***P < .001, ****P < .0001. “ns” indicates no significant difference.
Figure 6.
Figure 6.
DCA modulates the composition of gut microbiota (a) α-diversity assessed using Chao1 Index, Observed_ species Index, and Shannon Index for each group; (b) Principal coordinate analysis (PCoA) of gut microbiota; (C) the relative abundance of the top 10 bacteria at the phylum level; (D) Representative histograms of gut microbiota at the phylum level; (E) the relative abundance of the top 10 bacteria at the genus level; (f) Representative histograms of gut microbiota at the genus level; (g) the relative abundance of the top 10 bacteria at the species level; (H) Representative histograms of gut microbiota at the species level. Ctrl: Control; CD: CCl4+DCA; CDA: CCl4+DCA+Abx. n = 6, *P < .05, **P < .01, ***P < .001, ****P < .0001. “ns” indicates no significant difference.
Figure 7.
Figure 7.
LEfse analysis of DCA modulating the composition of gut microbiota (a) the classification branch diagram illustrates the hierarchical relationship of main taxa from phylum to genus (from inner circle to outer circle) in the sample community. The node size corresponds to the average relative abundance of the taxon, and nodes of each color represent significant inter-group differences in these taxa. The abundance is higher in the group samples represented by the color; (b) the distribution bar chart of linear discriminant analysis (LDA) values for significantly different species demonstrates the significantly enriched species within each group and their importance. The LDA score reflects significant differences in bacteria among each group, and only bacteria meeting the significant LDA threshold of 2 are shown. The vertical axis represents taxonomic units with significant differences between groups, while the horizontal axis displays the logarithmic scores of LDA analysis for each taxonomic unit. Ctrl: Control; CD: CCl4+DCA; CDA: CCl4+DCA+Abx. n = 6.
Figure 8.
Figure 8.
DCA regulates plasma bile acid profiles through gut microbiota (a) unsupervised PCA conducted to evaluate differences among different groups; (b) hierarchical clustering tree of samples from different groups; (c) volcano plot displaying the relative content difference of metabolites in the CCl4 vs. CCl4+DCA group; (d) comparison of plasma BAs levels between CCl4 and CCl4+DCA groups; (e) volcano plot displaying the relative content differences of metabolites in the CCl4+DCA and CCl4+DCA+Abx groups; (f) comparison of plasma BAs levels between CCl4+DCA and CCl4+DCA+Abx groups. Ctrl: Control; CD: CCl4+DCA; CDA: CCl4+DCA+Abx. n = 6, *P<0.05, **P<0.01, ***P<0.001, ****P<0.0001. “ns” indicates no significant difference.
Figure 9.
Figure 9.
Liver transcriptome sequencing and qPCR analysis (a) cluster heatmap illustrating the gene expression in CCl4 and CCl4+DCA groups, with red indicating high-expression genes and blue indicating low-expression genes; (b) volcano plot displaying the relative content and statistical differences of genes in the CCl4 and CCl4+DCA groups; (c) gene function prediction based on the KEGG database; (d) GSEA analysis of IL-17 and TNF pathways; (e) real-time fluorescence quantitative PCR used to detect the expression of genes related to the IL-17 and TNF pathways.
Figure 10.
Figure 10.
Multi-omics analysis (a) correlation heatmap of differential gut microbiota and differential BAs metabolites at the genus and species levels between CCl4 and CCl4+DCA groups; (b) correlation analysis between differential BAs metabolites and differential genes of IL-17 and TNF inflammatory signaling pathway. (c) O2PLS analysis results for metabolome and transcriptome. Bar heights reflect correlation magnitude with respective omics, darker colors signifying stronger correlations; (d) correlation analysis of differentially expressed gut microbiota and BAs metabolites between CCl4 and CCl4+DCA groups, as well as differentially expressed genes involved in IL-17 and TNF inflammatory pathways. The width corresponds to Mantel’s r statistic, representing the correlation strength, and the color represents the statistical significance of Mantel analysis.

Similar articles

Cited by

References

    1. Czaja AJ. Hepatic inflammation and progressive liver fibrosis in chronic liver disease. World J Gastroenterol. 2014;20(10):2515–22. doi:10.3748/wjg.v20.i10.2515. - DOI - PMC - PubMed
    1. Cheng D, Chai J, Wang H, Fu L, Peng S, Ni X. Hepatic macrophages: key players in the development and progression of liver fibrosis. Liver Int. 2021;41(10):2279–2294. doi:10.1111/liv.14940. - DOI - PubMed
    1. Xiang J, Zhang Z, Xie H, Zhang C, Bai Y, Cao H, Che Q, Guo J, Su Z. Effect of different bile acids on the intestine through enterohepatic circulation based on FXR. Gut Microbes. 2021;13(1):1949095. doi:10.1080/19490976.2021.1949095. - DOI - PMC - PubMed
    1. Jia W, Wei M, Rajani C, Zheng X. Targeting the alternative bile acid synthetic pathway for metabolic diseases. Protein Cell. 2020;12(5):411–425. doi:10.1007/s13238-020-00804-9. - DOI - PMC - PubMed
    1. Cai J, Rimal B, Jiang C, Chiang JYL, Patterson AD. Bile acid metabolism and signaling, the microbiota, and metabolic disease. Pharmacology & Therapeutics. 2022;237:108238. doi:10.1016/j.pharmthera.2022.108238. - DOI - PubMed

Publication types

Grants and funding

The study is supported by grants from National Natural Science Foundation of China (Grant numbers 82172338, 82202596, 82372316).

LinkOut - more resources