. 2024 Feb 13:18:1315941.
doi: 10.3389/fncel.2024.1315941. eCollection 2024.

Role of a Pdlim5:PalmD complex in directing dendrite morphology

Affiliations

Role of a Pdlim5:PalmD complex in directing dendrite morphology

Yogesh Srivastava et al. Front Cell Neurosci. .

Abstract

Neuronal connectivity is regulated during normal brain development with the arrangement of spines and synapses being dependent on the morphology of dendrites. Further, in multiple neurodevelopmental and aging disorders, disruptions of dendrite formation or shaping is associated with atypical neuronal connectivity. We showed previously that Pdlim5 binds delta-catenin and promotes dendrite branching. We report here that Pdlim5 interacts with PalmD, a protein previously suggested by others to interact with the cytoskeleton (e.g., via adducin/spectrin) and to regulate membrane shaping. Functionally, the knockdown of PalmD or Pdlim5 in rat primary hippocampal neurons dramatically reduces branching and conversely, PalmD exogenous expression promotes dendrite branching as does Pdlim5. Further, we show that each proteins' effects are dependent on the presence of the other. In summary, using primary rat hippocampal neurons we reveal the contributions of a novel Pdlim5:PalmD protein complex, composed of functionally inter-dependent components responsible for shaping neuronal dendrites.

Keywords: catenin; cytoskeleton; dendrite; morphology; neuron; shape.


Conflict of interest statement

The authors declare that the research was conducted in the absence of any commercial or financial relationships that could be construed as a potential conflict of interest.

Figures

FIGURE 1
FIGURE 1
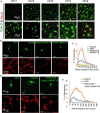
Pdlim5 is a modulator of dendritic branching. (A) The images depict rat hippocampal neurons at different developmental stages (DIV1, DIV3, DIV5, DIV7, and DIV9). The neurons are stained for endogenous Pdlim5 (shown in green), the NeuN marker (shown in red) and DAPI (shown in blue), a marker for neuronal nuclei. The results presented [images in panels (A,C) and Sholl analysis in panel (D)] are representative of 3 biological replicates. (B) A diagram illustrating the major subdomains of Pdlim5. The N-terminus contains a PDZ domain (amino acids 1 to 85, shown in orange), followed by a domain of unknown function (DUF, amino acids 212 to 305, shown in cyan), and at the C-terminus, three LIM domains (amino acids 413 to 591, shown in green). (C) Immunofluorescent images demonstrating the effects on neuronal morphology of expressing GFP (negative control), Pdlim5-GFP, or siRNA constructs that were co-transfected with GFP targeting the knockdown of Pdlim5. Transfections occurred at DIV3 with fixation at DIV5. The images reveal a loss of neuronal complexity in cells subjected to Pdlim5 siRNA-mediated knockdown (siRNA992, siRNA993), while exogenous expression of Pdlim5 increases branching. Respective Map2 staining images are shown below (red). Representative images of three biological replicates. While not shown, Myc-Pdlim5 produced effects similar to Pdlim5-GFP when exogenously expressed. (D) Sholl analysis of neurons under the conditions: negative control (GFP), Pdlim5-GFP expression, and Pdlim5 siRNA-mediated knock down. Sholl analysis scores the number of dendrites that intersect a series of evenly spaced concentric rings (generated digitally during data processing) that radiate out from the cell-body/soma. The analysis indicates that compared to GFP-expressing cells (blue line), neurons exogenously expressing Pdlim5-GFP (orange line) exhibited a significant increase in the number of dendrites. Conversely, knockdown of Pdlim5 using siRNA (siRNA992, gray line; siRNA993, yellow line) shows loss of neuronal processes. Data points are the average values (n ≥ 15 neurons) with error bars indicating standard error of the mean (SEM). The significance was assessed using a two-way ANOVA with Bonferroni post hoc analysis. Scale bars in the images represent 20 μm and 50 μm as indicated.
FIGURE 2
FIGURE 2
PalmD a novel partner of Pdlim5. (A) The image represents the colocalizations of Pdlim5 (shown in red), PalmD (shown in green) and DAPI (shown in blue) in rat hippocampal neurons at DIV4. Gross colocalization is indicated by the overlap color yellow in regions where both proteins are present within the same cellular compartment. Quantitation in Panel (B). (B) The mean Pearson’s coefficient was calculated to quantify the extent of colocalization between Pdlim5 and PalmD in neurites. The value 0.65 suggests significant (but not complete) linear correlation of Pdlim5 and PalmD colocalization within neurites. Three biological replicates were evaluated with similar outcomes (one shown), with data from ≥ 15 neurons each. Error bars indicate the standard error of the mean (SEM). Each dot in the graph represents one neuron. (C) Immunofluorescent image displays the results of a proximity ligation assay (PLA) of rat hippocampal neurons at DIV4, where the red-colored puncta indicate the positive reaction produced when antibodies to Pdlim5 and PalmD were employed. White arrows point to examples of positive (red) puncta while F-actin staining images shown side by side for Pdlim5 and PalmD (negative controls, green). Quantitation in Panel (D). (D) The quantification of PLA puncta per cell observed in processes is plotted. Antibodies employed against endogenous Pdlim5 or PalmD alone served as negative controls, while the established endogenous complex of Pdlim5:delta-Catenin served as positive control. The data was collected from ≥ 15 neurons, with each dot representing one neuron. Three biological replicates were evaluated with similar outcomes (one shown). The error bars represent the standard error of the mean (SEM), and the statistical significance, determined using one-way ANOVA, is indicated as P ≤ 0.0001 (****). ns, non significance. (E) The bar graphs compare the distribution of the Pdlim5 and PalmD proteins in different subcellular compartments, namely soma, neurites, and nucleus, in rat primary hippocampal neurons at two different developmental stages (DIV1 and DIV5). The relative fluorescence intensity for Pdlim5 and PalmD was quantified using ImageJ software. The data was obtained from 15 neurons, with each dot in the bar graph representing data from a single neuron. The error bars indicate the standard error of the mean (SEM). To determine the statistical significance, a one-way ANOVA analysis was performed using GraphPad Prism software. The levels of significance are indicated as **** for P ≤ 0.0001, n ≥ 15 neurons. Relative to the nucleus, this signifies high statistical significance of the observed subcellular localizations of both Pdlim5 and PalmD to neurites and soma in rat hippocampal neurons.
FIGURE 3
FIGURE 3
PalmD associates with Pdlim5. (A) Immunoblots displaying the endogenous pull-down of Pdlim5 followed by PalmD blotting. Since PalmD and Pdlim5 have similar sizes (approximately 70kD), separate gels were used for blotting of Pdlim5 versus PalmD. n = 3 biological replicates. (B) Quantitation by densitometric analysis (Image J software) of co-immunoprecipitations (co-Ips). n = 3 biological replicates of DIV9 rat primary cortical neurons. Each replicate utilized six 10 cm dishes containing 2 × 10⁶ cells each (see Methods). The error bars represent the standard error of the mean (SEM), and the statistical significance, determined using one-way ANOVA, is indicated as P ≤ 0.0001 (****). (C) Golgi co-relocalization assays demonstrates that Pdlim5 when fused to a Golgi localization sequence (GLS) exhibits an ectopic (red) distribution to the Golgi apparatus as expected. Importantly, PalmD (shown in green) colocalizes with GLS-Pdlim5 to the Golgi. In contrast, when Pdlim5 lacks the GLS, PalmD no longer co-relocalizes with Pdlim5 to the Golgi. n = 4 biological replicates, each with analysis of ≥8 cells, scale bar in the images represent 20 μm. HT-22 cells. (D) Calculation shows the Pearson’s correlation coefficient for the co-distribution of Pdlim5 and PalmD in the presence versus absence of the GLS-tag upon Pdlim5. The level of statistical significance is indicated as ****, which signifies a p-value of ≤0.0001. The violin plot quartiles represent data ranges and middle dark line represent median, and the statistical significance, determined using one-way ANOVA, is indicated as P ≤ 0.0001 (****).
FIGURE 4
FIGURE 4
PalmD characterization and its functional dependency with Pdlim5. (A) Rat primary hippocampal neurons at the indicated developmental stages (DIV1, DIV3, DIV5, DIV7, and DIV9), are immuno-stained for endogenous PalmD (shown in green), the NeuN marker (shown in red), which identifies neuronal nuclei, and DAPI (shown in blue), n = 3 biological replicates. The scale bars in the images indicate 20 μm and 50 μm. (B) These immunofluorescent images illustrate the impact of PalmD-GFP exogenous expression versus siRNA-mediated knockdown of PalmD (siRNA714, siRNA716) on neuronal morphology. Respective Map2 staining images are shown below (red) PalmD siRNA-mediated knockdown decreases process complexity, while exogenous expression increases branching morphology. Three biological replicates in each condition analyzing ≥ 15 neurons. Quantitation present in Panel (C). While not shown, flag-PalmD produced effects similar to PalmD-GFP when exogenously expressed. (C) Sholl analysis was conducted to examine the dendrite morphology of neurons under different conditions: namely negative control (GFP, blue line), PalmD-GFP exogenous expression (orange line), and PalmD siRNA-mediated knock down (siRNA714, green line; siRNA716, yellow line). The analysis demonstrates that neurons overexpressing PalmD-GFP exhibit a significant increase in dendritic complexity, while knockdown of PalmD results in severe reductions. The significance was assessed using a two-way ANOVA with Bonferroni post hoc analysis that varies from P ≤ 0.0001 and P < 0.05, based on radial distance from the cell soma (compared to cells expressing GFP alone). The error bars represent the standard error of the mean (SEM). n ≥ 15 neurons in each of three biological replicates. (D) Functional interdependence of Pdlim5 and PalmD. The panel indicates the GFP control (green) condition relative to Pdlim5-GFP exogenous expression (green), and versus Pdlim5-GFP exogenous expression (green) in the presence of PalmD siRNA-mediated knockdown (KD). Respective Map2 staining images are shown below (red). The results suggest an interdependence between Pdlim5 and PalmD in regulating neuronal morphology. Analyzed ≥ 15 neurons in each of three biological replicates. See panel (E) for quantitation. (E) Sholl analysis was performed to analyze dendrite morphology under different conditions: GFP control, Pdlim5-GFP exogenous expression, and Pdlim5-GFP exogenous expression with concomitant knock down of PalmD (siRNA716). The analysis reveals that neurons overexpressing Pdlim5-GFP (orange line) exhibit increased numbers of dendrites compared to control GFP-expressing cells (blue line) (P ≤ 0.0001 and P < 0.05 for the respective regions 20–90 μm and 110–170 μm from the soma). However, when PalmD siRNA716 is introduced alongside Pdlim5-GFP exogenous expression (gray line), there is a significant loss of branching function. The error bars represent the standard error of the mean (SEM). n ≥ 15 neurons each from three biological replicates. The significance was assessed using a two-way ANOVA with Bonferroni post hoc analysis.

Update of

Similar articles

Cited by

References

    1. Abu-Elneel K., Ochiishi T., Medina M., Remedi M., Gastaldi L., Caceres A., et al. (2008). A delta-catenin signaling pathway leading to dendritic protrusions. J. Biol. Chem. 283 32781–32791. 10.1074/jbc.M804688200 - DOI - PubMed
    1. Alam M. S. (2018). Proximity ligation assay (PLA). Curr. Protoc. Immunol. 123:e58. 10.1002/cpim.58 - DOI - PMC - PubMed
    1. Arstikaitis P., Gauthier-Campbell C., Carolina Gutierrez Herrera R., Huang K., Levinson J. N., Murphy T. H., et al. (2008). Paralemmin-1, a modulator of filopodia induction is required for spine maturation. Mol. Biol. Cell 19 2026–2038. 10.1091/mbc.e07-08-0802 - DOI - PMC - PubMed
    1. Baines A. J. (2010). The spectrin-ankyrin-4.1-adducin membrane skeleton: adapting eukaryotic cells to the demands of animal life. Protoplasma 244 99–131. 10.1007/s00709-010-0181-1 - DOI - PubMed
    1. Baumert R., Ji H., Paulucci-Holthauzen A., Wolfe A., Sagum C., Hodgson L., et al. (2020). Novel phospho-switch function of delta-catenin in dendrite development. J. Cell Biol. 219:e201909166. 10.1083/jcb.201909166 - DOI - PMC - PubMed

LinkOut - more resources