Review
. 2024 Jul;25(7):574-591.
doi: 10.1038/s41580-024-00710-6. Epub 2024 Feb 27.

Enhancer selectivity in space and time: from enhancer-promoter interactions to promoter activation

Affiliations
Review

Enhancer selectivity in space and time: from enhancer-promoter interactions to promoter activation

Jin H Yang et al. Nat Rev Mol Cell Biol. 2024 Jul.

Abstract

The primary regulators of metazoan gene expression are enhancers, originally functionally defined as DNA sequences that can activate transcription at promoters in an orientation-independent and distance-independent manner. Despite being crucial for gene regulation in animals, what mechanisms underlie enhancer selectivity for promoters, and more fundamentally, how enhancers interact with promoters and activate transcription, remain poorly understood. In this Review, we first discuss current models of enhancer-promoter interactions in space and time and how enhancers affect transcription activation. Next, we discuss different mechanisms that mediate enhancer selectivity, including repression, biochemical compatibility and regulation of 3D genome structure. Through 3D polymer simulations, we illustrate how the ability of 3D genome folding mechanisms to mediate enhancer selectivity strongly varies for different enhancer-promoter interaction mechanisms. Finally, we discuss how recent technical advances may provide new insights into mechanisms of enhancer-promoter interactions and how technical biases in methods such as Hi-C and Micro-C and imaging techniques may affect their interpretation.


Conflict of interest statement

Competing interests

The authors declare no competing interests.

Figures

Figure 1.
Figure 1.. Models of enhancer–promoter interactions.
(a) 1D models of enhancer–promoter (E–P) interactions. RNA polymerase II (Pol II) or chromatin remodellers loaded at the enhancer can track along the chromatin to reach the cognate promoter (top); alternatively, protein scaffolds can connect cognate E–P pair as a molecular bridge (bottom). (b) Promoter skipping. A promoter further away from an enhancer along the linear genome can be in spatial proximity with the enhancer to a higher extent and/or more frequently than a promoter closer to the enhancer on the linear genome. (c) 3D models of E–P interactions. Along the interaction radius axis, 3D E–P interaction models can be divided into contact type and action-at-a-distance type; along the interaction duration axis, 3D E–P interaction models are classified into dynamic and stable categories.
Figure 2.
Figure 2.. Models of transcription activation by enhancers.
(a) Transcription activation through direct transfer of enhancer-recruited proteins to the promoter. PIC. Pol II preinitiation complex. (b) Transcription activation by enhancer-mediated recruitment of proteins to the promoter. (c) Transcription activation by enhancer-mediated enrichment of proteins around the promoter leading to preinitiation complex (PIC) formation (d) Transcription activation by enhancer-mediated protein post-translational modifications (PTMs) at promoters. The example illustrated here shows the phosphorylation (P) of RNA polymerase II (Pol II)’ by Mediator. For brevity and clarity, the figure only illustrates Pol II-mediated transcription activationdial; examples of other proteins are discussed in the main text.
Figure 3.
Figure 3.. Models of enhancer selectivity.
(a) Enhancer selectivity mediated by promoter repression. If a promoter is sufficiently strongly repressed, it may be insensitive to E–P interactions. Epigenetic modifications such as histone H3 Lys9 trimethylation (H3K9me3) are associated with loss of chromatin accessibility. By contrast, incorporation of the histone variant H2A.Z leads to gain of chromatin accessibility (left). Promoters can be repressed also by binding of co-repressors complexes, such as Polycomb repressive complexes (PRC) (right). (b) Enhancer selectivity mediated by biochemical compatibility. If distinct classes of enhancers and promoters exist such that enhancers can only activate promoters of the same class, this could also explain enhancer selectivity. (c) According to the domain model, enhancer–promoter (E–P) interactions take place within, but not across topologically associating domain (TAD) boundaries. The fully looped state is achieved when one or more cohesins bridge together the CTCF loop anchors thus forming a loop domain often assumed to be very stable. (d) According to the individual insulator model, it is the ability of a CTCF insulator to block loop extrusion that reduces E–P interactions across the CTCF boundary independently of domain formation. In a hypothetical genome with a single CTCF site placed between an E–P pair, no domain could be formed but insulation can still be explained. (e) The facilitator role of CTCF promotes 3D E–P proximity and thus enhancer selectivity. The models presented in parts (a) and (b) function at the transcription activation level, whereas those presented in parts (c–e) function at the E–P interaction level.
Figure 4.
Figure 4.. Interpreting the results of conformation capture assays.
(a) In chromosome conformation capture (3C) assays, enhancer–promoter (E–P) pairs whose 3D distance is smaller than the capture radius are ligated and counted as a “contact”. E–P pairs whose 3D distance is larger than the capture radius are not ligated and considered not “in contact”. (b) Different capture radii in conformation capture assays could lead to significantly different apparent “contact probability”. Comparing a cognate E–P pair with a non-cognate E–P pair, the fold change in “contact probability” could appear a lot smaller with a larger capture radius. (c) Capture radii larger than the true E–P interaction radius would lead to the “contact probability” overestimating the true interaction probability. (d) Capture radii smaller than the true E– P interaction radius would miss E–P interactions.
Figure 5.
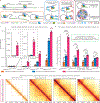
Figure 5.. Enhancer selectivity mediated by 3D genome organization as a function of interaction radius.
(a) Setup of 3D polymer simulation of seven enhancer–promoter (E–P) pairs. Each pair has a 400 kb E–P distance, and two adjacent pairs are 10 Mb apart. Three conditions were simulated: diffusion only (orange), loop extrusion without proximal CTCF sites (blue), and loop extrusion with proximal, facilitator CTCF binding (pink, with a 50% CTCF occupancy for each CTCF binding site,,). The simulation parameters for loop extrusion were inferred from live-cell imaging and Micro-C data. The 3D distances are monitored for each E–P pair, and when the distance is smaller than the interaction radius, the E–P pair is considered interacting. For the simulation details, see Supplementary Box 1. (b) Interaction radii for contact type E–P interactions vs action-at-a-distance type (e.g. through condensates) E–P interactions differ by roughly an order of magnitude. (c) Interaction probability depends strongly on the interaction radius. There is a differential dependency of interaction probability on the interaction radius for the three simulated conditions. (d) Fold increase in interaction probabilities normalized to the diffusion-only condition. The numbers on the arcs show the fold increase in interaction probability between the indicated conditions. (c,d) The error bars of the bar plot represent the standard error of the mean, and n = 7 E–P pairs. (e) Simulated “contact probability” maps with the indicated capture radius, calculated from 3D polymer conformations of all seven E–P pairs and the surrounding region in the simulation that includes loop extrusion with proximal CTCF binding. An iterative correction was applied to each “contact probability” map, and the color bar was adjusted individually to optimize the display contrast of each map.
Figure 6.
Figure 6.. Examples of enhancer–promoter pairs with different CTCF binding patterns.
(a) Examples of enhancer–promoter (E–P) pairs with proximal CTCF binding on both the enhancer and the promoter sides,. (b) Examples of E–P pairs with proximal CTCF binding only at the promoter side,,. MYC-ECSE: MYC endometrial carcinoma super-enhancer. (c) Examples of E–P pairs with no proximal CTCF binding on either side.
Figure 7.
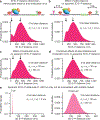
Figure 7.. Interpreting imaging studies of enhancer–promoter interactions.
(a) Simulation of imaging-measured distribution of 3D enhancer–promoter (E–P) distances without label–element (enhancer, promoter) distance and localization error. The bimodality of 3D E–P distances arises due to loop extrusion stalled by facilitator CTCF, bringing E–P pairs into proximity. (b) Label–element distance can obscure the bimodality of the 3D E–P distance distribution. (c) Localization error could similarly weaken the bimodality of the 3D E–P distance distribution. (d) Increased label distance and localization error combined could make the bimodality of 3D E–P distance disappear. (e) With increased label distance and localization error, true E–P distances smaller than 27 nm could correspond to measured E–P distances of ~100–200 nm. The simulation parameters for loop extrusion were inferred from live-cell imaging and Micro-C data, and a CTCF occupancy of 100% was used to better illustrate the change in the bimodality of distance distributions, such that the enhancer and the promoter are in direct contact ~3% of the time when assuming an interaction radius of 54 nm. For the simulation details, see Supplementary Box 1.

Similar articles

Cited by

References

    1. Bentovim L, Harden TT & DePace AH Transcriptional precision and accuracy in development: from measurements to models and mechanisms. Development 144, 3855–3866 (2017). - PMC - PubMed
    1. Ong C-T & Corces VG Enhancer function: new insights into the regulation of tissue-specific gene expression. Nat. Rev. Genet. 12, 283–293 (2011). - PMC - PubMed
    1. Field A & Adelman K Evaluating enhancer function and transcription. Annu. Rev. Biochem. 89, 213–234 (2020). - PubMed
    1. Zabidi MA & Stark A Regulatory enhancer–core-promoter communication via transcription factors and cofactors. Trends Genet. 32, 801–814 (2016). - PMC - PubMed
    1. Andersson R et al. An atlas of active enhancers across human cell types and tissues. Nature 507, 455–461 (2014). - PMC - PubMed

MeSH terms

LinkOut - more resources