. 2024 Feb 27;81(1):101.
doi: 10.1007/s00018-023-05091-1.

BOP1 contributes to the activation of autophagy in polycystic ovary syndrome via nucleolar stress response

Affiliations

BOP1 contributes to the activation of autophagy in polycystic ovary syndrome via nucleolar stress response

Rui Ji et al. Cell Mol Life Sci. .

Abstract

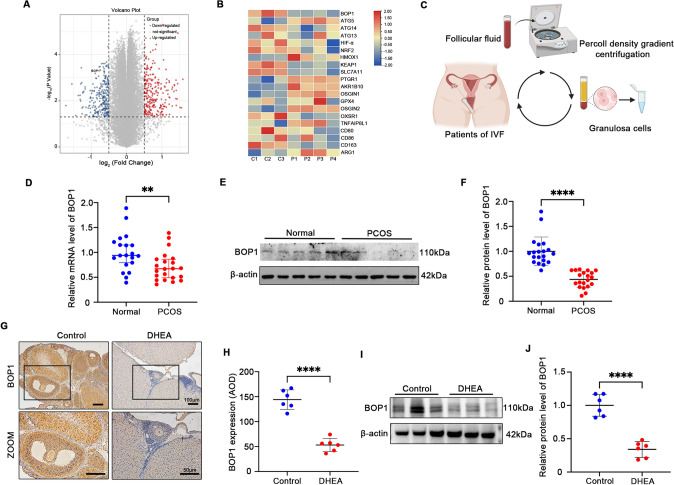
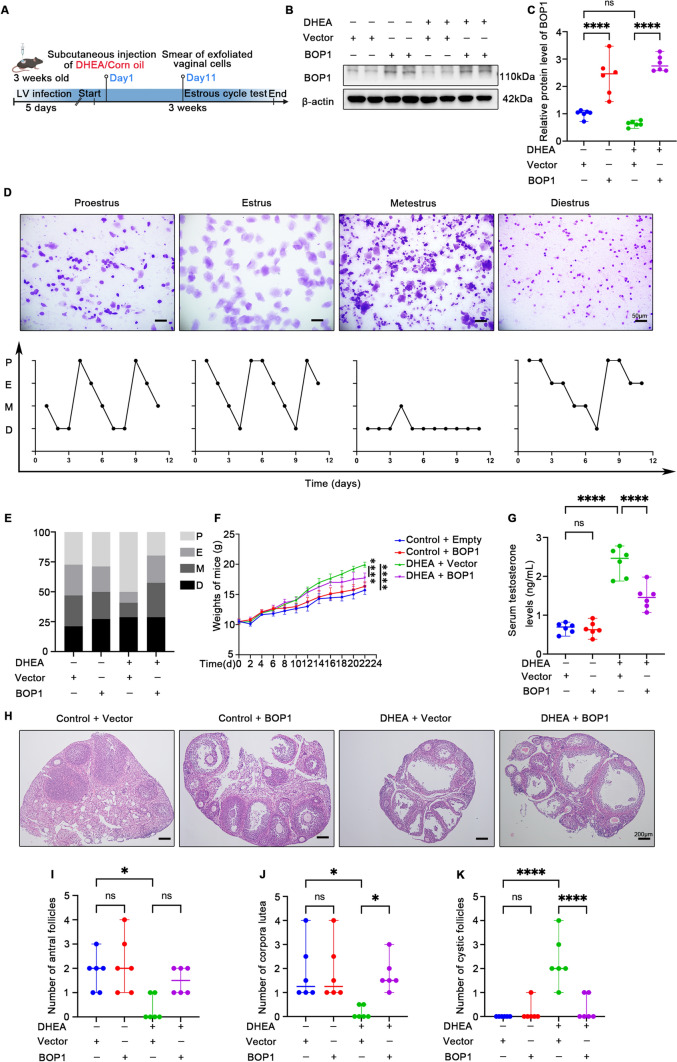
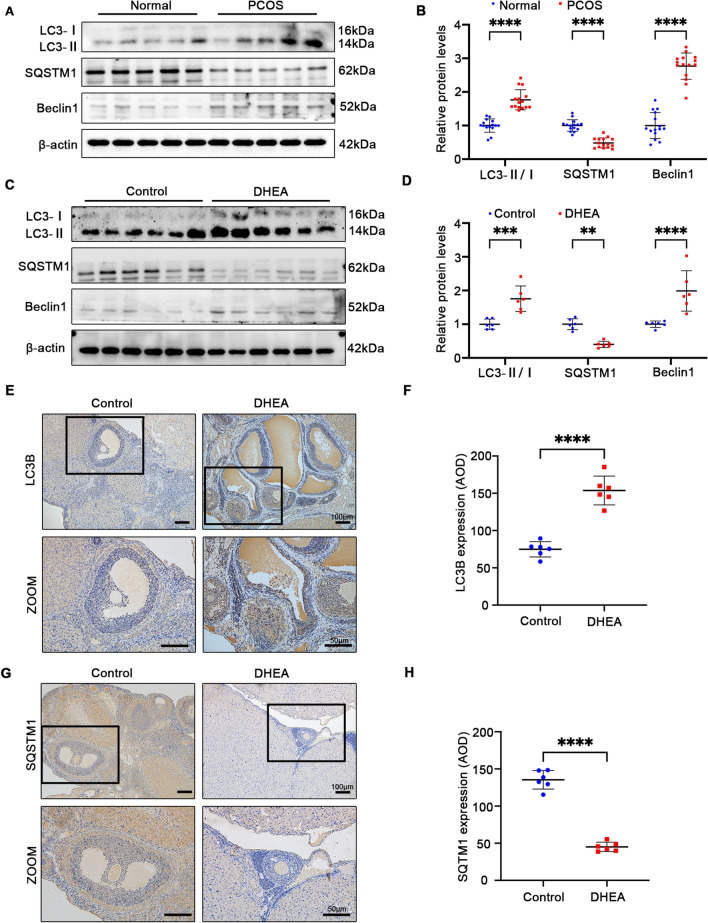
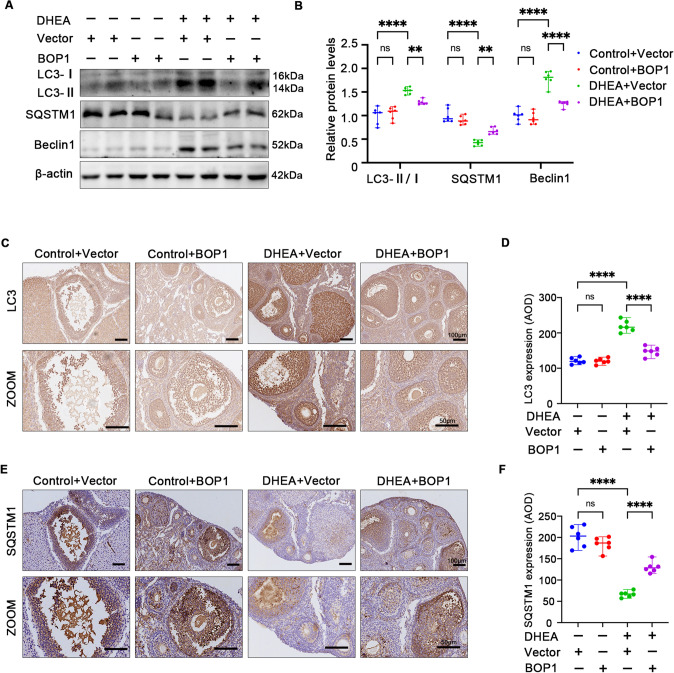
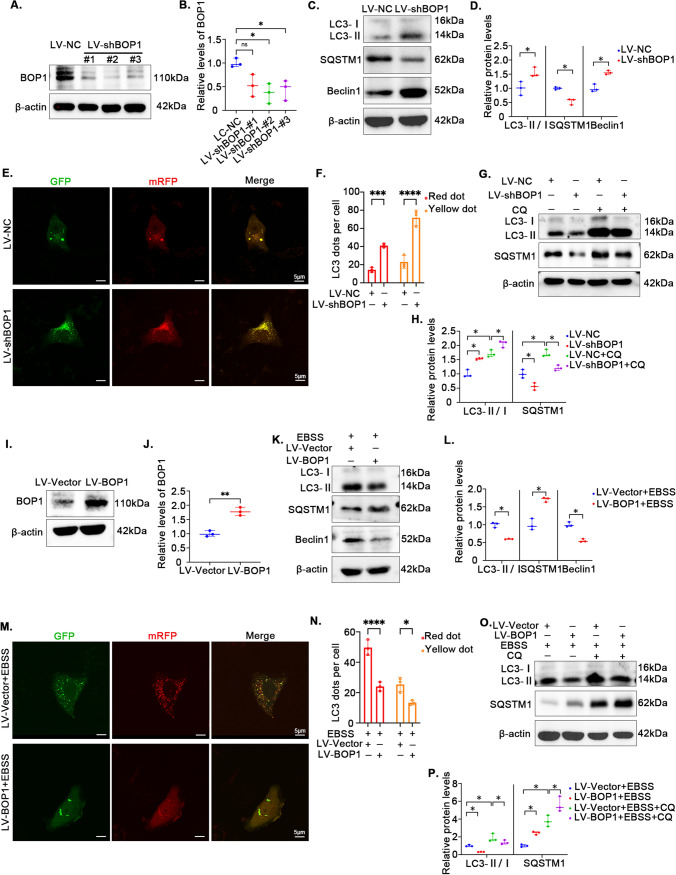
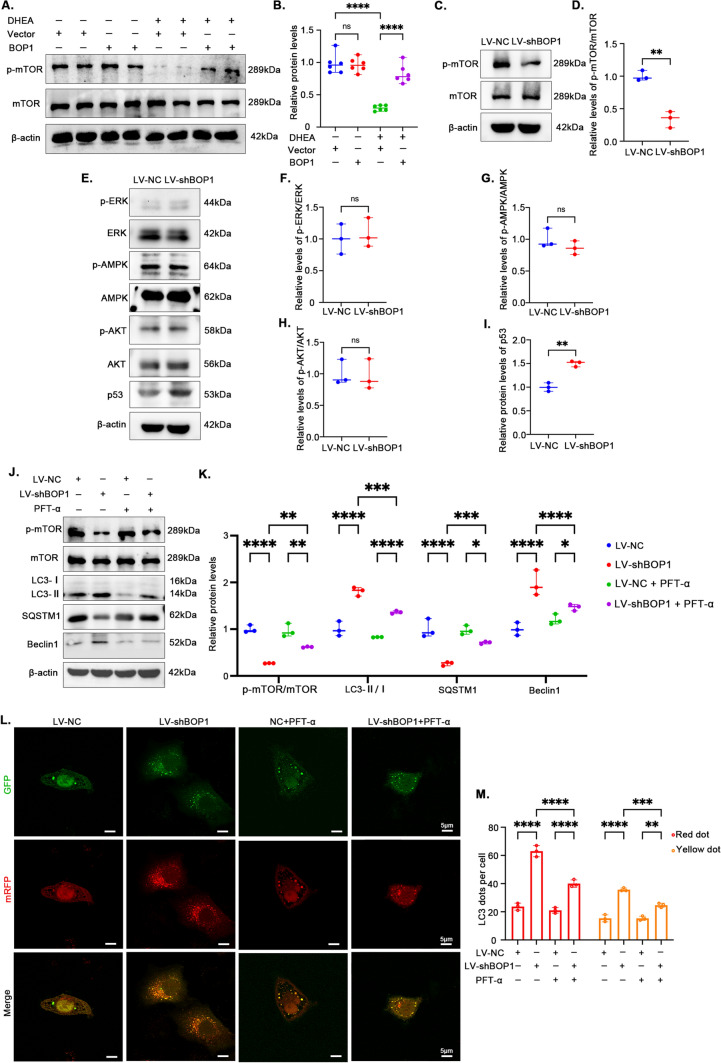
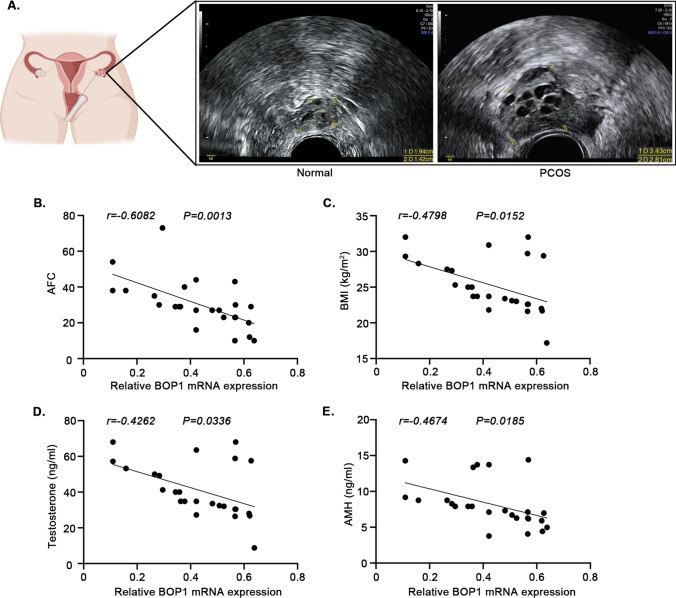
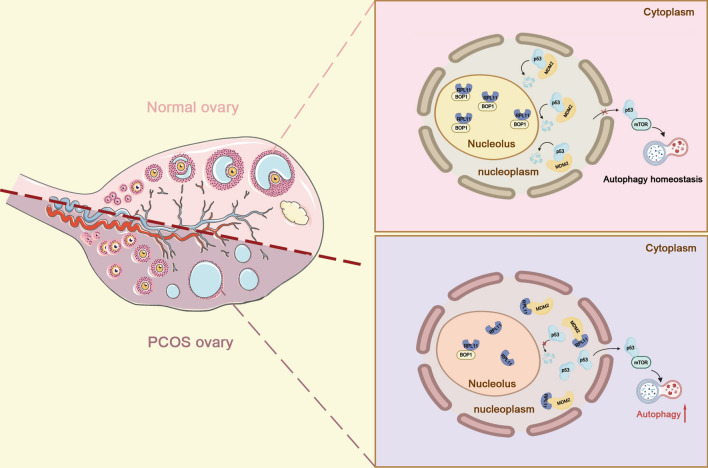
Abnormal autophagy is one of the vital features in polycystic ovary syndrome (PCOS). However, the underlying molecular mechanisms remain unelucidated. In this study, we aimed to investigate whether Block of Proliferation 1 (BOP1) is involved in the onset of autophagy activation of granulosa cells in PCOS. Firstly, we found that BOP1 expression was significantly down-regulated in the ovaries of PCOS mice, which was associated with the development of PCOS. Next, local injection of lentiviral vectors in the ovary for the overexpression of BOP1 significantly alleviated the phenotypes of elevated androgens, disturbed estrous cycle, and abnormal follicular development in PCOS mice. Subsequently, we found that knockdown of BOP1 activated autophagy of granulosa cells in the in vitro experiments, whereas overexpression of BOP1 inhibited autophagy in both in vivo and in vitro models. Mechanistically, BOP1 knockdown triggered the nucleolus stress response, which caused RPL11 to be released from the nucleolus into the nucleoplasm and inhibited the E3 ubiquitination ligase of MDM2, thereby enhancing the stability of p53. Subsequently, P53 inhibited mTOR, thereby activating autophagy in granulosa cells. In addition, the mRNA level of BOP1 was negatively correlated with antral follicle count (AFC), body-mass index (BMI), serum androgen levels, and anti-Mullerian hormone (AMH) in patients with PCOS. In summary, our study demonstrates that BOP1 downregulation inhibits mTOR phosphorylation through activation of the p53-dependent nucleolus stress response, which subsequently contributes to aberrant autophagy in granulosa cells, revealing that BOP1 may be a key target for probing the mechanisms of PCOS.

Keywords: Autophagy; Block of proliferation 1 (BOP1); Nucleolus stress; Polycystic ovary syndrome (PCOS).


Conflict of interest statement

The authors declare no competing interests.

Figures

Fig. 1
Fig. 1
BOP1 is downregulated in PCOS patients and animal models. A Volcano plot of gene expression changes in the PCOS ovaries (n = 4) versus control (n = 3). B Heatmap of autophagy related genes, oxidative stress molecules and inflammatory cytokine expression in the DEGs. C Diagram of human granulosa cell extraction process. D Quantification of the mRNA level of BOP1 in PCOS patients and healthy control women (n = 20). E, F Quantification of the protein level of BOP1 in PCOS patients and healthy control women (n = 20). G, H. Immunohistochemical analysis of BOP1 expression in PCOS Rats with controls (n = 6) I, J. Western blot and densitometric analysis for the expression of BOP1 in DHEA-treated rats and controls. (n = 6). Data are presented as mean ± SD. Student’s t test. **p < 0.01; ****p < 0.0001; ns not significant
Fig. 2
Fig. 2
BOP1 overexpression ameliorates abnormal phenotype in PCOS mice. A Pattern of PCOS modeling after local infection of mouse ovaries using BOP1 overexpression lentivirus or vector lentivirus. B, C Western blot and densitometric analysis for the expression of BOP1 in lentivirus-infected PCOS mice and controls (n = 6). D, E Assessment of the estrous cycle in mice (n = 6). P proestrus, E Estrus, M metestrus, D diestrus. F. Body weight measurements in mice (n = 6). G Detection of serum testosterone level in mice (n = 6). H Representative H&E staining images of ovarian morphology in the four groups of mice. IK. Number of each follicle in four groups of mice was shown (n = 6). Data are presented as mean ± SD. one-way ANOVA. *p < 0.05; ****p < 0.0001; ns not significant
Fig. 3
Fig. 3
Autophagy is activated in PCOS patients and rats. A, B Western blot and densitometric analysis for the expression of LC3B, SQSTM1, Beclin1 in PCOS patients and normal group (n = 15). C D. Western blot and densitometric analysis for the expression of LC3B, SQSTM1, Beclin1 in DHEA-treated rats and controls (n = 6). E, F. Immunohistochemical analysis of LC3B expression in PCOS Rats with controls (n = 6). G, H Immunohistochemical analysis of SQSTM1 expression in PCOS Rats with controls (n = 6). Data are presented as mean ± SD. Student’s t-test. **p < 0.01; ***p < 0.001; ****p < 0.0001; ns not significant. Data are presented as mean ± SD. one-way ANOVA. *p < 0.05; ****p < 0.0001; ns not significant
Fig. 4
Fig. 4
BOP1 overexpression partially alleviated autophagy in PCOS mice. A, B Western blot and densitometric analysis for the expression of LC3B, SQSTM1, Beclin1 in ovaries of mice in the four groups (n = 6). C, D Immunohistochemical analysis of LC3B expression in the four groups (n = 6). E, F Immunohistochemical analysis of SQSTM1 expression in the four groups (n = 6). Data are presented as mean ± SD. one-way ANOVA. **p < 0.01; ****p < 0.0001; ns not significant
Fig. 5
Fig. 5
Downregulation of BOP1 activates autophagy in KGN. A, B Representative western blotting bands and the relative expression levels of BOP1 in KGN cells infected with LV-NC or LV-shBOP1. n = 3 for each group. *p < 0.05, significantly different from LV-NC, Student’s t test. C, D Western blot and densitometric analysis for the expression of LC3B, SQSTM1, Beclin1 in KGN cells (n = 3). E, F KGN cells were transfected with mRFP-GFP-LC3 recombinant adenovirus for detection of autophagy flux. Representative images of autophagosomes (yellow spots) and autolysosomes (red spots). Student’s t test. G, H. KGN cells were treated with 10 μM CQ or DMSO for 4 h. Representative western blotting bands and the relative expression levels of LC3B and SQSTM1 were detected. (n = 3). one-way ANOVA. I, J Representative western blotting bands and the relative expression levels of BOP1 in KGN cells infected with LV-Vector or LV-BOP1. n = 3 for each group. Student’s t test. K, L. KGN cells were subjected to starvation for the using EBSS for 4 h. Quantification of the protein level of LC3B, SQSTM1 and Beclin1 were detected. (n = 3). Student’s t test. M, N Autophagic flux was assessed by quantification of autophagosomes (yellow spots) and autolysosomes (red spots) colocalization using the Image J software. Student’s t test. O, P KGN cells were treated with 10 μM CQ or DMSO for 4 h. Representative western blotting bands and the relative expression levels of LC3B and SQSTM1 were detected. (n = 3). one-way ANOVA. *p < 0.05; **p < 0.01; ***p < 0.001; ****p < 0.0001. ns not significant. The P value calculated by multiple comparison and one-way ANOVA test was corrected
Fig. 6
Fig. 6
BOP1 regulates autophagy via p53/mTOR pathway. A, B Western blot and densitometric analysis for the expression of p-mTOR in the four groups (n = 3). one-way ANOVA. C, D Representative western blotting bands and the relative expression levels of p-mTOR in KGN cells infected with LV-NC or LV-shBOP1 (n = 3). Student’s t test. EI Western blot and densitometric analysis for the expression of p-ERK, p-AMPK, p-AKT and p53 in KGN cells infected with LV-NC or LV-shBOP1 (n = 3). Student’s t test. J, K KGN cells were treated with 10 μM PFT-α or equal DMSO for 12 h, and protein levels of p-mTOR, LC3B, SQSTM1 and Beclin1 were detected with Western blot. one-way ANOVA. L, M Autophagic flux was assessed by quantification of autophagosomes (yellow spots) and autolysosomes (red spots) colocalization using the Image J software. one-way ANOVA. *p < 0.05; **p < 0.01; ***p < 0.001; ****p < 0.0001. ns not significant
Fig. 7
Fig. 7
BOP1 downregulation enhances p53 stability through nucleolus stress response. A Quantification of the mRNA level of p53 in KGN cells infected with LV-NC and LV-shBOP1 (n = 3). Student’s t test. B, C KGN cells were transfected with LV-NC or LV-shBOP1 and administrated with CHX at different time for detecting the p53 degeneration rate by western blot (n = 3). D, E Western blot and densitometric analysis for the expression of RPL11 and MDM2 in KGN cells (n = 3). Student’s t test. F, G Western blot and densitometric analysis for the expression of RPL11 in the Nucleolus and nucleoplasm of KGN cells. Lamin B, and NPM are used as the nucleoplasm and Nucleolus markers (n = 3). H Effects of BOP1 knockdown on the MDM2-mediated p53 ubiquitination in KGN cells (n = 3). I Interaction between RPL11 and MDM2 in KGN cells determined by coimmunoprecipitation analysis using rabbit IgG or anti-RPL11 antibodies (n = 3). J Interaction between RPL11 and MDM2 in KGN cells determined by coimmunoprecipitation analysis using rabbit IgG or anti-MDM2 antibodies (n = 3). K Confocal microscopy was used to detect the location of RPL11 (Red) and MDM2 (Green) in KGN cells (n = 3). L Representative images of the docking mode of BOP1 binding to RPL11. M Interaction between BOP1 and RPL11 in KGN cells determined by coimmunoprecipitation analysis using rabbit IgG or anti-BOP1 antibodies (n = 3). N Interaction between BOP1 and RPL11 in KGN cells determined by coimmunoprecipitation analysis using rabbit IgG or anti-RPL11 antibodies. OQ. Western blot and densitometric analysis for the expression of RPL11, MDM2, p53, p-mTOR, LC3B, SQSTM1, Beclin1 (n = 3). one-way ANOVA. R, S. Autophagic flux was assessed by quantification of autophagosomes (yellow spots) and autolysosomes (red spots) colocalization using the Image J software (n = 3). one-way ANOVA. *p < 0.05; **p < 0.01; ***p < 0.001; ****p < 0.0001. ns not significant
Fig. 8
Fig. 8
Correlation between BOP1 and the development of PCOS. A Transvaginal ultrasound in patients with PCOS and healthy control women. BE Association of BOP1 expression with AFC, BMI, Testosterone, and AMH
Fig. 9
Fig. 9
Graphics summarizes the mechanism of BOP1 knockdown in regulation of autophagy in PCOS. BOP1 knockdown enhanced the binding of RPL11 and MDM2, hence causing p53 activation. Therefore, p53 inhibited the phosphorylation of mTOR, thereby activating autophagy in GCs. BOP1 Block of proliferation, PCOS polycystic ovary syndrome, GC granulosa cell, RPL11 ribosomal protein L11, MDM2 murine double minute 2, mTOR mammalian target of rapamycin

Similar articles

References

    1. Joham AE, Norman RJ, Stener-Victorin E, Legro RS, Franks S, Moran LJ, Boyle J, Teede HJ. Polycystic ovary syndrome. Lancet Diabetes Endocrinol. 2022;10:668–680. doi: 10.1016/S2213-8587(22)00163-2. - DOI - PubMed
    1. Diamanti-Kandarakis E, Dunaif A. Insulin resistance and the polycystic ovary syndrome revisited: an update on mechanisms and implications. Endocr Rev. 2012;33:981–1030. doi: 10.1210/er.2011-1034. - DOI - PMC - PubMed
    1. Glueck CJ, Goldenberg N. Characteristics of obesity in polycystic ovary syndrome: etiology, treatment, and genetics. Metabolism. 2019;92:108–120. doi: 10.1016/j.metabol.2018.11.002. - DOI - PubMed
    1. Yalameha B, Nejabati HR, Nouri M. Circulating microparticles as indicators of cardiometabolic risk in PCOS. Clin Chim Acta. 2022;533:63–70. doi: 10.1016/j.cca.2022.06.019. - DOI - PubMed
    1. Griffey CJ, Yamamoto A. Macroautophagy in CNS health and disease. Nat Rev Neurosci. 2022;23:411–427. doi: 10.1038/s41583-022-00588-3. - DOI - PMC - PubMed

MeSH terms