[Preprint]. 2024 Feb 16:2024.02.16.580629.
doi: 10.1101/2024.02.16.580629.

Diverse Fgfr1 signaling pathways and endocytic trafficking regulate early mesoderm development

Affiliations

Diverse Fgfr1 signaling pathways and endocytic trafficking regulate early mesoderm development

James F Clark et al. bioRxiv. .

Update in

Abstract

The Fibroblast growth factor (FGF) pathway is a conserved signaling pathway required for embryonic development. Activated FGF receptor 1 (FGFR1) drives multiple intracellular signaling cascade pathways, including ERK/MAPK and PI3K/AKT, collectively termed canonical signaling. However, unlike Fgfr1 null embryos, embryos containing hypomorphic mutations in Fgfr1 lacking the ability to activate canonical downstream signals are still able to develop to birth, but exhibit severe defects in all mesodermal-derived tissues. The introduction of an additional signaling mutation further reduces the activity of Fgfr1, leading to earlier lethality, reduced somitogenesis, and more severe changes in transcriptional outputs. Genes involved in migration, ECM-interaction, and phosphoinositol signaling were significantly downregulated, proteomic analysis identified changes in interactions with endocytic pathway components, and cells expressing mutant receptors show changes in endocytic trafficking. Together, we identify processes regulating early mesoderm development by mechanisms involving both canonical and non-canonical Fgfr1 pathways, including direct interaction with cell adhesion components and endocytic regulation.

Keywords: FGF; cell adhesion; cell signaling; endocytic trafficking; kidney development; mesoderm development.


Figures
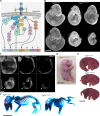
Figure 1.
Figure 1.. A portion of homozygous Fgfr1FCPG mutant mice survive perinatally while exhibiting severe axial truncation.
A) Activated FGFRs engage multiple downstream intracellular signaling pathways through the recruitment of various effector proteins to its intracellular domain. B) DAPI staining of E10.5 embryos. Fgfr1FCPG/FCPG mutants display reduced size and craniofacial, somite, and neural tube defects, as previously reported. However, variance in the severity of the phenotypes ranges between individuals. Scale bar represents 1mm. C) At E10.5, Fgfr1FCPG/FCPG embryos display disrupted somite patterning and early truncation based on Meox1 expression. The neural tube is formed, as highlighted with Sox2 expression, but does not close in all mutant embryos. Scale bar represents 50μm. D) Fgfr1FCPG/FCPG P0 pups display several phenotypes including axial truncation, spina bifida, hindlimb malformation, and lack a tail. Scale bar represents 5mm. E) Fgfr1FCPG/FCPG embryos collected at E14.5 exhibit spina bifida, hindlimb malformation, body wall closure defects, and axial truncation. Scale bar represents 2mm. F) Skeletal staining of E14.5 wild type and homozygous Fgfr1FCPG embryos. Mutant embryos exhibit multiple severe skeletal defects including vertebral truncation, rib fusions, abnormal digit patterning, pelvic bone agenesis, and reduced ossification. Scale bar represents 2mm.
Figure 2.
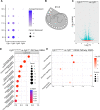
Figure 2.. RNA-seq analysis of Fgfr1FCPG tailbud tissue reveals downregulation of genes involved mesodermal patterning, Wnt signaling, and cell adhesion.
A) Analysis of a whole-embryo scRNA-seq organogenesis dataset (Cao et al., 2019; Pijuan-Sala et al., 2019) reveals high expression of both Fgfr1 and Fgfr2 from E9.5 to E11.5. B) Bulk RNA-seq analysis was performed using tailbud tissue dissected from E9.5, E10.5, and E11.5 embryos. Tailbud tissue was cut at the posterior-most definitive somite boundary (dashed lines). C) Volcano plots displaying differential gene expression between Fgfr1FCPG/FCPG mutants and wild type at E10.5. Horizontal dashed line signifies significance cut-off of p=0.05. D) GO Term GSEA of down-regulated genes in Fgfr1FCPG/FCPG tailbuds at E10.5. The most significant terms involve skeletal morphogenesis, anterior-posterior patterning, and regionalization. E) KEGG Pathway GSEA of down-regulated genes in Fgfr1FCPG/FCPG tailbuds at E10.5. Mutants exhibit changes in ECM-receptor interaction and focal adhesion genes as well as multiple signaling pathways including Wnt and JAK-STAT.
Figure 3.
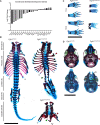
Figure 3.. Fgfr1FCPG allele reveals extensive skeletal morphology and ossification defects up to perinatal development.
A) RNA-seq of Fgfr1FCPG embryos indicates a large downregulation of genes involved in somite and skeletal development compared to wild type. Key genes, such as multiple Hox genes and Meox1, are downregulated while certain extracellular matrix genes are slightly upregulated. B) A wild-type P0 spinal column with vertebral groupings labeled. Homozygous Fgfr1FCPG embryos exhibit a range of axial truncation severity, as depicted by two P0 spinal columns (right). Red arrows denote examples of rib fusions, green arrows depict regions of spina bifida, and white arrow depicts complete lack of sacral vertebrae and pelvic bones. Scale bar represents 5mm. C) Digit patterning defects are seen in both the fore and hind paws, as well as delayed ossification of the digits. Fusion of paws was observed rarely (n = 1/14). Scale bar represents 5mm. D) Craniofacial skeletal defects include reduced ossification throughout the cranial vault, loss of the occipital bone (red arrow), and cleft palate (green arrow) (n = 13/14) or face (white arrow) (n = 1/14). Scale bar represents 5mm.
Figure 4.
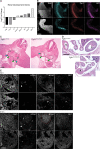
Figure 4.. Fgfr1FCPG mutant embryos exhibit delayed intermediate mesoderm development resulting in kidney agenesis.
A) RNA-seq analysis of Fgfr1FCPG/FCPG embryos shows an alteration in expression of renal development genes, including Pax2 and Ret, compared to heterozygotes. B) The expression domain of key intermediate mesoderm markers, Pax2, Osr1, and Wt1, is altered and overall expression levels are reduced in Fgfr1FCPG/FCPG embryos, compared to controls, at E9.5. Scale bar represents 200μm. C) At E11.5, Fgfr1FCPG/FCPG embryos lack a ureteric bud and the mesonephric mesenchyme does not appear to be condensing, a key process for the early formation of the kidney. Dashed lines encompass the developing intermediate mesoderm. White arrows indicate ureteric buds, blue arrows indicate nephrogenic duct, and yellow areas indicate urogenital ridge. Scale bar represents 10μm. D) At E14.5, Fgfr1FCPG/FCPG embryos lack a recognizable kidney. Wild-type embryos exhibit a distinctive kidney (K) proximal to the caudal body wall below the liver (L). The bladder (B) and intestine (I) are also labeled. Scale bar represents 500μm. E) Coordination of Cadherin localization is disrupted in Fgfr1FCPG/FCPG embryos, at both E9.5 and E10.5, during early mesonephric mesenchyme condensation and ureteric bud formation. ECAD is greatly reduced in the mutants, while NCAD is more broadly localized to the gonadal ridge rather than restricted to the condensing mesonephric mesenchyme. Localization of RET, a key driver of early kidney development, appears to be unaffected in homozygous Fgfr1FCPG mutants, although expression is slightly higher as also seen in the RNA-seq. White arrows indicate the nephrogenic duct. Dashed red line encompasses the condensing mesonephric mesenchyme. Scale bar represents 50μm.
Figure 5.
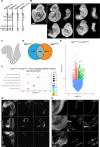
Figure 5.. RNA-seq analysis of Fgfr1FCPG and Fgfr1FCSPG E8.5 tailbud tissue reveals downregulation of genes involved in ECM interaction and PIP signaling pathways.
A) Schematic of signaling mutant alleles constructed in Fgfr1 gene. The most severe allele, Fgfr1FCSPGMyc, has an additional mutation at Y730, a potential binding site for SFKs and/or p85, in addition to the FCPG mutations that disrupt downstream canonical signaling. B) Both Fgfr1FCPG/FCPG and Fgfr1FCSPG/FCSPG embryos show severe defects at E10.5 Phenotypes are variable, but most Fgfr1FCPG/FCPG embryos fail between E9.5 and E10.5, while all Fgfr1FCSPG/FCSPG fail at or before E9.5. Phenotypes include axial truncations, neural tube closure defects, somitogenesis defects, and cardiac defects. Scale bar represents 1mm. C) Tailbud tissue was dissected from wild-type and homozygous Fgfr1FCPG and Fgfr1FCSPG embryos at E8.5 to examine the onset of the observed phenotypic changes. Allantois tissue was removed from the tailbud tissue (dashed lines). D) Venn diagram depicting significant differentially expressed genes in homozygous Fgfr1FCPG or Fgfr1FCSPG mutant tailbud tissue compared to wild-type tissue at E8.5. E) Volcano plots displaying differential gene expression between Fgfr1FCPG/FCPG mutants and wild type, Fgfr1FCSPG/FCSPG mutants and wild type, and Fgfr1FCSPG/FCSPG mutants and Fgfr1FCPG/FCPG mutants, respectively, at E8.5. Horizontal dashed line signifies significance cut-off of p=0.05. F) KEGG Pathway GSEA of genes downregulated in Fgfr1FCSPG tissue compared to Fgfr1FCPG tissue. The most significantly downregulated BP terms revolve around tissue migration, indicating that S mutation may differentially affect Fgfr1’s role in cell migration. Additionally, KEGG Pathway GSEA identified ECM-receptor interaction, inositol signaling, and pathways related to calcium regulation. G) At E8.5, Fgfr1FCSPG/FCSPG embryos display a significant reduction in somitogenesis as seen by Meox1 and Hes7 expression. In contrast, Fgfr1FCPG/FCPG exhibits normal somitogenesis at this stage. Scale bar represents 200μm. H) At E9.5, both Fgfr1FCPG/FCPG and Fgfr1FCSPG/FCSPG exhibit defective patterning in intermediate mesoderm and somitic mesoderm, as marked by Pax2 and Uncx4.1, respectively. Scale bar represents 200μm.
Figure 6.
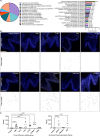
Figure 6.. Protein analysis of FGFR1FCPG and FGFR1FCSPG reveals FGF receptor interaction with focal adhesion complexes and intracellular trafficking.
A) GO Term analysis of proteins identified from Co-immunoprecipitation/Mass spectroscopy. Top-level primary term distribution from 1418 proteins identified across all FGFR1 mutants and control (left panel). Fold-enrichment of secondary and tertiary terms involved in endocytosis and ECM interactions. B) Images of proximity ligation assay in E8.5 Fgfr1Myc/Myc embryos. An anti-Myc antibody was paired with an antibody against the indicated protein to identify proximity of the two proteins within 40nm. Background fluorescence was filtered, and threshold values were standardized across all images. Scale bar represents 100μm. C) Quantification of PLA puncta in focal adhesion-related genes (left graph) and endocytosis-related genes (right graph). FAK, CTNNA1, EPS15, and PIK3R2 all exhibited a significant increase in puncta compared to control samples. SRC and CTTN displayed an increased trend in puncta but were not statistically significant. Significance was determined using One-way ANOVA with Bonferroni correction for multiple comparisons.
Figure 7.
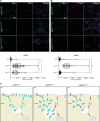
Figure 7.. FGFR1FCPG and FGFR1FCSPG exhibit alterations in endocytic trafficking and recycling.
A) Colocalization of FGFR1 with EEA1, a marker of early endosomes. Both FGFR1FCPG and FGFR1FCSPG show an increase colocalization, with FGFR1FCPG exhibiting significantly more colocalization than either FGFR1FCSPG or FGFR1Myc. Significance was determined using One-way ANOVA with Bonferroni correction for multiple comparisons. Scale bar represents 3μm. B) Colocalization of FGFR1 with RAB7, a marker of mid to late endosomes. FGFR1FCPG exhibits a significant increase in colocalization compared to either FGFR1Myc or FGFR1FCSPG. Significance was determined using One-way ANOVA with Bonferroni correction for multiple comparisons. Scale bar represents 3μm. C) Proper endocytic recycling of FGFR1 is required to maintain full functionality of FGFR1 signaling. FGFR1FCPG accumulates in EEA1 and Rab7-positive endosomes, indicating a reduction in recycling to the membrane. FGFR1FCSPG also exhibits changes in trafficking with accumulation in EEA1-positive endosomes, indicating a failure to proceed through endocytic recycling pathways.

Similar articles

References

    1. Anderson M.J., Magidson V., Kageyama R., Lewandoski M., 2020. Fgf4 maintains Hes7 levels critical for normal somite segmentation clock function. Elife 9. - PMC - PubMed
    1. Anderson M.J., Schimmang T., Lewandoski M., 2016. An FGF3-BMP Signaling Axis Regulates Caudal Neural Tube Closure, Neural Crest Specification and Anterior-Posterior Axis Extension. PLoS Genet 12, e1006018. - PMC - PubMed
    1. Anderson R.A., Boronenkov I.V., Doughman S.D., Kunz J., Loijens J.C., 1999. Phosphatidylinositol phosphate kinases, a multifaceted family of signaling enzymes. J Biol Chem 274, 9907–9910. - PubMed
    1. Auciello G., Cunningham D.L., Tatar T., Heath J.K., Rappoport J.Z., 2013. Regulation of fibroblast growth factor receptor signalling and trafficking by Src and Eps8. J Cell Sci 126, 613–624. - PMC - PubMed
    1. Barak H., Huh S.H., Chen S., Jeanpierre C., Martinovic J., Parisot M., Bole-Feysot C., Nitschke P., Salomon R., Antignac C., Ornitz D.M., Kopan R., 2012. FGF9 and FGF20 maintain the stemness of nephron progenitors in mice and man. Dev Cell 22, 1191–1207. - PMC - PubMed

Publication types