Dietary Supplementation of Tannins: Effect on Growth Performance, Serum Antioxidant Capacity, and Immunoglobins of Weaned Piglets-A Systematic Review with Meta-Analysis
- PMID: 38397834
- PMCID: PMC10886058
- DOI: 10.3390/antiox13020236
Dietary Supplementation of Tannins: Effect on Growth Performance, Serum Antioxidant Capacity, and Immunoglobins of Weaned Piglets-A Systematic Review with Meta-Analysis
Abstract
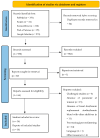
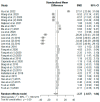
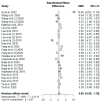
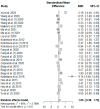
In recent years, the swine industry has witnessed the withdrawal of antibiotics and continuous regulation of zinc and copper oxides in the early-life nutrition of piglets. Due to this development, alternative additives from plant sources have been extensively explored. Therefore, this study's objective was to evaluate the effect of dietary supplementation with tannins on weaned piglets' growth performance, serum antioxidant capacity, and serum immune status using a systematic review and meta-analysis approach. A total of 16 studies with parameters of interest were deemed eligible after a two-step screening process following a comprehensive literature search in the scientific databases of Web of Science, Scopus, ScienceDirect, PubMed, and Google Scholar. The inclusion criteria were mainly (1) studies involving basal diet supplemented with tannins and (2) studies with the quantification of tannin doses, while the exclusion criteria were (1) studies with pre- and post-weaning pigs and (2) challenged studies. Applying the random-effects models, Hedges' g effect size of supplementation with tannins was calculated using R software to determine the standardized mean difference (SMD) at a 95% confidence interval. Sub-group analysis and meta-regression further explored heterogeneity (PSMD < 0.05, I2 > 50%, n ≥ 10). Supplementation with tannins reduced the feed conversion ratio (p < 0.01) but increased the final body weight (p < 0.01) of weaned piglets. Chestnut and grape seed proanthocyanidin tannin sources yielded higher effects on growth performance. In addition, meta-regression models indicated that tannin dosage and supplementation duration were directly associated with tannins' effectiveness on productive performance. In the serum, the concentration of glutathione peroxidase, superoxide dismutase, and total antioxidant capacity were elevated (p < 0.01) in response to tannin supplementation, whereas malondialdehydes was reduced (p < 0.01). Likewise, increased immunoglobin M and G levels (p < 0.01) were detected. In conclusion, dietary supplementation with tannins, particularly with chestnut and grape seed proanthocyanidins, increases the productivity of weaned piglets. At the same time, it is a possible nutritional strategy to mitigate oxidative stress and stimulate gut health. Thus, supplementing chestnut and grape seed proanthocyanidin tannins in the early phase of swine production could be used to alleviate the incidence of diarrhea.
Keywords: antibiotics; antioxidants; early-life nutrition; immunity; meta-analysis; performance; tannins; weaned piglets.
Conflict of interest statement
The authors declare no conflicts of interest.
Figures



Similar articles
-
Folic acid supplementation and malaria susceptibility and severity among people taking antifolate antimalarial drugs in endemic areas.Cochrane Database Syst Rev. 2022 Feb 1;2(2022):CD014217. doi: 10.1002/14651858.CD014217. Cochrane Database Syst Rev. 2022. PMID: 36321557 Free PMC article.
-
Effects of alkaline mineral complex water supplementation on growth performance, inflammatory response, and intestinal barrier function in weaned piglets.J Anim Sci. 2022 Oct 1;100(10):skac251. doi: 10.1093/jas/skac251. J Anim Sci. 2022. PMID: 35913841 Free PMC article.
-
Evaluation of Dietary Administration of Chestnut and Quebracho Tannins on Growth, Serum Metabolites and Fecal Parameters of Weaned Piglets.Animals (Basel). 2020 Oct 22;10(11):1945. doi: 10.3390/ani10111945. Animals (Basel). 2020. PMID: 33105748 Free PMC article.
-
Growth Performance, Meat Quality and Antioxidant Status of Sheep Supplemented with Tannins: A Meta-Analysis.Animals (Basel). 2021 Nov 8;11(11):3184. doi: 10.3390/ani11113184. Animals (Basel). 2021. PMID: 34827916 Free PMC article. Review.
-
Effects of Dietary Glutamine Supplementation on Heat-Induced Oxidative Stress in Broiler Chickens: A Systematic Review and Meta-Analysis.Antioxidants (Basel). 2023 Feb 24;12(3):570. doi: 10.3390/antiox12030570. Antioxidants (Basel). 2023. PMID: 36978818 Free PMC article. Review.
Cited by
-
The Influence of High-Concentrate Diet Supplemented with Tannin on Growth Performance, Rumen Fermentation, and Antioxidant Ability of Fattening Lambs.Animals (Basel). 2024 Aug 25;14(17):2471. doi: 10.3390/ani14172471. Animals (Basel). 2024. PMID: 39272256 Free PMC article.
-
Unlocking Phytate with Phytase: A Meta-Analytic View of Meat-Type Chicken Muscle Growth and Bone Mineralization Potential.Animals (Basel). 2024 Jul 17;14(14):2090. doi: 10.3390/ani14142090. Animals (Basel). 2024. PMID: 39061552 Free PMC article. Review.
References
-
- Luise D., Chalvon-Demersay T., Lambert W., Bosi P., Trevisi P. Meta-analysis to evaluate the impact of the reduction of dietary crude protein on the gut health of post-weaning pigs. Ital. J. Anim. Sci. 2021;20:1386–1397. doi: 10.1080/1828051X.2021.1952911. - DOI
Publication types
Grants and funding
LinkOut - more resources
Full Text Sources

