. 2024 Feb 23;15(1):1633.
doi: 10.1038/s41467-024-45357-1.

Influence of microbiota-associated metabolic reprogramming on clinical outcome in patients with melanoma from the randomized adjuvant dendritic cell-based MIND-DC trial

Affiliations

Influence of microbiota-associated metabolic reprogramming on clinical outcome in patients with melanoma from the randomized adjuvant dendritic cell-based MIND-DC trial

Carolina Alves Costa Silva et al. Nat Commun. .

Abstract

Tumor immunosurveillance plays a major role in melanoma, prompting the development of immunotherapy strategies. The gut microbiota composition, influencing peripheral and tumoral immune tonus, earned its credentials among predictors of survival in melanoma. The MIND-DC phase III trial (NCT02993315) randomized (2:1 ratio) 148 patients with stage IIIB/C melanoma to adjuvant treatment with autologous natural dendritic cell (nDC) or placebo (PL). Overall, 144 patients collected serum and stool samples before and after 2 bimonthly injections to perform metabolomics (MB) and metagenomics (MG) as prespecified exploratory analysis. Clinical outcomes are reported separately. Here we show that different microbes were associated with prognosis, with the health-related Faecalibacterium prausnitzii standing out as the main beneficial taxon for no recurrence at 2 years (p = 0.008 at baseline, nDC arm). Therapy coincided with major MB perturbations (acylcarnitines, carboxylic and fatty acids). Despite randomization, nDC arm exhibited MG and MB bias at baseline: relative under-representation of F. prausnitzii, and perturbations of primary biliary acids (BA). F. prausnitzii anticorrelated with BA, medium- and long-chain acylcarnitines. Combined, these MG and MB biomarkers markedly determined prognosis. Altogether, the host-microbial interaction may play a role in localized melanoma. We value systematic MG and MB profiling in randomized trials to avoid baseline differences attributed to host-microbe interactions.


Conflict of interest statement

L.Zi. founded EverImmune and is the SAB president of EverImmune. L.ZI. had grant support from Daichi Sankyo, Kaleido, 9 meters and Pileje. A.M.M.E.: consulting fees from Acetra, Agenus, BioInvent, Brenus, CatalYm, Epics, Ellipses, Galecto, GenOway, IO Biotech, IQVIA, ISA Pharmaceuticals, Merck&Co, MSD, Pierre Fabre, Sairopa, Scorpion, Sellas, SkylineDX, TigeTx, Trained Immunity TX. A.M.M.E.: participation on a Data Safety Monitoring Board: Boehringer Ingelheim, BioNTech, and Pfizer. A.M.M.E.: lectures for BMS, MSD. A.M.M.E.: stock or stock options for IO Biotech, SkylineDx and Sairopa. G.K. has been holding research contracts with Daiichi Sankyo, Eleor, Kaleido, Lytix Pharma, PharmaMar, Osasuna Therapeutics, Samsara Therapeutics, Sanofi, Tollys, and Vascage. G.K. is on the Board of Directors of the Bristol Myers Squibb Foundation France. G.K. is a scientific co-founder of EverImmune, Osasuna Therapeutics, Samsara Therapeutics and Therafast Bio. G.K. is in the scientific advisory boards of Hevolution, Institut Servier and Longevity Vision Funds. G.K. is the inventor of patents covering therapeutic targeting of aging, cancer, cystic fibrosis and metabolic disorders. G.K.’s brother, Romano Kroemer, was an employee of Sanofi and now consults for Boehringer-Ingelheim. B.R. is co-founder of Science Curebiota. L.D. is a SAB member of EverImmune. K.F.B.: consulting fees (institutional) from MSD and Pierre Fabre. The remaining authors declare no competing interests.

Figures
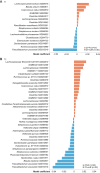
Fig. 1
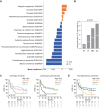
Fig. 1. Metagenomics-based profiles show taxonomic signatures associated with recurrence at 2 years (2Y-R) in two different time points.
A, B Linear model coefficients for microbial SGBs associated either with 2y-R or 2y-noR, corrected for age, gender and treatment arm at baseline (A, T1 n = 86) or after 4 weeks of therapy start (B, T2 n = 83). Positive values indicate species-level genome bin (SGB) association with 2Y-R (orange), while negative values indicate a positive association for the corresponding SGB with 2Y-noR (blue). Only associations with p ≤ 0.05 are reported since no association has Benjamini-Hochberg Q < 0.2. Refer to Supplementary Data 1 for linear model coefficients (MaAsLin2, coefficient) for microbial SGBs after arcsine square root (arcsin-sqrt) transformation (AST). Source data are provided as a Source Data file.
Fig. 2
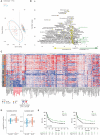
Fig. 2. Longitudinal metabolic patterns showing a shift in lipid metabolism associated with recurrence at 2 years (2Y-R).
A Principal component analysis (PCA) plot representing the distribution of serum metabolomics (MB) overtime and according to 2y-R (orange, n = 83) versus no recurrence at 2 years (2y-noR, blue, n = 56). Circle: 2y-noR at baseline (T1); triangle: 2y-noR after 4 weeks of therapy start (T2); Square: 2y-R at T1; Crosses: 2y-R at T2. B Volcano-plots based on MB showing differences (p <  0.05, two-sided Mann–Whitney U-test with no adjustment) between T1 (green dots, n = 143) and T2 (yellow dots, n = 143) with a cut-off in the T2/T1 fold change (FC) ≥ 0.3. Metabolites with T2/T1 FC ≥ 0.3 with a p <  0.05 were colored green. X-axis: log2 fold change of metabolites; Y-axis: fold change of –log10. C Hierarchical clustering of MB according to 2y-noR (n = 56) versus 2y-R (n = 83) at T1 and T2 and treatment arm. Dark gray: 2y-R at T1; Light orange: 2y-R at T2; Light gray: 2y-noR at T1; Light blue: 2y-noR at T2. Dark blue: placebo (PL) arm (n = 47); Dark orange: natural Dendritic Cell (nDC) arm (n = 92). Targeted MB computed as normalized areas of identified metabolites. Heatmap illustrating the changes in metabolite abundances according to the median of each metabolite in the two subgroups of opposite prognosis, highlighting the fatty acids (FA). Rows are samples, columns are metabolites. Heatmap data are log2 normalized and centered around the average abundance computed from all the samples for each metabolite. Red/blue colors are ion signal higher/lower than average and gray are missing values. Samples are sorted following biological conditions and metabolites clustered following the ward.D2 algorithm, with euclidean distance. D Relative abundance of Carnitine C14:2 (left panel) and Linolenic acid (right panel) in 2y-noR (blue: n = 56) and 2y-R (orange: n = 83 at T1). Boxplots indicates the interquartile range Q1 to Q3 with Q2 (median) in the center. The range of outliers is depicted by whiskers. The p value are related to the group comparison using the two-sided Mann–Whitney U-test with no adjustment. E Recurrence-free survival (RFS) analysis using the Kaplan–Meier estimator (Log-Rank (Mantel Cox) test) to assess low FA versus high FA (calculated based on the sum of relative abundances of 13 most significant FA or carboxylic acids) at T1 (left panel) and at T2 (right panel).
Fig. 3
Fig. 3. Significant differences in the microbiota taxonomic profiles at randomization.
A Linear model coefficients for microbial SGBs differentially abundant either in the natural dendritic cell (nDC, n = 56) or placebo (PL, n = 31) arms, corrected for age and gender. Positive values indicate species-level genome bin (SGB) association with nDC (orange), while negative values indicate a positive association for the corresponding SGB with PL (blue). Only associations with p ≤ 0.05 are reported since no association has Benjamini-Hochberg Q < 0.2. Refer to Supplementary Data 3 for linear model coefficients (MaAsLin2, coefficient) for microbial SGBs after arcsine square root (arcsin-sqrt) transformation (AST). Source data are provided as a Source Data file. B Prevalence of Faecalibacterium prausnitzii, i.e., proportion of individuals with its absence between healthy volunteers (HV, n = 5345), patients into PL arm (n = 31), all patients with melanoma into MIND-DC trial (MEL, n = 88) and nDC arm (n = 57). The p values are related to the group comparison using the Chi-square test (p < 0.0001). Recurrence-free survival (RFS) analysis using the Kaplan–Meier estimator (Log-Rank (Mantel Cox) test) to assess the predictive value of Gemmiger formicilis (C, left panel) and Lachnospira pectinoschiza (C, right panel) and F. prausnitzii (D) using relative abundances at T1. The two groups of patients were defined by reference values of relative abundances (MetaPhlAn 4) from publicly available HV cohort: high if ≥ median and low if <median of the metagenomic species’ relative abundance from HV. The numbers per group are depicted under the plots.
Fig. 4
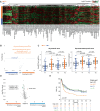
Fig. 4. Significant differences in metabolomics (MB) profiles at randomization.
A Hierarchical clustering of metabolites according to the randomization arm: placebo (PL, n = 49) versus natural Dendritic Cell (nDC, n = 94) at baseline (T1)). Targeted MB data on serum samples computed as normalized areas of identified metabolites. Heatmap illustrating the changes in metabolite abundances according to the median of each metabolite in the two arms. Rows are samples, columns are metabolites. Heatmap data are log2 normalized and centered around the average abundance computed from all the samples for each metabolite. Red/green colors are ion signal higher/lower than average and missing values are displayed as gray. Samples and metabolites are cluterized following the ward.D2 algorithm, with euclidean distance. B Volcano-plots based on metabolomic data showing significant (p < 0.05) differences between PL (blue dots, n = 49) and nDC (orange dots, n = 94) with a cut -off in the fold change (FC (DC/Placebo)) ≥ 0.5. X-axis: log2 fold change of metabolites; Y-axis: fold change of –log10. The p value determined by the two-sided Mann–Whitney U-test with no adjustment. C Relative abundances of key metabolites (glycoconjugated primary bile acids) from significant perturbations detected in (B). between nDC (orange, n = 94) and PL (blue, n = 49) arms at T1 and T2. Boxplots indicates the interquartile range Q1 to Q3 with Q2 (median) in the center. The range of outliers is depicted by whiskers. The p value are related to the group comparison using the two-sided Mann–Whitney U-test with no adjustment. The exact p values are reported in Supplementary Data 5. D Volcano-plots based on metabolite significant differences in the nDC arm at T1 (n = 95) associated with recurrence (R) (orange, left) versus no recurrence (noR) (blue, right). Metabolites with FC (R-nDC/noR-nDC)) ≥ 0.5 and p < 0.05 were colored in red dots, while those with FC (R-nDC /noR-DC) <  0.5 and p < 0.05 were colored in green dots. X-axis: log2 fold change of metabolites; Y-axis: fold change of –log10 P value determined by the two-sided Mann–Whitney U-test with no adjustment. E Recurrence-free survival (RFS) analysis using the Kaplan–Meier estimator (Log-Rank (Mantel Cox) test) to assess the predictive value of Cholic acid abundance at T1.
Fig. 5
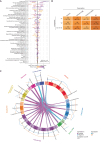
Fig. 5. Machine learning (ML, XGBoost) algorithm to identify biomarkers and their interaction predicting recurrence in patients with stage III melanoma.
A ML model summary. Features are clinical parameters and metabolomics (MB) + metagenomics (MG) monitored in serum and feces, respectively, at T1 (n = 88 patients). SHapley Additive exPlanations (SHAP) values for each feature per patient are positive when the value of the feature increases the prediction of recurrence, negative otherwise. Each dot represents one patient and the color represents the value of each feature. The importance of the feature is depicted with the number on the left column. B ML performance using Boruta feature selection algorithm based on XGboost for 2Y-R prediction. Representation of the Area Under the ROC Curve (AUC) values for each treatment arm and feature (clinical, MB or MGS parameters) according to T1, T2 and T2-T1 slope of the trajectory. ROC: receiver operating characteristic. C Circosplot indicating correlations between common features described in (A, B), thickness of lines indicating an increasing positive (pink) or negative (blue) correlation.
Fig. 6
Fig. 6. Patient recurrence-free survival (RFS) according to Faecalibacterium prausnitzii and fatty acids.
A RFS analysis using the Kaplan–Meier (KM) estimator (Log-Rank (Mantel Cox) test) to assess the predictive value of low abundance of fatty acids (low FA) versus high abundance of fatty acids (high FA) after 2 biweekly injections (T2) in placebo (PL, left panel) and natural Dendritic Cell (nDC, right panel) arms. B Same as in (A) for Carnitine C12:0 (left panel) and Carnitine C14:1 (right panel) at T1. C Same as in (B) for Carnitine C12:0 (left panel) and Carnitine C14:1 (right panel) associated with relative abundances of Faecalibacterium prausnitzii at T1. The numbers per group are depicted under the KM plots.

Similar articles

Cited by

References

    1. Eggermont AM, Spatz A, Robert C. Cutaneous melanoma. Lancet. 2014;383:816–827. doi: 10.1016/S0140-6736(13)60802-8. - DOI - PubMed
    1. Reijers ILM, et al. Personalized response-directed surgery and adjuvant therapy after neoadjuvant ipilimumab and nivolumab in high-risk stage III melanoma: the PRADO trial. Nat. Med. 2022;28:1178–1188. doi: 10.1038/s41591-022-01851-x. - DOI - PubMed
    1. Morton DL, et al. Sentinel-node biopsy or nodal observation in melanoma. N. Engl. J. Med. 2006;355:1307–1317. doi: 10.1056/NEJMoa060992. - DOI - PubMed
    1. Eggermont AMM, et al. Adjuvant ipilimumab versus placebo after complete resection of high-risk stage III melanoma (EORTC 18071): a randomised, double-blind, phase 3 trial. Lancet Oncol. 2015;16:522–530. doi: 10.1016/S1470-2045(15)70122-1. - DOI - PubMed
    1. Eggermont AMM, et al. Prolonged survival in stage III melanoma with ipilimumab adjuvant therapy. N. Engl. J. Med. 2016;375:1845–1855. doi: 10.1056/NEJMoa1611299. - DOI - PMC - PubMed