. 2024 Jun 6;73(7):1169-1182.
doi: 10.1136/gutjnl-2023-330414.

HBV integrations reshaping genomic structures promote hepatocellular carcinoma

Affiliations

HBV integrations reshaping genomic structures promote hepatocellular carcinoma

Zhaoyang Qian et al. Gut. .

Abstract

Objective: Hepatitis B virus (HBV)-related hepatocellular carcinoma (HCC), mostly characterised by HBV integrations, is prevalent worldwide. Previous HBV studies mainly focused on a few hotspot integrations. However, the oncogenic role of the other HBV integrations remains unclear. This study aimed to elucidate HBV integration-induced tumourigenesis further.

Design: Here, we illuminated the genomic structures encompassing HBV integrations in 124 HCCs across ages using whole genome sequencing and Nanopore long reads. We classified a repertoire of integration patterns featured by complex genomic rearrangement. We also conducted a clustered regularly interspaced short palindromic repeat (CRISPR)-based gain-of-function genetic screen in mouse hepatocytes. We individually activated each candidate gene in the mouse model to uncover HBV integration-mediated oncogenic aberration that elicits tumourigenesis in mice.

Results: These HBV-mediated rearrangements are significantly enriched in a bridge-fusion-bridge pattern and interchromosomal translocations, and frequently led to a wide range of aberrations including driver copy number variations in chr 4q, 5p (TERT), 6q, 8p, 16q, 9p (CDKN2A/B), 17p (TP53) and 13q (RB1), and particularly, ultra-early amplifications in chr8q. Integrated HBV frequently contains complex structures correlated with the translocation distance. Paired breakpoints within each integration event usually exhibit different microhomology, likely mediated by different DNA repair mechanisms. HBV-mediated rearrangements significantly correlated with young age, higher HBV DNA level and TP53 mutations but were less prevalent in the patients subjected to prior antiviral therapies. Finally, we recapitulated the TONSL and TMEM65 amplification in chr8q led by HBV integration using CRISPR/Cas9 editing and demonstrated their tumourigenic potentials.

Conclusion: HBV integrations extensively reshape genomic structures and promote hepatocarcinogenesis (graphical abstract), which may occur early in a patient's life.

Keywords: CARCINOGENESIS; GENE MUTATION; HEPATOCELLULAR CARCINOMA.


Conflict of interest statement

Competing interests: None declared.

Figures

Figure 1
Figure 1
Overview of HBV infection and integrations in 100 HCCs. (A) Heatmap depicting HBV genotype and HBV DNA load in 87 HBV-positive samples. (B) Detailed classification of 482 HBV integrations. (C) Functional region distribution of canonical and non-canonical integrations. (D) Distribution of canonical HBV integrations across the human genome, with α site (strand+) and β site (strand−) shown in different colours. (E) Distribution of non-canonical HBV integrations across the human genome, with colours same as D. (F) Comparison of chromosome distribution between canonical and non-canonical integrations. Significance are presented as *p<0.05, **p<0.01. (G) Distribution of canonical HBV integrations across the HBV genome. The integrations with a 5’ end viral DNA at the same strand (strand+) or the complementary strand (strand−) of HBV reference are shown in different colours. (H) Distributing non-canonical HBV integrations across the HBV genome, with colours the same as G. Cen, centromere; HBV, hepatitis B virus; HCC, hepatocellular carcinoma; NUM, non-unique mapping; Tel, telomere.
Figure 2
Figure 2
Five classes of integrations were detected with third-generation sequencing. (A) Diagram of five types of HBV integrations, including types I, II, IIIa, IIIb and IV. The top panels of each subfigure depict the structure of HBV insertion into the human genome, including the relative position of the two breakpoints and the strand in the host genome. The middle panels of each subfigure show the induced CNV pattern corresponding to each integration type. The bottom panels show the junction model of DNA fragments, including strands (arrows) in each integration type. (B) The distance between the two breakpoints of each integration event shown in (A). The two breakpoints were identical for every type IIIa integration; thus, the distance was not displayed. (C) Examples of complex integrated HBV sequences constructed by ONT long reads, including examples representing different integration types. For each case, the multiple HBV fragments are presented in different colours with a strand (arrow), and their arrangements are shown. (D) The segments of simple integrated HBV sequences. Each line depicts the integrated HBV sequence in each event, and colours represent the integration type. (E) Barplot and boxplot display the length distribution of integrated HBV DNA for the five integration types. Simple and complex HBV inserts are presented in different colours in the barplot. CNV, copy number variation; HBV, hepatitis B virus; ONT, Oxford Nanopore Technology.
Figure 3
Figure 3
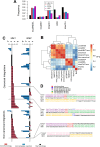
Characterisation of integration-mediated structural variations. (A) Comparison of patterns between human SVs of three datasets and HBV-mediated SVs. Human SV patterns including LocalINDEL (duplications and deletions with length 1 kb-1Mb), LocalINV (Inverted fusions with two breakpoints distant 5 kb–1 Mb), IntraChr (all other intrachromosome translocations with two breakpoints distant >1 Mb), BFB (Inverted fusions with two breakpoints distant <5 kb) and InterChr (interchromosome translocations). (B) Heatmap of microhomology-signature correlation matrix between different types of human SVs and HBV-mediated SVs. The details of each SV type are described in online supplemental figure 8. (C) Microhomology at the junction sites of paired integrations (site1 and site 2, corresponding to the same row). The y-axis of the bars denotes the length of microhomology at each site. Colours highlighted microhomology status. (D) Examples of microhomology at the paired integration sites corresponding to C. BFB, bridge-fusion-bridge; HBV, hepatitis B virus; SVs, structural variations.
Figure 4
Figure 4
HBV integration-related CNVs. (A, B) Distribution of HBV integration-induced CNVs, including amplifications (A) and deletions (B) across the human genome. (C) Heatmap depicting integration-induced amplifications in chr5p increased the copy number of TERT. (D) Heatmap depicting integration-induced deletions in chr17p, which decreased the copy number of TP53. (E) Timing of HBV integration-induced chr8q amplification. For HCC08, HCC73 and HCC82, the chr8q amplified repeatedly at different times. CNVs, copy number variations; HBV, hepatitis B virus; HCC, hepatocellular carcinoma.
Figure 5
Figure 5
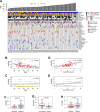
Landscape of genomic aberrations and clinical relevance associated with HBV integrations in 124 HCCs (A) Mutations and SVs in driver genes and HBV-induced CNVs are presented. The top and middle panels display patients’ age and clinical characteristics. (B-–E) Association between age and the number of (B) non-canonical and (C) canonical integrations, and the association between HBV DNA load and the number of (D) non-canonical and (E) canonical integrations. (F) Comparison of numbers of non-canonical HBV integrations between TP53 mutant and wild-type samples. (G) Comparison of non-canonical integration numbers between samples with and without anti-viral treatment. (H) Comparison of non-canonical integration numbers between samples with a positive or negative HBeAg. CNVs, copy number variations; HBeAg, hepatitis B envelope antigen ; HBV, hepatitis B virus; HCC, hepatocellular carcinoma; SVs, structural variations.
Figure 6
Figure 6
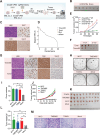
TONSL and TMEM65 function as novel drivers promoting tumourigenesis. (A) Flow chart for CRISPR activation screening to identify genes involved in HBV-integration-associated hepatocarcinogenesis. (B) Images of tumours from NSG mice engrafted with dCas9-VP64-BNL-CL.2 cells stably expressing the focused CRISPRa sgRNA library (n=7 mice). (C) Representative images for H&E and IHC staining, with the antibodies indicated, of tumours developing from grafts transduced with the CRISPRa lentiviral library. Tumours exhibit histological and pathological characteristics typical of HCC. Scale bar: 50 μm. (D) MAGeCK analysis and RRA ranking of the top enriched genes identified from the CRISPRa screen. Coloured dots represent the top three ranked genes. (E) Tumour volume over time in NSG mice engrafted with dCas9-VP64-BNL-CL.2 cells expressing individual sgRNAs for Tonsl and Tmem65. Data are presented as the mean±SEM, n=3 or 2 mice per group. (F) Images of tumours from NSG mice implanted/engrafted as in E. (G) Representative images for H&E and IHC staining, with the antibodies indicated, of Tonsl-activated and Tmem65-activated BNL-CL.2 grafts. These tumours show histological and pathological characteristics typical of HCC. Scale bar: 50 μm. (H) Colony formation assays of indicated NIH/3T3 stably-transduced cells. (I) Quantification of clone numbers in H. (J) Tumour volumes over time in nude mice engrafted with indicated NIH/3T3 stably-transduced cells. (K) Images of NIH/3T3 allograft tumours. (L) Weights of NIH/3T3 allograft tumours. The tumours were removed, photographed, and weighed. (M) Representative images for H&E of TONSL, TMEM65, and MYC-overexpressed NIH/3T3 grafts. Scale bar: 50 μm. Data are presented as the mean±SEM, **, p<0.01, and ***, p<0.001. HCC, hepatocellular carcinoma; NGS, next-generation sequencing.
Figure 7
Figure 7
Transcriptomic and single-cell analysis demonstrated the oncogenic mechanism of TMEM65 and TONSL. (A) Heatmap depicting expression levels of five clusters of differently expressed genes among the control group and the TMEM65, TONSL and MYC transformed NIH/3T3 allograft tumours. (B) Pathway enrichment of five differently expressed gene clusters in A. (C) Comparison of gene expressions between Tmem65 or Tonsl-activated tumour cells and the original BNL-CL.2 cell line. The y-axis represents the expression level of genes (CPM: count per million reads), and the error bars denote the 95% CI. (D) Comparison of the expression level of cancer hallmark pathways between hepatocytes in Tmem65 or Tonsl-activated allografts and the original BNL-CL.2 cell lines. The boxplot in each subfigure represents a cancer hallmark pathway. For the G2M checkpoint and E2f targets, the comparisons were between cycling hepatocytes in each sample.

Similar articles

Cited by

References

    1. Feng H, Shuda M, Chang Y, et al. . Clonal integration of a polyomavirus in human Merkel cell carcinoma. Science 2008;319:1096–100. 10.1126/science.1152586 - DOI - PMC - PubMed
    1. Totoki Y, Tatsuno K, Covington KR, et al. . Trans-ancestry mutational landscape of hepatocellular carcinoma genomes. Nat Genet 2014;46:1267–73. 10.1038/ng.3126 - DOI - PubMed
    1. Akagi K, Li J, Broutian TR, et al. . Genome-wide analysis of HPV integration in human cancers reveals recurrent, focal genomic instability. Genome Res 2014;24:185–99. 10.1101/gr.164806.113 - DOI - PMC - PubMed
    1. Sung W-K, Zheng H, Li S, et al. . Genome-wide survey of recurrent HBV integration in hepatocellular carcinoma. Nat Genet 2012;44:765–9. 10.1038/ng.2295 - DOI - PubMed
    1. Tang K-W, Alaei-Mahabadi B, Samuelsson T, et al. . The landscape of viral expression and host gene fusion and adaptation in human cancer. Nat Commun 2013;4:2513. 10.1038/ncomms3513 - DOI - PMC - PubMed

Publication types