

Host transcriptome response to heat stress and Eimeria maxima infection in meat-type chickens
- PMID: 38394169
- PMCID: PMC10889870
- DOI: 10.1371/journal.pone.0296350
Host transcriptome response to heat stress and Eimeria maxima infection in meat-type chickens
Abstract
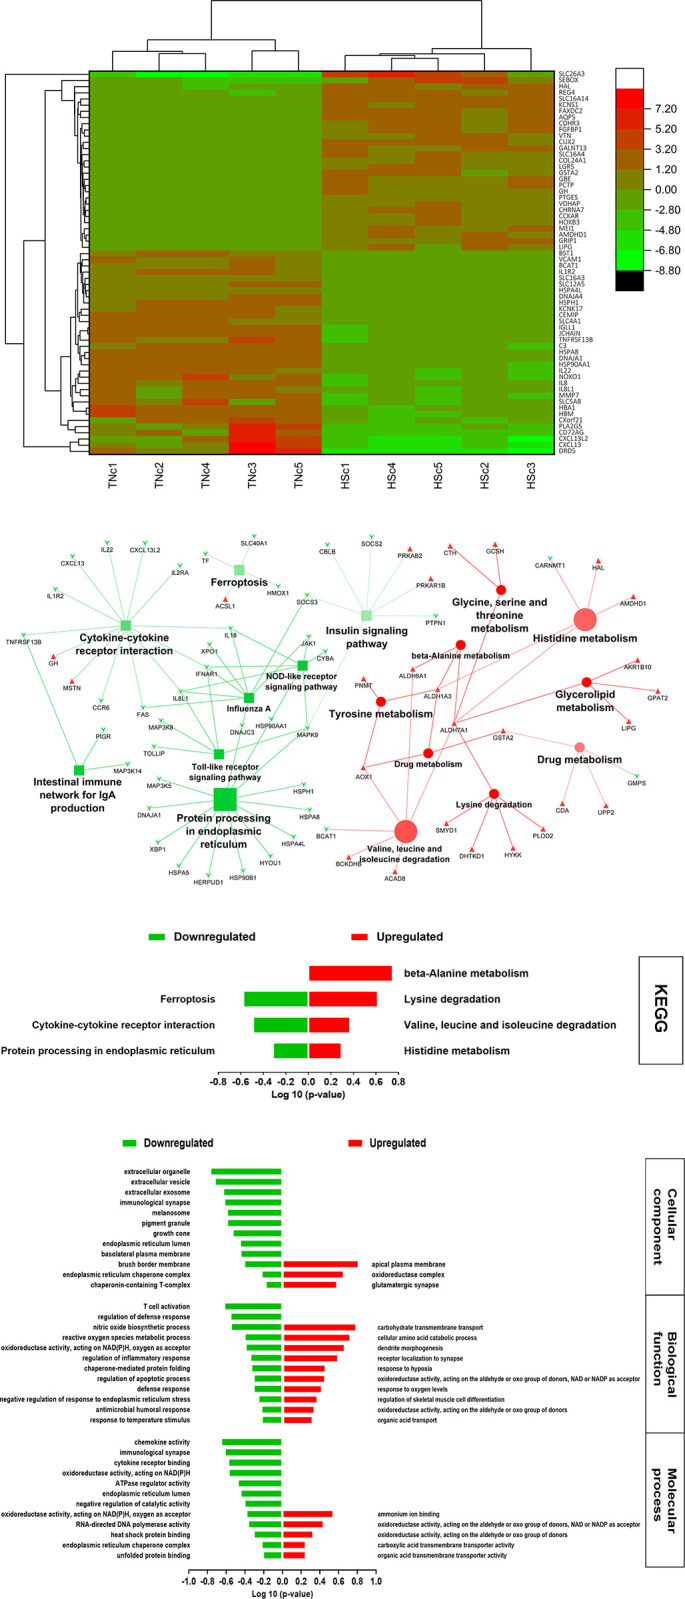
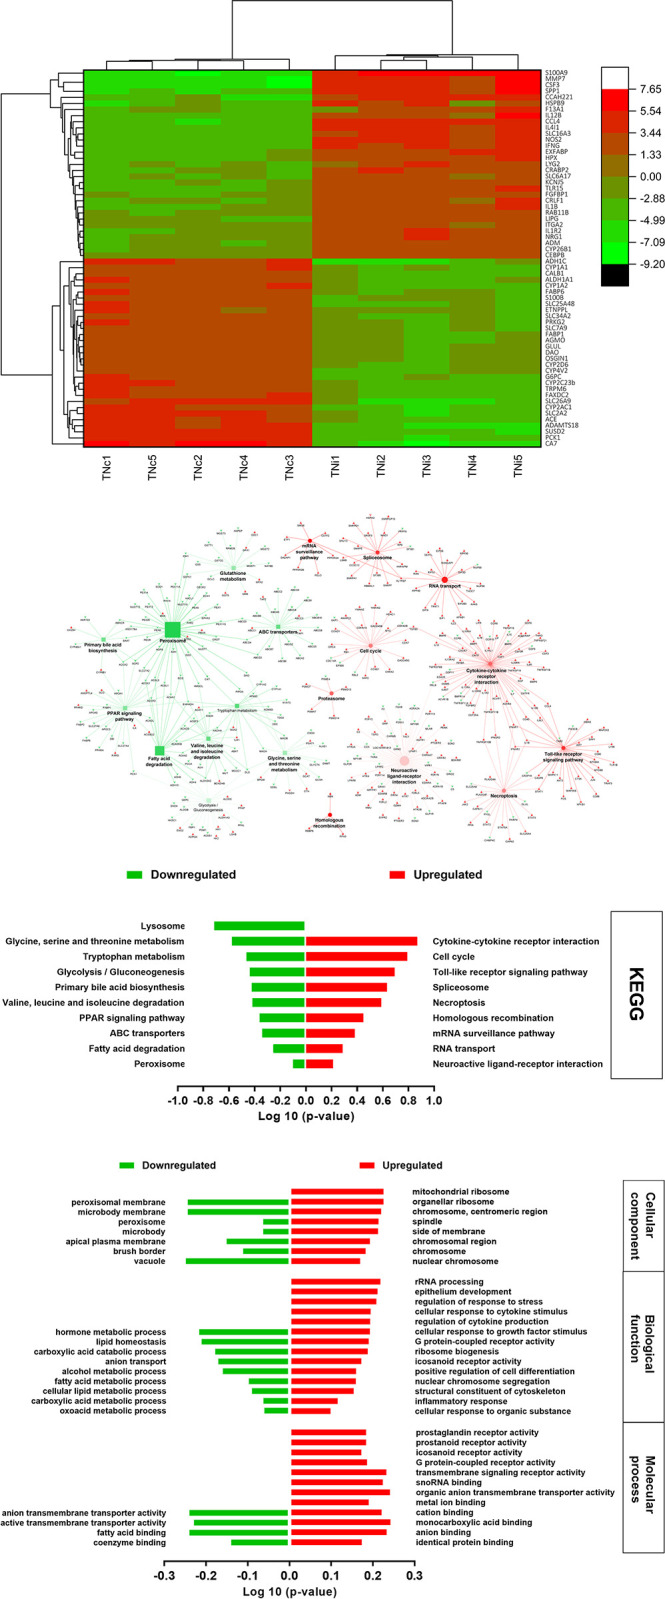
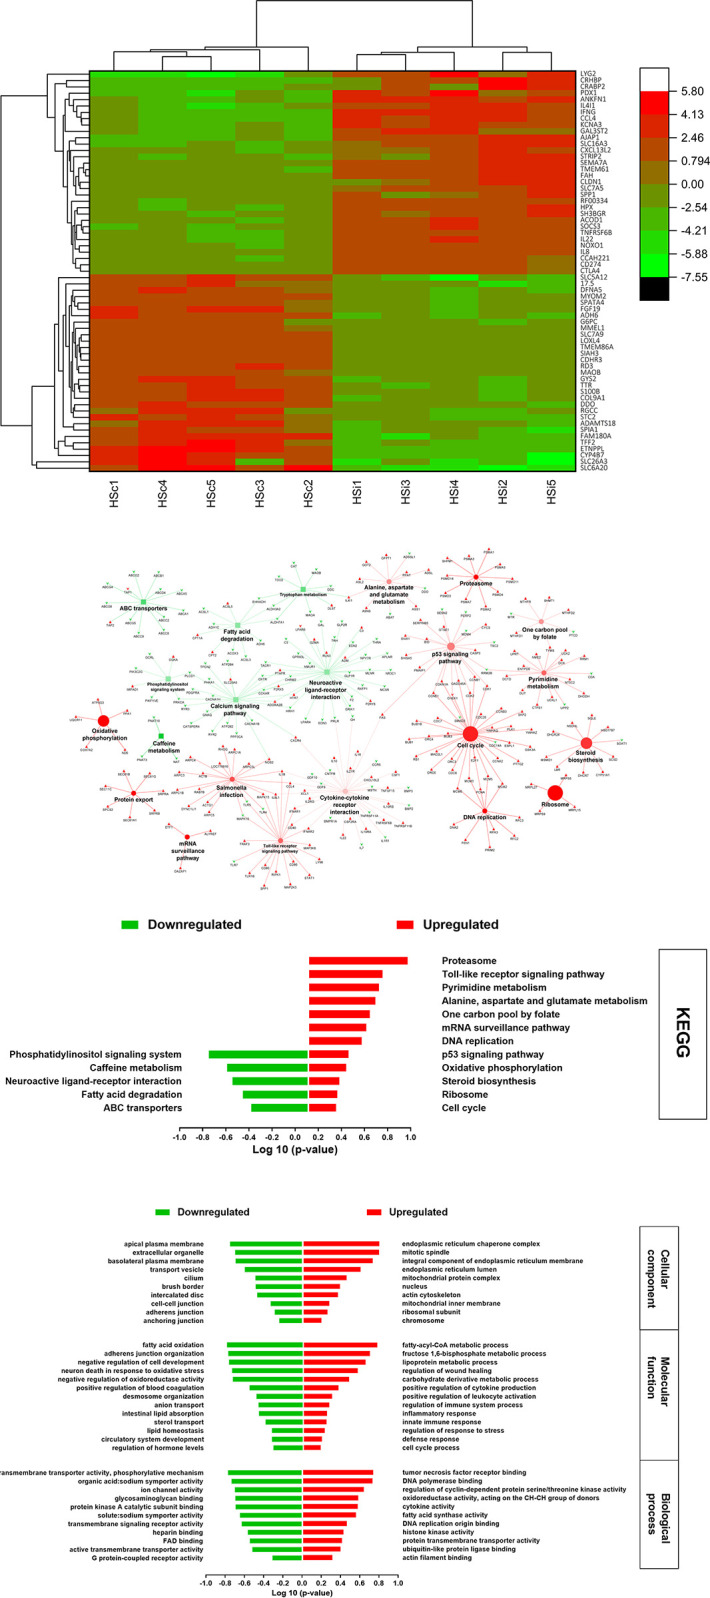
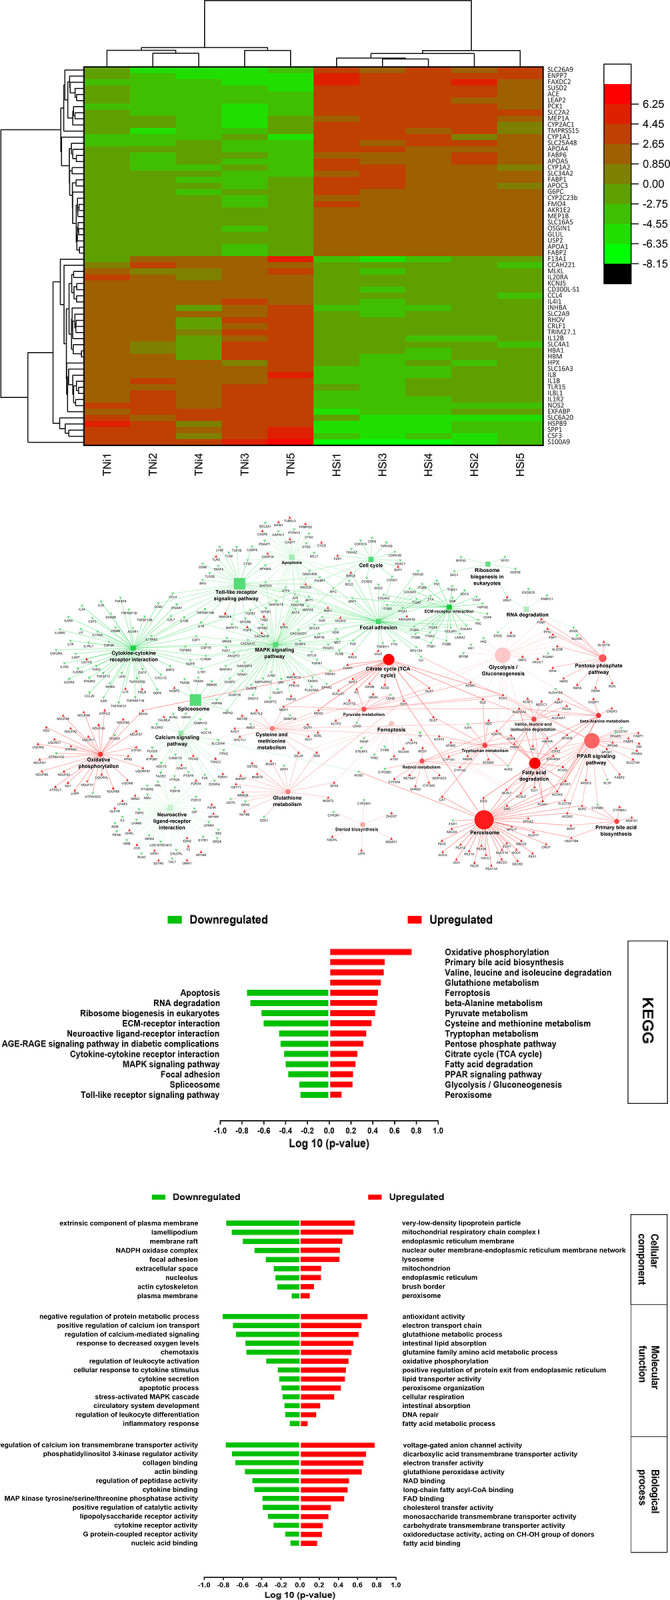
Eimeria (E.) maxima parasite infects chickens' midgut disrupting the jejunal and ileal mucosa causing high morbidity and mortality. Heat stress (HS) is a seasonal stressor that impacts biological functions leading to poor performance. This study elucidates how HS, E. maxima infection, and their combination affect the ileum transcriptome. Two-hundred and forty 2-week-old males Ross708 chickens were randomly allocated into four treatment groups: thermoneutral-control (TNc), thermoneutral-infected (TNi), heat-stress control (HSc), and heat stress-infected (HSi), with 6 replicates each of 10 birds. Infected groups received 200x103 sporulated E. maxima oocysts/bird, and heat-treated groups were raised at 35°C. At 6-day post-treatment, ileums of five randomly selected chickens per group were sampled, RNA was extracted and sequenced. A total of 413, 3377, 1908, and 2304 DEGs were identified when applying the comparisons: TNc vs HSc, TNc vs TNi, HSi vs HSc, and TNi vs HSi, respectively, at cutoff ≥1.2-fold change (FDR: q<0.05). HSc vs TNc showed upregulation of lipid metabolic pathways and degradation/metabolism of multiple amino acids; and downregulation of most immune-related and protein synthesis pathways. TNc vs TNi displayed upregulation of most of immune-associated pathways and eukaryotic mRNA maturation pathways; and downregulation of fatty acid metabolism and multiple amino acid metabolism pathways including tryptophan. Comparing HSi versus HSc and TNi revealed that combining the two stressors restored the expression of some cellular functions, e.g., oxidative phosphorylation and protein synthesis; and downregulate immune response pathways associated with E. maxima infection. During E. maxima infection under HS the calcium signaling pathway was downregulated, including genes responsible for increasing the cytoplasmic calcium concentration; and tryptophan metabolism was upregulated, including genes that contribute to catabolizing tryptophan through serotonin and indole pathways; which might result in reducing the cytoplasmic pool of nutrients and calcium available for the parasite to scavenge and consequently might affect the parasite's reproductive ability.
Copyright: © 2024 Ghareeb et al. This is an open access article distributed under the terms of the Creative Commons Attribution License, which permits unrestricted use, distribution, and reproduction in any medium, provided the original author and source are credited.
Conflict of interest statement
The authors have declared that no competing interests exist.
Figures

Similar articles
-
Heat stress modulates the disruptive effects of Eimeria maxima infection on the ileum nutrient digestibility, molecular transporters, and tissue morphology in meat-type chickens.PLoS One. 2022 Jun 3;17(6):e0269131. doi: 10.1371/journal.pone.0269131. eCollection 2022. PLoS One. 2022. PMID: 35657942 Free PMC article.
-
Heat Stress Alters the Effect of Eimeria maxima Infection on Ileal Amino Acids Digestibility and Transporters Expression in Meat-Type Chickens.Animals (Basel). 2022 Jun 16;12(12):1554. doi: 10.3390/ani12121554. Animals (Basel). 2022. PMID: 35739890 Free PMC article.
-
Heat stress reduces sexual development and affects pathogenesis of Eimeria maxima in meat-type chickens.Sci Rep. 2020 Jul 1;10(1):10736. doi: 10.1038/s41598-020-67330-w. Sci Rep. 2020. PMID: 32612102 Free PMC article.
-
Comprehensive analysis of differentially expressed mRNA profiles in chicken jejunum and cecum following Eimeria maxima infection.Poult Sci. 2024 Jun;103(6):103716. doi: 10.1016/j.psj.2024.103716. Epub 2024 Apr 3. Poult Sci. 2024. PMID: 38703453 Free PMC article.
-
Epidemiological aspects of the use of live anticoccidial vaccines for chickens.Int J Parasitol. 1998 Jul;28(7):1089-98. doi: 10.1016/s0020-7519(98)00066-6. Int J Parasitol. 1998. PMID: 9724880 Review.
References
-
- Ashraf S, Zaneb H, Yousaf MS, Ijaz A, Sohail MU, Muti S, et al.. Effect of dietary supplementation of prebiotics and probiotics on intestinal microarchitecture in broilers reared under cyclic heat stress. J Anim Physiol Anim Nutr (Berl). 2013;97 Suppl 1:68–73. Epub 2013/05/10. doi: 10.1111/jpn.12041 . - DOI - PubMed
-
- Nardone A, Ronchi B, Lacetera N, Ranieri MS, Bernabucci U. Effects of climate changes on animal production and sustainability of livestock systems. Livestock Science. 2010;130(1–3):57–69.
-
- Imik H, Ozlu H, Gumus R, Atasever MA, Urcar S, Atasever M. Effects of ascorbic acid and α-lipoic acid on performance and meat quality of broilers subjected to heat stress. British Poultry Science. 2012;53(6):800–8. - PubMed
Publication types
MeSH terms
Substances
Grants and funding
LinkOut - more resources
Full Text Sources
Molecular Biology Databases
Miscellaneous
