. 2024 Mar 1;14(3):406-423.
doi: 10.1158/2159-8290.CD-23-0680.

Integrative Analyses of Tumor and Peripheral Biomarkers in the Treatment of Advanced Renal Cell Carcinoma

Affiliations

Integrative Analyses of Tumor and Peripheral Biomarkers in the Treatment of Advanced Renal Cell Carcinoma

Toni K Choueiri et al. Cancer Discov. .

Abstract

The phase III JAVELIN Renal 101 trial demonstrated prolonged progression-free survival (PFS) in patients (N = 886) with advanced renal cell carcinoma treated with first-line avelumab + axitinib (A+Ax) versus sunitinib. We report novel findings from integrated analyses of longitudinal blood samples and baseline tumor tissue. PFS was associated with elevated lymphocyte levels in the sunitinib arm and an abundance of innate immune subsets in the A+Ax arm. Treatment with A+Ax led to greater T-cell repertoire modulation and less change in T-cell numbers versus sunitinib. In the A+Ax arm, patients with tumors harboring mutations in ≥2 of 10 previously identified PFS-associated genes (double mutants) had distinct circulating and tumor-infiltrating immunologic profiles versus those with wild-type or single-mutant tumors, suggesting a role for non-T-cell-mediated and non-natural killer cell-mediated mechanisms in double-mutant tumors. We provide evidence for different immunomodulatory mechanisms based on treatment (A+Ax vs. sunitinib) and tumor molecular subtypes.

Significance: Our findings provide novel insights into the different immunomodulatory mechanisms governing responses in patients treated with avelumab (PD-L1 inhibitor) + axitinib or sunitinib (both VEGF inhibitors), highlighting the contribution of tumor biology to the complexity of the roles and interactions of infiltrating immune cells in response to these treatment regimens. This article is featured in Selected Articles from This Issue, p. 384.


Figures

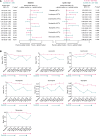
Figure 1. Association between PFS and circulating cell population numbers (109 cells/L) at baseline and following treatment with A+Ax or sunitinib. A, PFS according to numbers of different cell populations at baseline (left) and cycle 2 day 1 (right). For cycle 2 day 1, N values vary by subset; minimum to maximum N values are shown. Hazard ratios were calculated using the Cox proportional hazards model with < median used as the reference group. An HR of <1 indicates longer PFS in the ≥ median subgroup; an HR of >1 indicates longer PFS in the < median subgroup. B, Mean numbers of different peripheral cell populations at different time points. Error bars show standard error of the mean. Pink and teal arrows represent treatment with A+Ax and sunitinib, respectively. aTwo-sided P value comparing median cutoff subgroups (log-rank test); a statistical threshold value of P < 0.05 highlights observations of likely biological relevance.
Figure 1.
Association between PFS and circulating cell population numbers (109 cells/L) at baseline and following treatment with A+Ax or sunitinib. A, PFS according to numbers of different cell populations at baseline (left) and cycle 2 day 1 (right). For cycle 2 day 1, N values vary by subset; minimum to maximum N values are shown. Hazard ratios were calculated using the Cox proportional hazards model with < median used as the reference group. An HR of <1 indicates longer PFS in the ≥ median subgroup; an HR of >1 indicates longer PFS in the < median subgroup. B, Mean numbers of different peripheral cell populations at different time points. Error bars show standard error of the mean. Pink and teal arrows represent treatment with A+Ax and sunitinib, respectively. aTwo-sided P value comparing median cutoff subgroups (log-rank test); a statistical threshold value of P < 0.05 highlights observations of likely biological relevance.
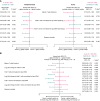
Figure 2. PFS according to T-cell quantitation or repertoire metrics. A, PFS according to T-cell repertoire metrics in baseline peripheral blood (left) or pretreatment tumor samples (right). B, PFS according to T-cell repertoire metrics in peripheral blood during treatment (cycle 2 day 1) with A+Ax or sunitinib. Hazard ratios were calculated using the Cox proportional hazards model with < median or decrease (log2 fold change <0) used as the reference group. An HR of <1 indicates longer PFS in the ≥ median or increase (log2 fold change ≥0) subgroup, whereas an HR of >1 indicates longer PFS in the < median or decrease (log2 fold change <0) subgroup. aTwo-sided P value comparing median or cutoff log2 fold change subgroups (log-rank test); a statistical threshold value of P < 0.05 highlights observations of likely biological relevance.
Figure 2.
PFS according to T-cell quantitation or repertoire metrics. A, PFS according to T-cell repertoire metrics in baseline peripheral blood (left) or pretreatment tumor samples (right). B, PFS according to T-cell repertoire metrics in peripheral blood during treatment (cycle 2 day 1) with A+Ax or sunitinib. Hazard ratios were calculated using the Cox proportional hazards model with < median or decrease (log2 fold change <0) used as the reference group. An HR of <1 indicates longer PFS in the ≥ median or increase (log2 fold change ≥0) subgroup, whereas an HR of >1 indicates longer PFS in the < median or decrease (log2 fold change <0) subgroup. aTwo-sided P value comparing median or cutoff log2 fold change subgroups (log-rank test); a statistical threshold value of P < 0.05 highlights observations of likely biological relevance.
Figure 3. PFS in the A+Ax arm according to mutation subgroup and proportion of different tumor-infiltrating lymphocyte subsets in pretreatment tumors. Two-sided P values comparing median subgroups within molecular subgroups were calculated using the log-rank test. aP values for treatment-by-biomarker interaction from a Cox model including treatment and biomarker, and the interaction term P value was smaller than 0.1 for naïve B cells (P = 0.0487), memory B cells (P = 0.0895), and M1 macrophages (P = 0.0717) using a 2-sided Wald test. bHazard ratios were calculated using the Cox proportional hazards model with < median used as the reference group, except for memory B cells, where the median value was 0 and 0/absence was used as the reference group. An HR of <1 indicates longer PFS in the ≥ median (or >0/presence) subgroup, whereas an HR of >1 indicates longer PFS in the < median (or 0/absence) subgroup. NE, not evaluable. PFS in the A+Ax arm according to mutation subgroup and proportion of different tumor-infiltrating lymphocyte subsets in pretreatment tumors. Two-sided P values comparing median subgroups within molecular subgroups were calculated using the log-rank test. aP values for treatmentby- biomarker interaction from a Cox model including treatment and biomarker, and the interaction term P value was smaller than 0.1 for naïve B cells (P = 0.0487), memory B cells (P = 0.0895), and M1 macrophages (P = 0.0717) using a 2-sided Wald test. bHazard ratios were calculated using the Cox proportional hazards model with < median used as the reference group, except for memory B cells, where the median value was 0 and 0/absence was used as the reference group. An HR of <1 indicates longer PFS in the ≥ median (or >0/presence) subgroup, whereas an HR of >1 indicates longer PFS in the < median (or 0/absence) subgroup. NE, not evaluable. PFS in the A+Ax arm according to mutation subgroup and proportion of different tumor-infiltrating lymphocyte subsets in pretreatment tumors. Two-sided P values comparing median subgroups within molecular subgroups were calculated using the log-rank test. aP values for treatmentby- biomarker interaction from a Cox model including treatment and biomarker, and the interaction term P value was smaller than 0.1 for naïve B cells (P = 0.0487), memory B cells (P = 0.0895), and M1 macrophages (P = 0.0717) using a 2-sided Wald test. bHazard ratios were calculated using the Cox proportional hazards model with < median used as the reference group, except for memory B cells, where the median value was 0 and 0/absence was used as the reference group. An HR of <1 indicates longer PFS in the ≥ median (or >0/presence) subgroup, whereas an HR of >1 indicates longer PFS in the < median (or 0/absence) subgroup. NE, not evaluable. PFS in the A+Ax arm according to mutation subgroup and proportion of different tumor-infiltrating lymphocyte subsets in pretreatment tumors. Two-sided P values comparing median subgroups within molecular subgroups were calculated using the log-rank test. aP values for treatmentby- biomarker interaction from a Cox model including treatment and biomarker, and the interaction term P value was smaller than 0.1 for naïve B cells (P = 0.0487), memory B cells (P = 0.0895), and M1 macrophages (P = 0.0717) using a 2-sided Wald test. bHazard ratios were calculated using the Cox proportional hazards model with < median used as the reference group, except for memory B cells, where the median value was 0 and 0/absence was used as the reference group. An HR of <1 indicates longer PFS in the ≥ median (or >0/presence) subgroup, whereas an HR of >1 indicates longer PFS in the < median (or 0/absence) subgroup. NE, not evaluable.
Figure 3.
PFS in the A+Ax arm according to mutation subgroup and proportion of different tumor-infiltrating lymphocyte subsets in pretreatment tumors. Two-sided P values comparing median subgroups within molecular subgroups were calculated using the log-rank test. aP values for treatment-by-biomarker interaction from a Cox model including treatment and biomarker, and the interaction term P value was smaller than 0.1 for naïve B cells (P = 0.0487), memory B cells (P = 0.0895), and M1 macrophages (P = 0.0717) using a 2-sided Wald test. bHazard ratios were calculated using the Cox proportional hazards model with < median used as the reference group, except for memory B cells, where the median value was 0 and 0/absence was used as the reference group. An HR of <1 indicates longer PFS in the ≥ median (or >0/presence) subgroup, whereas an HR of >1 indicates longer PFS in the < median (or 0/absence) subgroup. NE, not evaluable. PFS in the A+Ax arm according to mutation subgroup and proportion of different tumor-infiltrating lymphocyte subsets in pretreatment tumors. Two-sided P values comparing median subgroups within molecular subgroups were calculated using the log-rank test. aP values for treatmentby- biomarker interaction from a Cox model including treatment and biomarker, and the interaction term P value was smaller than 0.1 for naïve B cells (P = 0.0487), memory B cells (P = 0.0895), and M1 macrophages (P = 0.0717) using a 2-sided Wald test. bHazard ratios were calculated using the Cox proportional hazards model with < median used as the reference group, except for memory B cells, where the median value was 0 and 0/absence was used as the reference group. An HR of <1 indicates longer PFS in the ≥ median (or >0/presence) subgroup, whereas an HR of >1 indicates longer PFS in the < median (or 0/absence) subgroup. NE, not evaluable. PFS in the A+Ax arm according to mutation subgroup and proportion of different tumor-infiltrating lymphocyte subsets in pretreatment tumors. Two-sided P values comparing median subgroups within molecular subgroups were calculated using the log-rank test. aP values for treatmentby- biomarker interaction from a Cox model including treatment and biomarker, and the interaction term P value was smaller than 0.1 for naïve B cells (P = 0.0487), memory B cells (P = 0.0895), and M1 macrophages (P = 0.0717) using a 2-sided Wald test. bHazard ratios were calculated using the Cox proportional hazards model with < median used as the reference group, except for memory B cells, where the median value was 0 and 0/absence was used as the reference group. An HR of <1 indicates longer PFS in the ≥ median (or >0/presence) subgroup, whereas an HR of >1 indicates longer PFS in the < median (or 0/absence) subgroup. NE, not evaluable. PFS in the A+Ax arm according to mutation subgroup and proportion of different tumor-infiltrating lymphocyte subsets in pretreatment tumors. Two-sided P values comparing median subgroups within molecular subgroups were calculated using the log-rank test. aP values for treatmentby- biomarker interaction from a Cox model including treatment and biomarker, and the interaction term P value was smaller than 0.1 for naïve B cells (P = 0.0487), memory B cells (P = 0.0895), and M1 macrophages (P = 0.0717) using a 2-sided Wald test. bHazard ratios were calculated using the Cox proportional hazards model with < median used as the reference group, except for memory B cells, where the median value was 0 and 0/absence was used as the reference group. An HR of <1 indicates longer PFS in the ≥ median (or >0/presence) subgroup, whereas an HR of >1 indicates longer PFS in the < median (or 0/absence) subgroup. NE, not evaluable.
Figure 4. Circulating cytokine and chemokine levels with the greatest differences at cycle 2 day 1 by mutation subgroup in the A+Ax or sunitinib arm. Median ± 95% CI for each analyte. A+Ax: WT/S mutant subgroup, n = 209; rDM subgroup, n = 66; sunitinib: WT/S mutant subgroup, n = 201; rDM subgroup, n = 46. aN values for CRP analysis: A+Ax: WT/S mutant subgroup, n = 246; rDM subgroup, n = 70; sunitinib: WT/S mutant subgroup, n = 245; rDM subgroup, n = 50. A statistical threshold value of P < 0.05 highlights observations of likely biological relevance.
Figure 4.
Circulating cytokine and chemokine levels with the greatest differences at cycle 2 day 1 by mutation subgroup in the A+Ax or sunitinib arm. Median ± 95% CI for each analyte. A+Ax: WT/S mutant subgroup, n = 209; rDM subgroup, n = 66; sunitinib: WT/S mutant subgroup, n = 201; rDM subgroup, n = 46. aN values for CRP analysis: A+Ax: WT/S mutant subgroup, n = 246; rDM subgroup, n = 70; sunitinib: WT/S mutant subgroup, n = 245; rDM subgroup, n = 50. A statistical threshold value of P < 0.05 highlights observations of likely biological relevance.
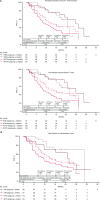
Figure 5. PFS according to mutation subgroup in the A+Ax arm for T-cell quantitation metrics. A, PFS according to mutation subgroup in the A+Ax arm based on peripheral baseline T-cell fraction (top) and normalized total T cells (bottom). B, PFS according to mutation subgroup in the A+Ax arm based on T-cell fraction in pretreatment tumor samples. Hazard ratios were calculated using the Cox proportional hazards model with < median used as the reference group. Two-sided P values comparing median subgroups within molecular subgroups were calculated using the log-rank test; a statistical threshold value of P < 0.05 highlights observations of likely biological relevance.
Figure 5.
PFS according to mutation subgroup in the A+Ax arm for T-cell quantitation metrics. A, PFS according to mutation subgroup in the A+Ax arm based on peripheral baseline T-cell fraction (top) and normalized total T cells (bottom). B, PFS according to mutation subgroup in the A+Ax arm based on T-cell fraction in pretreatment tumor samples. Hazard ratios were calculated using the Cox proportional hazards model with < median used as the reference group. Two-sided P values comparing median subgroups within molecular subgroups were calculated using the log-rank test; a statistical threshold value of P < 0.05 highlights observations of likely biological relevance.

Similar articles

References

    1. Choueiri TK, Motzer RJ, Rini BI, Haanen J, Campbell MT, Venugopal B, et al. . Updated efficacy results from the JAVELIN Renal 101 trial: first-line avelumab plus axitinib versus sunitinib in patients with advanced renal cell carcinoma. Ann Oncol 2020;31:1030–9. - PMC - PubMed
    1. Motzer RJ, Penkov K, Haanen J, Rini B, Albiges L, Campbell MT, et al. . Avelumab plus axitinib versus sunitinib for advanced renal-cell carcinoma. N Engl J Med 2019;380:1103–15. - PMC - PubMed
    1. Bavencio (avelumab). Prescribing information. EMD Serono Rockland, MA, USA 2023. [Cited September 22, 2023]. Available from: https://www.emdserono.com/us-en/pi/bavencio-pi.pdf.
    1. Inlyta (axitinib). Prescribing information. Pfizer 2022. [Cited September 22, 2023]. Available from: https://labeling.pfizer.com/showlabeling.aspx?id=759.
    1. Bavencio (avelumab). Summary of product characteristics. Merck Europe B.V, Amsterdam, the Netherlands, an affiliate of the healthcare business of Merck KGaA, Darmstadt, Germany. 2023. [Cited September 22, 2023]. Available from: https://www.ema.europa.eu/en/documents/product-information/bavencio-epar...