. 2024 Feb 7:14:1332733.
doi: 10.3389/fimmu.2023.1332733. eCollection 2023.

Immune mapping of human tuberculosis and sarcoidosis lung granulomas

Affiliations

Immune mapping of human tuberculosis and sarcoidosis lung granulomas

Berit Carow et al. Front Immunol. .

Abstract

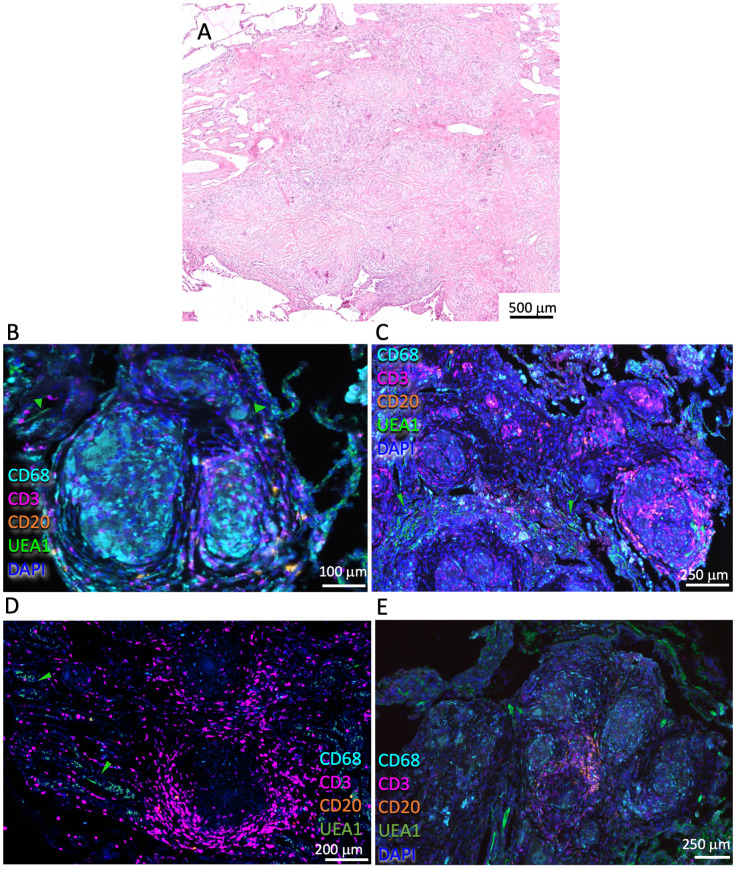
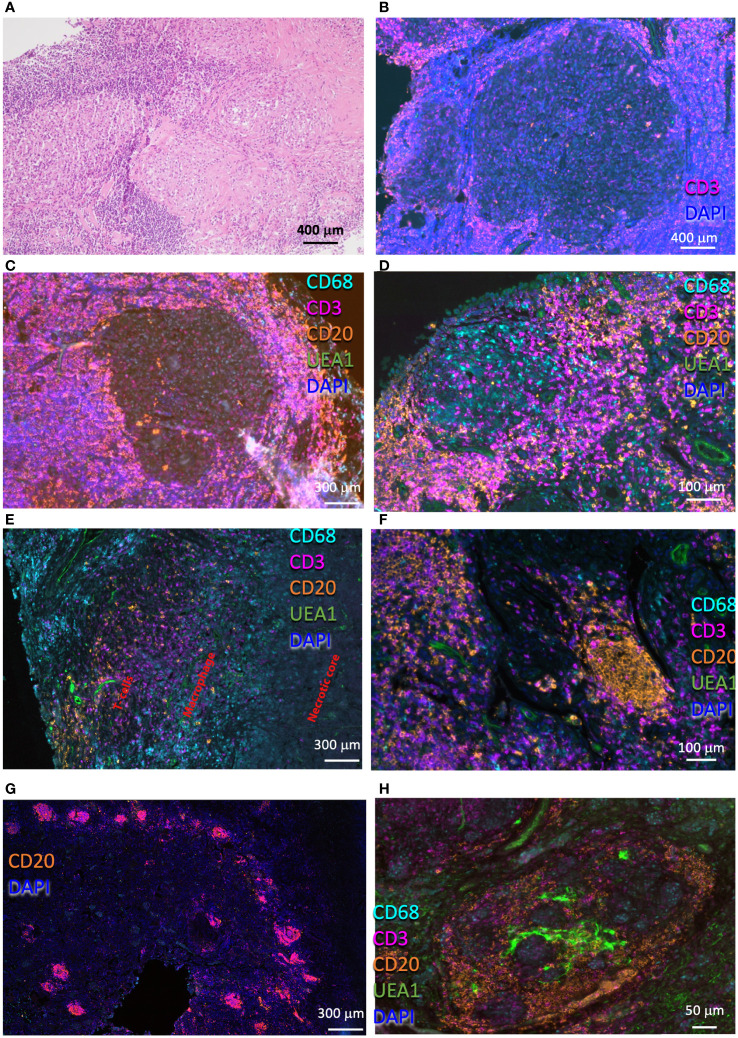
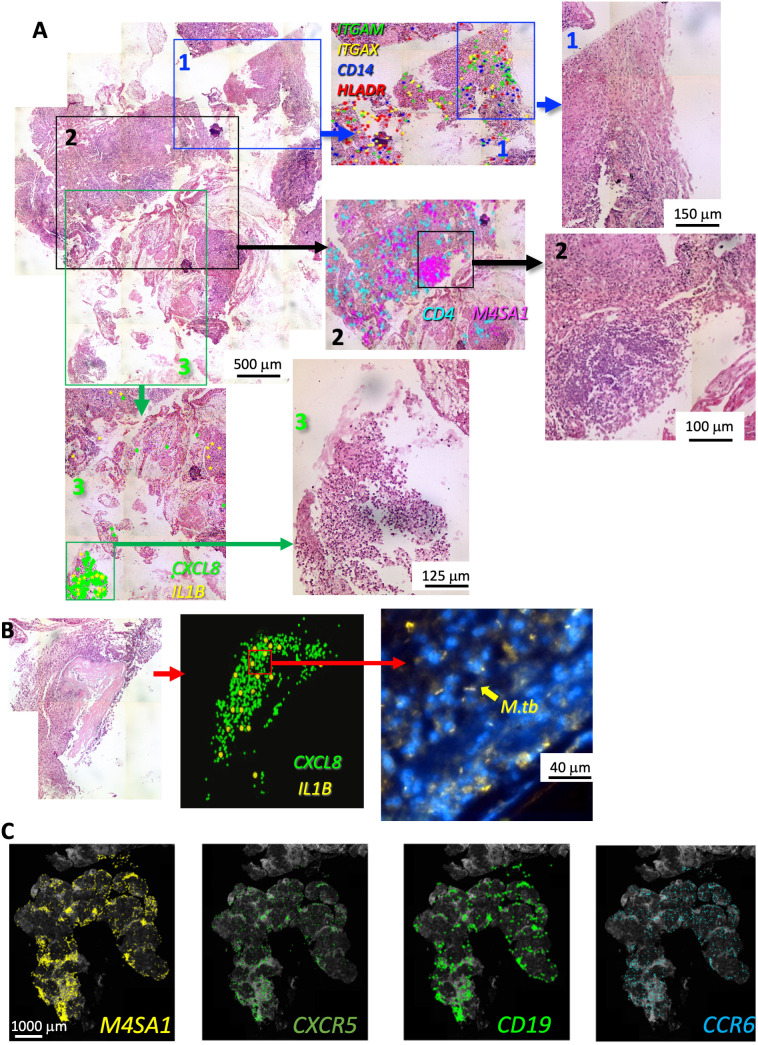
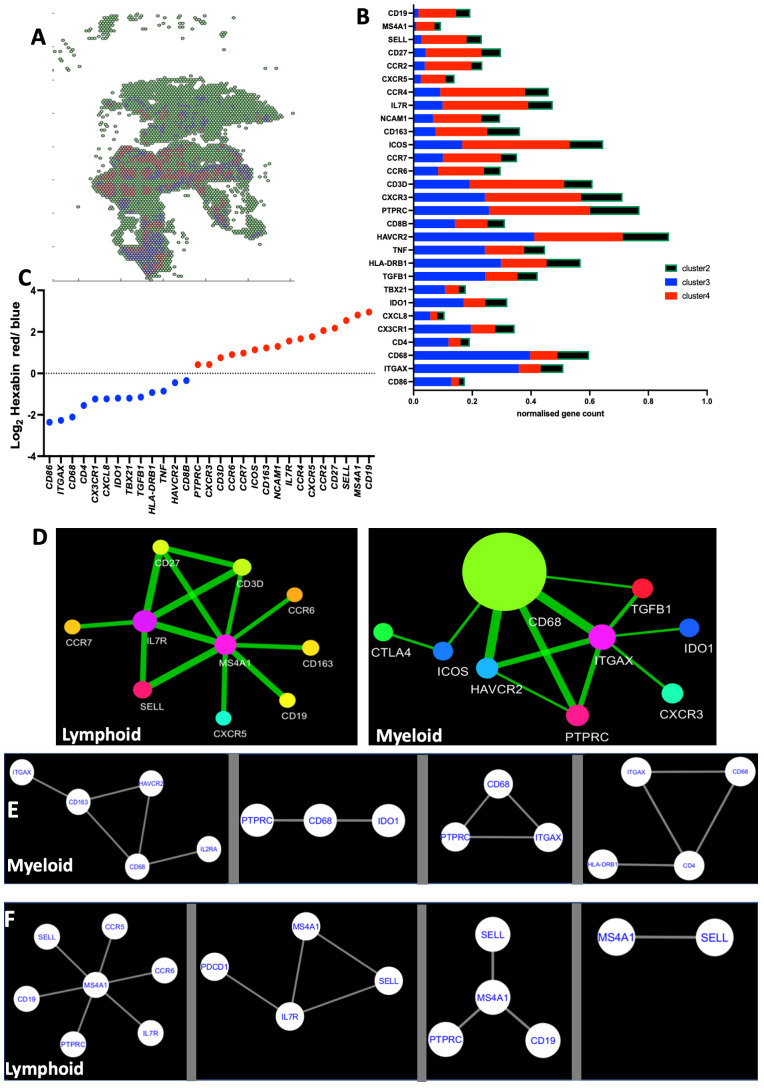
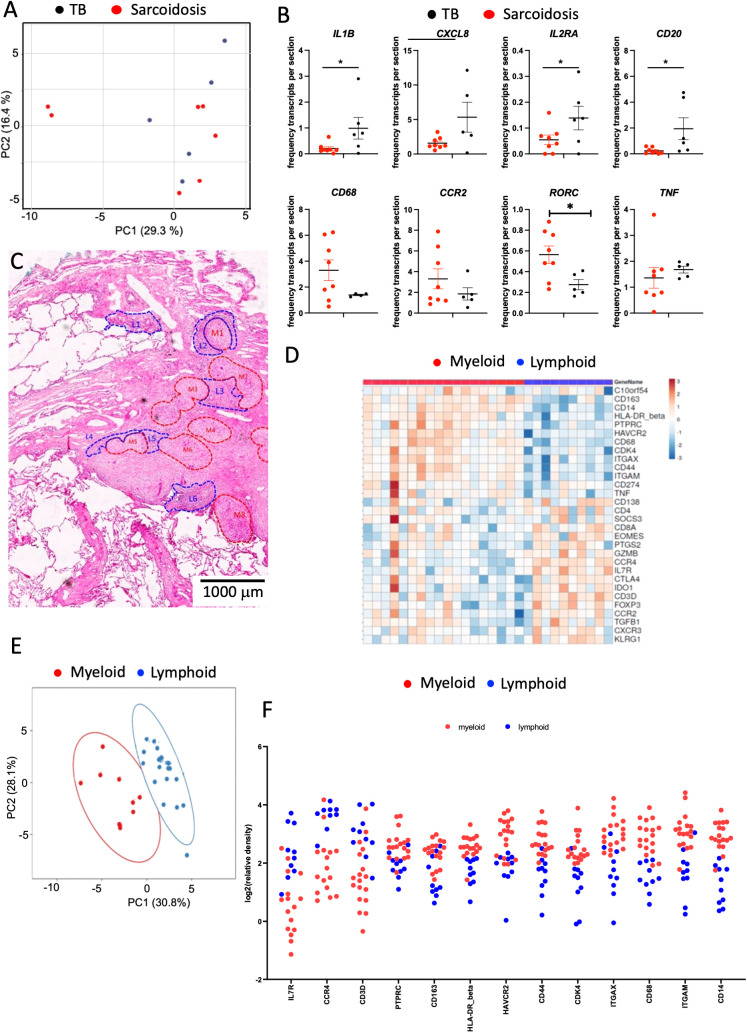
Tuberculosis (TB) and sarcoidosis are both granulomatous diseases. Here, we compared the immunological microenvironments of granulomas from TB and sarcoidosis patients using in situ sequencing (ISS) transcriptomic analysis and multiplexed immunolabeling of tissue sections. TB lesions consisted of large necrotic and cellular granulomas, whereas "multifocal" granulomas with macrophages or epitheloid cell core and a T-cell rim were observed in sarcoidosis samples. The necrotic core in TB lesions was surrounded by macrophages and encircled by a dense T-cell layer. Within the T-cell layer, compact B-cell aggregates were observed in most TB samples. These B-cell clusters were vascularized and could contain defined B-/T-cell and macrophage-rich areas. The ISS of 40-60 immune transcripts revealed the enriched expression of transcripts involved in homing or migration to lymph nodes, which formed networks at single-cell distances in lymphoid areas of the TB lesions. Instead, myeloid-annotated regions were enriched in CD68, CD14, ITGAM, ITGAX, and CD4 mRNA. CXCL8 and IL1B mRNA were observed in granulocytic areas in which M. tuberculosis was also detected. In line with ISS data indicating tertiary lymphoid structures, immune labeling of TB sections expressed markers of high endothelial venules, follicular dendritic cells, follicular helper T cells, and lymph-node homing receptors on T cells. Neither ISS nor immunolabeling showed evidence of tertiary lymphoid aggregates in sarcoidosis samples. Together, our finding suggests that despite their heterogeneity, the formation of tertiary immune structures is a common feature in granulomas from TB patients.

Keywords: granuloma; inducible bronchus associated lymphoid tissue; lung; sarcoidosis; spatial transcriptomics; tuberculosis.


Conflict of interest statement

The authors declare that the research was conducted in the absence of any commercial or financial relationships that could be construed as a potential conflict of interest. The author(s) declared that they were an editorial board member of Frontiers, at the time of submission. This had no impact on the peer review process and the final decision.

Figures

Figure 1
Figure 1
Histological and immune features of the pulmonary sarcoidosis granuloma. Representative HE-stained pulmonary sarcoidosis lesion containing multiple nodules of non-necrotizing granulomas in the lung interstitium (A). Multiplexed immunofluorescence labeling of CD68, CD3, CD20, UEA1, and DAPI on pulmonary lesions from four different sarcoidosis patients out of six analyzed (B-E). Note the scarce/moderate density of T cells surrounding the granuloma core and the presence of macrophages within the core (B-E). A small cluster of B cells can be observed in this lesion (E). Green arrows highlight UEA1 labeling (B-D).
Figure 2
Figure 2
Histological and immune populations in the pulmonary TB granuloma. Representative HE-stained pulmonary TB lesion, containing areas with large areas with severe lymphoid infiltrates and a core with myeloid cells (A). Multiplexed immunofluorescence labeling of CD68, CD3, CD20, UEA1, and DAPI on pulmonary lesions from four TB patients (B-H). Note the presence of a secondary granuloma (B), and a rim with high numbers of T cells interspersed with fewer B cells surrounding a macrophage core (C). Observe a non-necrotizing granuloma surrounded by a T-cell rim, which involves two B-cell clusters (D). A fragment of a necrotic granuloma in which macrophages edge the necrotic core and T cells and scattered B cells surround the macrophage layer is depicted (E). Compact B-cell clusters were present in most of the TB lesions observed (F-H). Several of these clusters were usually observed in the lesions (G). Some of these B-cell clusters form a defined structure, with T cells occupying defined regions within a vascularized structure (H), whereas in others the structure was less organized (F).
Figure 3
Figure 3
In situ sequencing localization of transcripts indicates a large cellular heterogeneity within a human TB lesion. Example of FFPE section of a human TB pulmonary lesion analyzed by ISS and stained for hematoxylin–eosin (HE) (A). The whole-scanned and HE-stained section is shown (A). Magnifications of histologically diverse areas (1–3) in which ISS raw transcript signals were plotted on HE images as background. Each dot represents one decoded sequence. A magnification of this area is shown to appreciate the histological differences. A region with abundance of ITGAM, ITGAX, CD14, and HLADR transcripts and eosin-rich myeloid areas is shown (area 1 in blue). A hematoxylin-dense lymphoid-rich area overlaps with the localization of M4SA1 transcripts whereas CD4 mRNA sparsely located around the B-cell cluster (area 2 in black). The area 3 (green) contains a region with neutrophils and apoptotic nuclei expressing CXCL8 and IL1B transcripts. The presence of M. tuberculosis bacteria stained by auramine–rhodamine in an area with granulocytic infiltrations and CXCL8 and IL1B expression from another region of the same sample is shown (B). The raw M4SA1, CXCR5, CD19, and CCR6 mRNA signals plotted on a DAPI image and localizing in the same areas of the granuloma are shown (C). The images derive from a different TB sample than that shown in panels (A, B).
Figure 4
Figure 4
Annotation of DAPI or HE areas differentiate myeloid and lymphoid transcript clusters in the human TB granuloma. Example of annotated regions of a section of human lung TB lesion. Areas were selected based on their density of DAPI (in green low density and in red high density). Decoded M4SA1 and CD68 sequences in the same area were plotted aligned with the HE staining and show the distinct localization of the transcripts in the annotated regions (A). A multivariate principal component analysis of signals shows proximity between the annotated areas from a TB lesion sharing histopathological features. The predictive ellipses displayed have a 90% probability that a new observation from the same group will fall inside the ellipse (B). Heat map analysis depicting the sequence density in the annotated areas. The relative density of each transcript in the annotated areas was normalized to the density of the transcript in the whole section. Transcripts showing less than 90% signals in the annotated regions were excluded. In the heat map, the log2 counts for each gene (row) is standardized to mean = 0, and the differences with the mean depicted. Each column represents an annotated region (C). The log2 relative density of transcripts in individual regions was calculated, and the mean density in the myeloid vs. the lymphoid areas is depicted. The violin plot of the log2 relative density of transcripts was defined as the density in the selected area in relation to the density of each transcript in the whole scanned section. Differences in transcript densities in myeloid and lymphoid regions are significant (*p ≤ 0.05, **p ≤ 0.01 and ***p ≤ 0.001, unpaired Student’s t test with correction for multiple comparisons and Welch correction for unequal variances) (D). The mean relative density of transcripts in lymphoid and myeloid regions in sections of pulmonary TB lesions from four different patients using SLig (E). The regions in each sample were annotated as described above, and the mean log2 relative density of each transcript for each TB sample was calculated and plotted together with those from other TB samples. Differences between frequency of signals in the myeloid are lymphoid regions are significant (unpaired Student’s t test with correction for multiple comparisons and Welch correction for unequal variances).
Figure 5
Figure 5
Unsupervised clustering of TB sections renders lymphoid and myeloid-rich areas. The tissue section plane was uniformly tiled into 200-pxls (70 μm) radius hexagons, and the density of the multiple sequences in each hexagon was aggregated by binning and is displayed into a 2D-hexbin map. The densities of the sequences were organized by clustering the hexagons into three different expression patterns (A). The mean centroid normalized transcript counts in each hexagon was compared for the different clusters. The color code used for the bars corresponds to that in the 2D-hexbin map. Note that the green clusters contained less counts for of all sequences (B). The mean centroid normalized sequence counts in each hexagon was compared for the clusters. The ratio of sequence densities in red vs. blue clusters from the same TB sample is depicted (C). The spatial co-expression relationships between transcripts in one single lymphoid and a single myeloid region of a TB sample were converted into network-based visualization using InsituNet (D). Nodes in the network represent unique transcripts, and node size is proportional to the number of transcript detections. Edges represent significant spatial co-expression between transcripts. InsituNet analyzed the co-occurrence of transcript detections within 30 pixels (10 μm). The more statistically significant the co-expression is, the greater the weight (thickness) of the edge in the network. The co-expressed transcripts at <10 μm in all the annotated myeloid (E) and lymphoid (F) regions in the lesions from individual TB samples are depicted. The panels shown are calculated from four different TB patients (E, F).
Figure 6
Figure 6
Immunolabeling of lymphoid tissue associated molecules in human TB lesions. Multiplexed tyramide amplification immunofluorescence labeling of formaldehyde fixed-paraffin-embedded lung sections from TB patients. Staining for CD3 and CD35 (A, B), CD20 and MECA79 (C, D), CD3 and ICOS (E), and CD62L, CD4, and CD8 (F) are shown. The sections from 3 different TB samples are shown.
Figure 7
Figure 7
Spatial transcriptomic analysis of sarcoidosis samples. The PCA of signals in TB and sarcoidosis sections shows a common transcript expression in the lesions from both groups of patients. Each dot represents one sample. (A). The mean fraction of specific transcripts within all transcript species analyzed by SLig in TB (n = 5) and sarcoidosis (n = 7) samples are depicted. Each dot represents one sample (B). Example of annotated regions on fragment of a section of lung sarcoidosis. Areas were selected based on their density of HE labeling (areas in red are more eosin-rich than those in blue). Differences are significant (*p ≤ 0.05 unpaired t test with Welch correction for unequal variances) (C). Heat map analysis depicting the sequence density in the annotated areas of the whole section from one sarcoidosis patient. Transcripts showing signals in less than 90% of the annotated regions were excluded. In the heat map, the log2 counts for each gene (row) are normalized (mean = 0), and the differences with the mean are depicted. Each column represents an annotated region (D). A multivariate PCA of signals shows proximity between those in annotated areas sharing histopathological features from a single sarcoidosis lesion. The predictive ellipses displayed have a 90% probability that a new observation from the same group will fall inside the ellipse (E). The log2 relative density of transcripts in individual regions and the mean density in the myeloid vs. the lymphoid rich areas of a single sarcoidosis sample is depicted (F). Transcripts that showed signals in less than 90% of the annotated regions were excluded. Differences in transcript densities in myeloid and lymphoid regions are significant (at p ≤ 0.001, unpaired Student’s t test with Welch correction for unequal variances) and the false discovery rate after multiple comparisons was considered) (F).

Similar articles

References

    1. WHO . Global tuberculosis report 2022. Geneva: World Health Organization; (2022).
    1. Furin J, Cox H, Pai M. Tuberculosis. Lancet (2019) 393:1642–56. doi: 10.1016/S0140-6736(19)30308-3 - DOI - PubMed
    1. Cohen SB, Gern BH, Delahaye JL, Adams KN, Plumlee CR, Winkler JK, et al. . Alveolar macrophages provide an early mycobacterium tuberculosis niche and initiate dissemination. Cell Host Microbe (2018) 24:439–446 e434. doi: 10.1016/j.chom.2018.08.001 - DOI - PMC - PubMed
    1. Russell DG, Cardona PJ, Kim MJ, Allain S, Altare F. Foamy macrophages and the progression of the human tuberculosis granuloma. Nat Immunol (2009) 10:943–8. doi: 10.1038/ni.1781 - DOI - PMC - PubMed
    1. Canetti G. Dynamic aspects of the pathology and bacteriology of tuberculous lesions. Am Rev Tuberc (1956) 74:13–21. doi: 10.1164/artpd.1956.74.2-2.13 - DOI - PubMed

Publication types

Grants and funding

The author(s) declare financial support was received for the research, authorship, and/or publication of this article. This study was supported by the Swedish Heart and Lung foundation 2021-23/20200697, the Swedish Research Council 2019-01691 and 2019-04725, the Swedish Institute for Internationalization of Research and Higher Education (STINT) 4-1796/2014, the Chinese Scholarship Council and the Karolinska Institutet. The BioMaterialBank North (BMB North) is supported by the German Centre for Lung Research (DZL) and member of popgen 2.0 network (P2N), which is supported by a grant from the German Ministry for Education and Research (grant number: 01EY1103). The funders played no role in the study design, in the collection and interpretation of the data, in writing or in the decision to submit the article for publication.