. 2024 Feb 11;20(4):1529-1546.
doi: 10.7150/ijbs.92267. eCollection 2024.

Malat1 regulates PMN-MDSC expansion and immunosuppression through p-STAT3 ubiquitination in sepsis

Affiliations

Malat1 regulates PMN-MDSC expansion and immunosuppression through p-STAT3 ubiquitination in sepsis

Yaodong Wang et al. Int J Biol Sci. .

Abstract

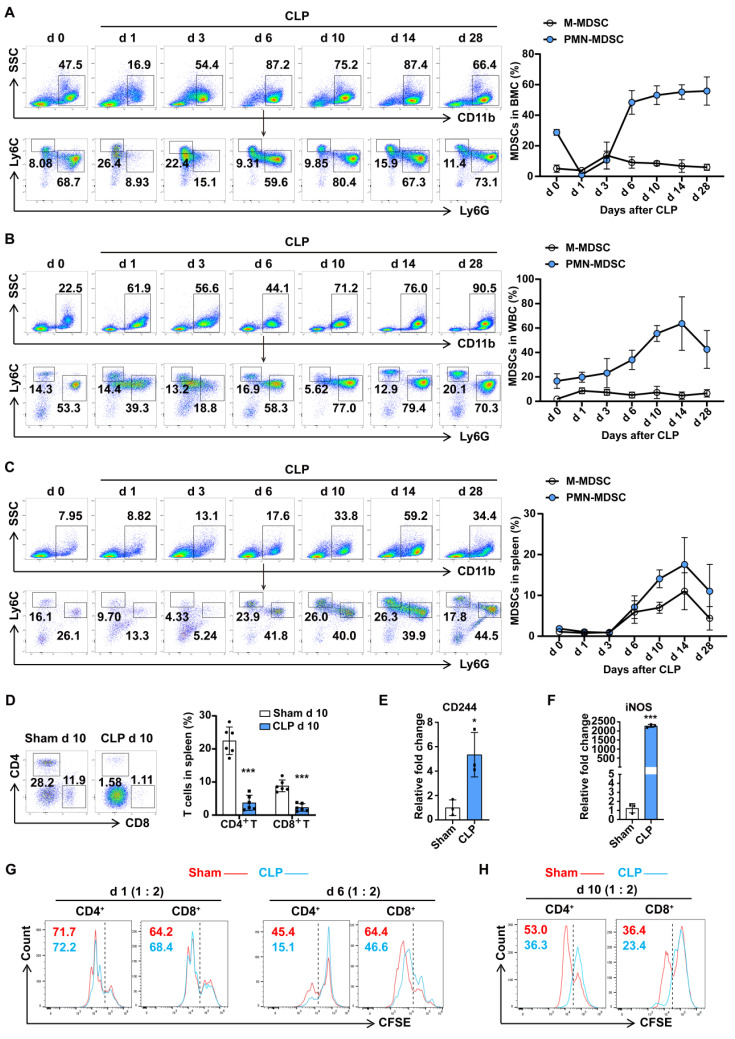
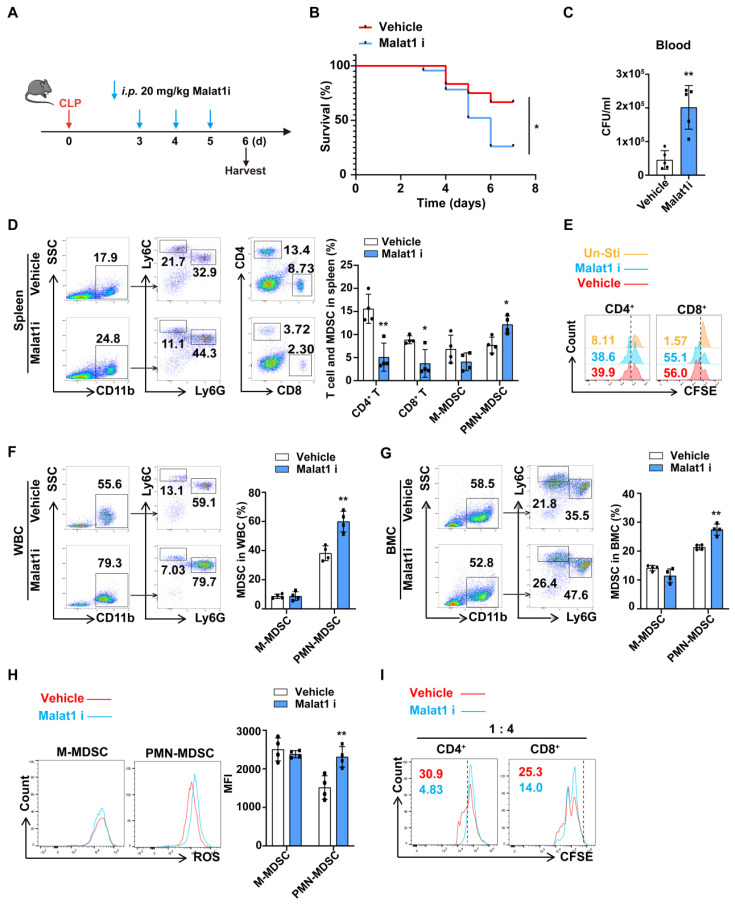
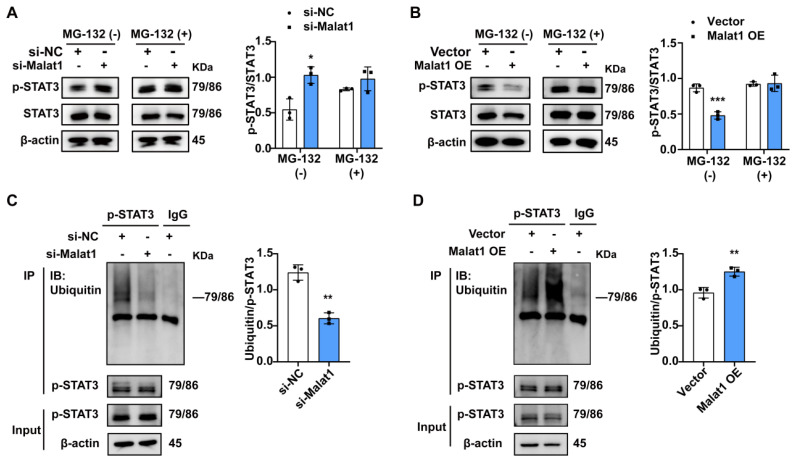
Myeloid-derived suppressor cells (MDSCs) expand during sepsis and contribute to the development of persistent inflammation-immunosuppression-catabolism syndrome. However, the underlying mechanism remains unclear. Exploring the mechanisms of MDSCs generation may provide therapeutic targets for improving immune status in sepsis. Here, a sepsis mouse model is established by cecal ligation and perforation. Bone marrow cells at different sepsis time points are harvested to detect the proportion of MDSCs and search for differentially expressed genes by RNA-sequence. In lethal models of sepsis, polymorphonuclear-MDSCs (PMN-MDSCs) decrease in early but increase and become activated in late sepsis, which is contrary to the expression of metastasis-associated lung adenocarcinoma transcript 1 (Malat1). In vivo, Malat1 inhibitor significantly increases the mortality in mice with late sepsis. And in vitro, Malat1 down-regulation increases the proportion of PMN-MDSCs and enhanced its immunosuppressive ability. Mechanistically, Malat1 limits the differentiation of PMN-MDSCs by accelerating the degradation of phosphorylated STAT3. Furthermore, Stattic, an inhibitor of STAT3 phosphorylation, improves the survival of septic mice by inhibiting PMN-MDSCs. Overall, the study identifies a novel insight into the mechanism of sepsis-induced MDSCs and provides more evidence for targeting MDSCs in the treatment of sepsis.

Keywords: Experimental sepsis; Malat1; Polymorphonuclear myeloid-derived suppressor cell; STAT3 pathway; Ubiquitination.


Conflict of interest statement

Competing Interests: The authors have declared that no competing interest exists.

Figures

Figure 1
Figure 1
PMN-MDSC expand and persist in the late stage of sepsis. (A-C) PMN-MDSCs and M-MDSCs in BMCs, WBCs, and spleen were quantified by flow cytometry. Representative flow cytometry plots and the statistical graph show the percentages on days 0, 1, 3, 6, 10, 14, 28 post-CLP. n=6. (D) Splenocytes were isolated from sham and CLP day 10 mice, and MDSCs, CD4+ T cells, and CD8+ T cells were detected by flow cytometry. Representative dot plots and the statistical graph show the percentage of MDSC subsets and T cells in the spleen on day 10 post-CLP. n=6. (E-F) RT-qPCR analysis of CD244 and iNOS expression in CD11b+Ly6G+ cells derived from BMCs of sham and CLP mice on day 6. n=3, each sample was a mixture of 3 mice. (G) Splenocytes were isolated from healthy control mice and labeled with the fluorescent dye CFSE. CD11b+Ly6G+ cells isolated from BMCs of sham and CLP mice on days 1 and 6 were co-cultured with splenocytes in a ratio of 1:2 for 3 days. T cell proliferation was determined by the stepwise dilution of CFSE dye in dividing T cells using flow cytometry. Representative flow cytometry plots of CFSE-positive and low-positive T cells gated on CD4 and CD8 are shown. (H) CD11b+Ly6G+ cells were isolated from the spleen of sham and CLP mice on day 10 and co-cultured with CFSE-labeled splenocytes (1:4 ratio) for 3 days. T cell proliferation was detected by flow cytometry. Data are presented as means ± SEM. *p < 0.05, **p < 0.01, ***p < 0.001.
Figure 2
Figure 2
Malat1 is downregulated in the late stage of sepsis with enhanced STAT3 phosphorylation. (A) BMCs were isolated from healthy controls, CLP day 1 mice, and CLP day 6 mice. The clustered heatmap showed the top 19 differentially expressed lncRNAs. n = 2, each sample was a mixture of 3-4 mice. (B) RT-qPCR analysis of Malat1 expression in BMCs of sham and CLP mice. n=3-7. (C) RT-qPCR analysis of Malat1 expression in WBCs of sham and CLP mice. n = 5, each sample was a mixture of 2 mice. (D) RT-qPCR analysis of Malat1 expression in PMN-MDSCs of sham and CLP mice on day 6. n = 4, each sample was a mixture of 3 mice. (E) Fresh BMCs were isolated and cultured with GM-CSF plus IL-6 in vitro. RT-qPCR analysis of Malat1, Arg-1, and iNOS expression in induced BMCs. (F) STAT3 protein phosphorylation assessment on days 1, 3, and 6 in BMCs of sham and CLP mice (Top) and quantification analysis (Bottom). n=3. (G) p-STAT3, SOCS3, Arg-1, and iNOS protein expression in BMCs after GM-CSF and IL-6 induction (Top) and quantification analysis (Bottom). Data are presented as means ± SEM. *p < 0.05, **p < 0.01, ***p < 0.001.
Figure 3
Figure 3
Malat1 inhibitor aggravated the severity of sepsis by promoting PMN-MDSCs expansion. (A-F) Injection of Malat1 inhibitor in CLP mice. (A) Schematic illustration of administration protocol. (B) 7-day survival curves of CLP mice treated with Malat1i (n = 24) or Vehicle (n = 12). (C) Results of bacterial counts in whole blood are expressed as CFU per mL of blood. n=5. (D) Representative flow cytometry plots (Left) and the statistical graph (Right) show the percentage of MDSCs and T cells in spleen. n=4. (E) CFSE-labeled splenocytes were treated with vehicle or 5 μM Malalt1 inhibitor. T cell proliferation was detected by flow cytometry. (F) Representative flow cytometry plots (Left) and the statistical graph (Right) show the percentage of MDSCs in circulation. (G-I) Induced MDSC were treated with Malat1 inhibitor for 3 days. (G) Representative flow cytometry plots (Left) and the statistical graph (Right) show the percentage of MDSCs in BMC. (H) Production of ROS in MDSCs was detected by flow cytometry. (I) T cell proliferation was detected by flow cytometry. Data presented as means ± SEM. *p < 0.05, **p < 0.01.
Figure 4
Figure 4
Malat1 inhibits the expansion and immunosuppressive function of PMN-MDSC by reducing STAT3 phosphorylation. (A-C) Fresh BMCs were transfected with Malat1-specific or scramble siRNA and ASO for 36 h and then treated with GM-CSF and IL-6 for another 36 h. (A) RT-qPCR analysis of Malat1 expression in BMCs at the first 36 h after transfection. (B) Representative dot plots and the statistical graph show the percentages of MDSC subsets after Malat1 knockdown. (C) STAT3 protein phosphorylation assessment in BMCs after Malat1 knockdown (Left) and quantification analysis (Right). (D-F) Fresh BMCs were transfected with Malat1 expression plasmid or empty control vector for 36 h and then treated with GM-CSF and IL-6 for another 36 h. (D) RT-qPCR analysis of Malat1 expression in BMCs at the first 36 h after transfection. (E) Representative dot plots and the statistical graph show the percentage of MDSC subsets after Malat1 overexpression. (F) STAT3 protein phosphorylation assessment in BMCs after Malat1 overexpression (Left) and quantification analysis (Right). (G) BMCs with Malat1 knockdown were treated with GM-CSF and IL-6 in the presence of Stattic or DMSO for 36 h. Representative dot plots (Top) and the statistical graph (Bottom) show the percentage of PMN-MDSCs. (H) BMCs were treated with 5 μM Stattic or an equal concentration of vehicle for 24 h after Malat1 knockdown, protein expressions were evaluated. (I) PMN-MDSCs with or without Malat1 knockdown were co-cultured with CFSE-labeled splenocytes (1:4 ratio) for 3 days. T cell proliferation was detected by flow cytometry. (J) PMN-MDSCs with or without Malat1 overexpression were co-cultured with CFSE-labeled splenocytes (1:4 ratio) for 3 days. T cell proliferation was detected by flow cytometry. Data are presented as means ± SEM. *p < 0.05, **p < 0.01.
Figure 5
Figure 5
Malat1 attenuates the level of p-STAT3 protein by promoting its ubiquitination degradation. (A) Induced PMN-MDSCs with Malat1 knockdown were cultured in the presence or absence of MG132 for 4 h and then subjected to immunoblotting analysis with a p-STAT3 antibody (Left). The statistical graph (Right) shows the quantification analysis. (B) Induced PMN-MDSCs with Malat1 overexpression were cultured in the presence or absence of MG132 for 4 h and then subjected to immunoblotting analysis with a p-STAT3 antibody (Left). The statistical graph (Right) shows the quantification analysis. (C) Ubiquitin level assessment (Left) by western blotting after immunoprecipitation with p-STAT3 or IgG antibody in NC- or Malat1 knockdown PMN-MDSCs. The statistical graph (Right) shows the level of ubiquitination on p-STAT3 protein after Malat1 knockdown. (D) Ubiquitin level assessment by western blotting after immunoprecipitation with p-STAT3 or IgG antibody in empty vector or Malat1 overexpression PMN-MDSCs. The statistical graph (Right) shows the level of p-STAT3 protein ubiquitination after Malat1 overexpression. Data are presented as means ± SEM. *p < 0.05, **p < 0.01, ***p < 0.001.
Figure 6
Figure 6
Stattic improves survival in late sepsis by inhibiting the expansion and function of PMN-MDSCs. (A, B) After 48 h of MDSC induction in vitro, Stattic or DMSO was added to the medium for another 24 h. (A) Representative flow cytometry plots (Left) and the statistical graph (Right) show the percentage of PMN-MDSCs in BMCs after inhibiting the STAT3 pathway. (B) p-STAT3 protein levels in BMCs (Left) after inhibiting the STAT3 pathway and quantification analysis (Right). (C) Induced PMN-MDSCs were treated with or without Stattic for 6 h, and then were co-cultured with CFSE-labeled splenocytes (1:4 ratio) for 3 days. T cell proliferation was detected by flow cytometry. (D) Schematic illustration of administration protocol in septic mice. (E) STAT3 protein phosphorylation assessment (Left) in BMCs of CLP day 6 mice and quantification analysis (Right). n=3. (F) Representative flow cytometry plots (Left) and the statistical graph (Right) show the percentage of PMN-MDSCs and M-MDSCs in BMCs of CLP mice after inhibiting the STAT3 pathway. n=3. (G) Schematic illustration of administration protocol in septic mice. (H) Representative flow cytometry plots (Left) and the statistical graph (Right) show the percentage of MDSCs and T cells in the spleen of CLP mice after inhibiting the STAT3 pathway. n=3. (I) CLP mice were injected with or without Stattic on day 12, and concentrations of IL-6 and IL-10 in plasma were detected by Elisa. n=3. (J) Fourteen-day survival curves of CLP mice treated with Stattic (n = 16) or DMSO (n = 15) starting before CLP (Left). 14-day survival curves of CLP mice treated with Stattic or DMSO. Starting on day 4 after CLP (Right). n=9. Data are presented as means ± SEM. *p < 0.05, **p < 0.01, ***p < 0.001.

Similar articles

Cited by

References

    1. Singer M, Deutschman CS, Seymour CW. et al. The Third International Consensus Definitions for Sepsis and Septic Shock (Sepsis-3) JAMA. 2016;315(8):801–10. - PMC - PubMed
    1. Xie J, Wang H, Kang Y. et al. The Epidemiology of Sepsis in Chinese ICUs: A National Cross-Sectional Survey. Crit Care Med. 2020;48(3):E209–E218. - PubMed
    1. Van Der Poll T, Van De Veerdonk FL, Scicluna BP, Netea MG. The immunopathology of sepsis and potential therapeutic targets. Nat Rev Immunol. 2017;17(7):407–420. - PubMed
    1. Hollen MK, Stortz JA, Darden D. et al. Myeloid-derived suppressor cell function and epigenetic expression evolves over time after surgical sepsis. Crit Care. 2019;23(1):355. - PMC - PubMed
    1. Horiguchi H, Loftus TJ, Hawkins RB, Innate immunity in the persistent inflammation, immunosuppression, and catabolism syndrome and its implications for therapy. Front Immunol. 2018. 9(: 595. - PMC - PubMed

Substances