. 2024 Jan 27;20(4):1256-1278.
doi: 10.7150/ijbs.85585. eCollection 2024.

Sirtuin 4 (Sirt4) downregulation contributes to chondrocyte senescence and osteoarthritis via mediating mitochondrial dysfunction

Affiliations

Sirtuin 4 (Sirt4) downregulation contributes to chondrocyte senescence and osteoarthritis via mediating mitochondrial dysfunction

Shiyuan Lin et al. Int J Biol Sci. .

Abstract

Chondrocyte senescence has recently been proposed as a key pathogenic mechanism in the etiology of osteoarthritis (OA). Nevertheless, the precise molecular mechanisms underlying chondrocyte senescence remain poorly understood. To address this knowledge gap, we conducted an investigation into the involvement of Sirtuin 4 (Sirt4) in chondrocyte senescence. Our experimental findings revealed a downregulation of Sirt4 expression in TBHP-induced senescent chondrocytes in vitro, as well as in mouse OA cartilage. Additionally, we observed that the knockdown of Sirt4 in chondrocytes promoted cellular senescence and cartilage degradation, while the overexpression of Sirt4 protected the cells against TBHP-mediated senescence of chondrocytes and cartilage degradation. Moreover, our findings revealed elevated levels of reactive oxygen species (ROS), abnormal mitochondrial morphology, compromised mitochondrial membrane potential, and reduced ATP production in Sirt4 knockdown chondrocytes, indicative of mitochondrial dysfunction. Conversely, Sirt4 overexpression successfully mitigated TBHP-induced mitochondrial dysfunction. Further analysis revealed that Sirt4 downregulation impaired the cellular capacity to eliminate damaged mitochondria by inhibiting Pink1 in chondrocytes, thereby enhancing the accumulation of ROS and facilitating chondrocyte senescence. Notably, the overexpression of Pink1 counteracted the effects of Sirt4 knockdown on mitochondrial dysfunction. Importantly, our study demonstrated the promise of gene therapy employing a lentiviral vector encoding mouse Sirt4, as it successfully preserved the integrity of articular cartilage in mouse models of OA. In conclusion, our findings provide compelling evidence that the overexpression of Sirt4 enhances mitophagy, restores mitochondrial function, and protects against chondrocyte senescence, thereby offering a novel therapeutic target and potential strategy for the treatment of OA.

Keywords: Mitochondria; Osteoarthritis; Reactive oxygen species; Senescence; Sirt4.


Conflict of interest statement

Competing Interests: The authors have declared that no competing interest exists.

Figures
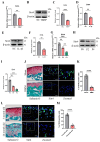
Figure 1
Figure 1
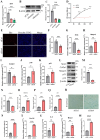
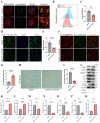
Sirt4 is down-regulated in OA chondrocytes and cartilage tissue affected by OA. (A-C) RT-qPCR and western blotting analysis of Sirt4 mRNA and protein expression level in primary mouse chondrocytes treated with and without 10 ng/mL IL-1β for 48h. Band intensity relative to β-actin. n = 3, **p < 0.01. (D-F) RT-qPCR and western blotting analysis of Sirt4 mRNA and protein expression level in primary mouse chondrocytes treated with and without 50 μM TBHP for 48h. Band intensity relative to β-actin. n = 3, **p < 0.01, ***p < 0.001. (G-I) RT-qPCR and western blotting analysis of Sirt4 mRNA and protein expression level during passaging of primary mouse chondrocytes. Band intensity relative to β-actin. n = 3, **p < 0.01, ***p < 0.001. (J, K) Safranin O staining of cartilage sections and immunofluorescence of Sirt4 from control (sham) and posttraumatic OA cartilage (8 weeks after DMM) of mice. The Sirt4-positive cells were quantified. n = 6, ****p < 0.0001, Scale bars: 50μm. (L, M) Safranin O staining of cartilage sections and immunofluorescence of Sirt4 from 3- and 24-month-old mice. The Sirt4-positive cells were quantified. n = 6, ****p < 0.0001, Scale bars: 50μm.
Figure 2
Figure 2
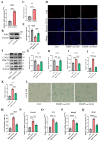
Sirt4 knockdown induces chondrocyte senescence and cartilage degradation. (A) Relative mRNA expression level of Sirt4 in primary mouse chondrocytes transfected with siRNA targeting Sirt4 (siSirt4) compared to negative control siRNA (siCtrl). β-actin was used as normalization control. n = 3, ****p < 0.0001. (B, C) Western blotting analysis of Sirt4 protein expression level in primary mouse chondrocytes transfected with siSirt4 compared to siCtrl. Band intensity relative to β-actin. n = 3, ****p < 0.0001. (D) CCK-8 assay was used to determinate the proliferative capacities of primary mouse chondrocytes transfected with siSirt4 compared to siCtrl. n=5, ****p < 0.0001. (E, F) Representative EdU staining images of primary mouse chondrocytes indicated a decrease in cell proliferation in Sirt4 knockdown group. DAPI staining was performed to visualize all nuclei of the cells tested. The bar graph shows quantification (%) of the EdU-positive cell population. n = 5, ****p < 0.0001. Scale bars: 100 μm. (G-K) RT-qPCR analysis was used to determinate the mRNA expression levels of Sirt4, Mmp13, Col2a1, p16 and p21 in primary mouse chondrocytes transfected with siSirt4 compared to siCtrl. β-actin was used as normalization control. n = 3, *p < 0.05, **p < 0.01, ***p < 0.001. (L-Q) Western blotting analysis was used to determinate the protein expression levels of Sirt4, Mmp13, Col2a1, p16 and p21 in primary mouse chondrocytes transfected with siSirt4 or siCtrl. Band intensity relative to β-actin. n = 3, **p < 0.01, ***p < 0.001, ****p < 0.0001. (R, S) SA-β-Gal staining and quantification of SA-β-Gal positivity in primary chondrocytes transfected with siSirt4 or siCtrl. The SA-β-gal positive cells were quantified using ImageJ. n = 5, ****p < 0.0001. Scale bars: 50 μm. (T-W) RT-qPCR analysis was used to determinate the mRNA expression levels of Cxcl10, IL-6, Mmp3 and Mcp1 in primary mouse chondrocytes transfected with siSirt4 or siCtrl. β-actin was used as normalization control. n = 3, **p < 0.01, ****p < 0.0001.
Figure 3
Figure 3
Sirt4 overexpression attenuates TBHP-induced chondrocyte senescence and cartilage degradation. (A) Relative mRNA expression level of Sirt4 in primary mouse chondrocytes transfected with plasmid encoding Sirt4 (oe-Sirt4) or plasmid control with no insert (oe-Ctrl). β-actin was used as normalization control. n = 3, ***p < 0.001. (B, C) Western blotting analysis of Sirt4 protein level in primary mouse chondrocytes transfected with oe-Sirt4 plasmid or oe-Ctrl plasmid. Band intensity relative to β-actin. n = 3, ****p < 0.0001 (D, E) Primary mouse chondrocytes were transfected with oe-Ctrl plasmid or oe-Sirt4 plasmid and treated or untreated with TBHP (50 μM). Representative EdU staining images of primary mouse chondrocytes indicated proliferation cells. DAPI staining was performed to visualize all nuclei of the cells tested. The bar graph shows quantification (%) of the EdU-positive cell population. n = 5, ***p < 0.001, ****p < 0.0001. Scale bars: 100 μm. (F-K) Protein levels of Sirt4, Col2a1, Mmp13 and the senescence-related markers were analyzed in primary mouse chondrocytes using western blotting. Band intensity relative to β-actin. n = 3, **p < 0.01, ***p < 0.001, ****p < 0.0001. (L, M) Representative SA-β-gal (green fluorescence) staining images of primary mouse chondrocytes indicated senescent cells. The bar graph shows quantification (%) of the SA-β-gal positive cell population. n = 5, ****p < 0.0001. Scale bars: 50 μm. (N-Q) RT-qPCR analysis was used to determinate the mRNA expression levels of Cxcl10, Il-6, Mmp3 and Mcp1 in primary mouse chondrocytes transfected with oe-Ctrl plasmid or oe-Sirt4 plasmid and treated or untreated with TBHP (50 μM). β-actin was used as normalization control. n = 3, *p < 0.05, **p < 0.01, ***p < 0.001, ****p < 0.0001.
Figure 4
Figure 4
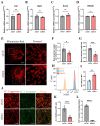
Sirt4 knockdown increases ROS production in chondrocytes. (A, B) Flow cytometer analysis of DHE fluorescence measuring levels of intracellular O2•- in primary mouse chondrocytes transfected with siSirt4 or siCtrl. The bar graph shows the fluorescence intensity of the DHE. n = 3, **p < 0.01. (C, D) Confocal imaging analysis of CM-H2DCFDA fluorescence measuring levels of intracellular ROS in primary mouse chondrocytes transfected with siSirt4 or siCtrl. The bar graph shows the fluorescence intensity of the CM-H2DCFDA. n = 5, ****p < 0.0001, Scale bars: 20 μm. (E, F) Confocal imaging analysis of MitoSOX fluorescence measuring levels of mitochondrial ROS in primary mouse chondrocytes transfected with siSirt4 or siCtrl. The bar graph shows the fluorescence intensity of the MitoSOX. n = 5, ****p < 0.0001, Scale bars: 20 μm. (G, H) Immunofluorescence staining of γ-H2AX and fluorescence intensity of γ-H2AX in chondrocytes pretreated with 1 mM NAC for 1 h prior to transfection with siSirt4 for 48h. n = 5, ****p < 0.0001, Scale bars: 20 μm. (I, J) Representative SA-β-gal (green fluorescence) staining images of chondrocytes pretreated with 1 mM NAC for 1 h prior to transfection with siSirt4 for 48h. The bar graph shows quantification (%) of the SA-β-gal positive cell population. n = 5, ****p < 0.0001, Scale bars: 50 μm.
Figure 5
Figure 5
Sirt4 knockdown leads to mitochondrial dysfunction in chondrocytes. (A-D) RT-qPCR analysis was used to determinate the mRNA expression levels of Cat, Gpx1, Sod2 and Nfe2l2 in primary mouse chondrocytes transfected with siSirt4 or siCtrl. β-actin was used as normalization control. n = 3. (E) Mitochondrial network was analyzed by MitoTracker staining in primary mouse chondrocytes transfected with siSirt4 or siCtrl. The inset in the images is shown as magnified images in the right row. Scale bars: 5 μm. (F) The MINA plug-in in ImageJ was used to analyze the mean branches number per network of mitochondria in primary mouse chondrocytes. n = 5, *p < 0.05. (G) The MINA plug-in in ImageJ was used to analyze the mean branches length of mitochondria in primary mouse chondrocytes. n = 5, ***p < 0.001. (H) NAO was used to determine the total mitochondria mass in chondrocytes transfected with siSirt4 or siCtrl by flow cytometry. (I) Relative mean fluorescence intensity of NAO in chondrocytes transfected with siSirt4 or siCtrl. n = 3, ****p < 0.0001. (J) JC-1 was used to detect the mitochondrial membrane potential in primary mouse chondrocytes transfected with siSirt4 or siCtrl. Scale bars: 50 μm. (K) Relative mean fluorescence intensity of Red to Green in primary mouse chondrocytes transfected with siSirt4 or siCtrl. n = 5, ****p < 0.0001. (L) ATP content in primary mouse chondrocytes transfected with siSirt4 or siCtrl. n = 3, ****p < 0.0001.
Figure 6
Figure 6
Sirt4 overexpression attenuates TBHP-induced mitochondrial dysfunction in chondrocytes. (A) Mitochondrial network was analyzed by MitoTracker staining in primary mouse chondrocytes transfected with oe-Sirt4 or oe-Ctrl plasmid and treated or untreated with TBHP (50 μM). The inset in the images is shown as magnified images in the bottom row. Scale bars: 5 μm. (B) The MINA plug-in in Image J was used for statistical analysis of mitochondrial morphology in Figure (A), and the mean branches number per network of mitochondria in primary mouse chondrocytes was obtained. n = 5, **p < 0.01, ***p < 0.001. (C) The MINA plug-in in Image J was used for statistical analysis of mitochondrial morphology in Figure (A), and the mean mitochondrial branch length in primary mouse chondrocytes was obtained through analysis. n = 5, **p < 0.01, ****p < 0.0001. (D) NAO was used to determine the total mitochondria quantity in chondrocytes transfected with oe-Sirt4 or oe-Ctrl and treated or untreated with TBHP by flow cytometry. (E) Relative mean fluorescence intensity of NAO in chondrocytes transfected with oe-Sirt4 or oe-Ctrl plasmid and treated or untreated with TBHP. n = 3, **p < 0.01, ***p < 0.001. (F) JC-1 was used to detect the mitochondrial membrane potential of primary mouse chondrocytes transfected with oe-Sirt4 or oe-Ctrl plasmid and treated or untreated with TBHP. Scale bars: 25 μm. (G) Relative mean fluorescence intensity of Red to Green in chondrocytes. n = 5, ****p < 0.0001. (H) ATP content of primary mouse chondrocytes transfected with oe-Sirt4 or oe-Ctrl plasmid and treated or untreated with TBHP. n = 3, **p < 0.01, ***p < 0.001.
Figure 7
Figure 7
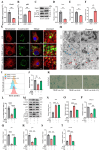
Sirt4 overexpression attenuates ROS-mediated senescence of chondrocytes and cartilage degradation via enhancing mitophagy. (A, B) Relative mRNA expression level of Pink1 and p62 in primary mouse chondrocytes transfected with siSirt4 compared to siCtrl. β-actin was used as normalization control. n = 3, **p < 0.01. (C-F) Western blotting analysis of the protein expression level of Pink1, LC3 and p62 in primary mouse chondrocytes transfected with siSirt4 compared to siCtrl. Band intensity relative to β-actin. n = 3, **p < 0.01, ***p < 0.001. (G) Primary mouse chondrocytes were transfected with oe-Ctrl plasmid or oe-Sirt4 plasmid. The cells were subsequently cultured for 2 days with or without TBHP (50 μM). The chondrocytes were stained with MitoTracker Red (100 nM, 30 min) and LysoTracker Green (75 nM, 30 min) to label the mitochondria and lysosomes, respectively. The co-localization of mitochondria and lysosomes was detected by laser scanning confocal microscopy. The inset box in the images is shown as magnified images in the rightmost row. Scale bar = 5 μm. (H) Primary mouse chondrocytes were transfected with oe-Ctrl plasmid or oe-Sirt4 plasmid. The cells were subsequently cultured for 2 days with or without TBHP (50 μM). The mitochondrial morphology of each group was analyzed by transmission electron microscope (TEM). The blue arrow represents impaired mitochondria and the red arrow represents mitophagy or autophagolysosome. The inset box in the images is shown as magnified images in the right row. Scale bar: 10 μm. (I, J) The chondrocytes were pretreated with CQ, followed by treatment with TBHP and with or without transfection with oe-Sirt4 plasmid. Flow cytometer analysis of DHE fluorescence measuring levels of intracellular O2•- in primary mouse chondrocytes of different treatment groups. The bar graph shows the fluorescence intensity of the DHE. n = 3, *p < 0.05, **p < 0.01. (K, L) The chondrocytes were pretreated with CQ, followed by treatment with TBHP and with or without transfection with oe-Sirt4 plasmid. SA-β-Gal staining and quantification of SA-β-Gal positivity in primary mouse chondrocytes of different treatment groups. n = 5, ****p < 0.0001. Scale bars: 50 μm. (M-T) The chondrocytes were pretreated with CQ, followed by treatment with TBHP and with or without transfection with oe-Sirt4 plasmid. Protein levels of Sirt4, Col2a1, Mmp13, p16, p21, p62 and LC3-II were analyzed in primary mouse chondrocytes of different treatment groups. Band intensity relative to β-actin. n = 3, **p < 0.05, ***p < 0.001, ****p < 0.0001.
Figure 8
Figure 8
Sirt4 mediates mitophagy via Pink1 in chondrocytes. (A) Double-labeled fluorescence staining by LysoTracker Green (75 nM, 30 min) and MitoTracker Deep Red (100 nM, 30 min) dye in chondrocytes transfected with siSirt4 and with or without oe-Pink1 plasmid. The inset box in the images is shown as magnified images in the right row. Scale bar: 5 μm. (B, C) Flow cytometer analysis of DHE fluorescence measuring levels of intracellular O2•- in primary mouse chondrocytes transfected with siSirt4 and with or without oe-Pink1 plasmid. The bar graph shows the fluorescence intensity of the DHE. n = 4, **p < 0.01. (D, E) Confocal imaging analysis of CM-H2DCFDA fluorescence measuring levels of intracellular H2O2 in primary mouse chondrocytes transfected with siSirt4 and with or without oe-Pink1 plasmid. The bar graph shows the fluorescence intensity of the CM-H2DCFDA. n = 5, ****p < 0.0001, Scale bars: 50 μm. (F) JC-1 was used to detect the mitochondrial membrane potential of primary mouse chondrocytes transfected with siSirt4 and with or without oe-Pink1 plasmid. Scale bars: 50 μm. (G) Relative mean fluorescence intensity of Red to Green. n = 5, ****p < 0.0001. (H, I) SA-β-Gal staining and quantification of SA-β-Gal positivity in primary mouse chondrocytes transfected with siSirt4 and with or without oe-Pink1 plasmid. n = 5, ****p < 0.0001. Scale bars: 50 μm. (J-Q) Protein levels of Pink1, Col2a1, Mmp13, P16, P21, P62 and Lc3-II were analyzed in primary mouse chondrocytes transfected with siSirt4 and with or without oe-Pink1 plasmid using western blotting. Band intensity relative to β-actin. n = 3, *p < 0.05, ***p < 0.001, ****p < 0.0001.
Figure 9
Figure 9
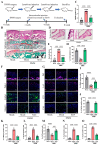
Gene therapy with a lentiviral vector encoding Sirt4 in a mouse model for OA. (A) Schematic of the time course used for the DMM-induced in vivo OA experiments. (B) H&E staining was performed to observe the cell morphology and tissue integrity in the articular cartilage tissues of the mouse knee undergoing sham or DMM surgery. Likewise, the middle and bottom figures show Safranin O and fast green staining of articular cartilage tissues from mice that underwent sham or DMM surgery is indicated. Safranin O and fast green staining demonstrated OA progression through the 8-week time course in the medial tibial plateau. Scale bar: 50μm or 200μm (middle figure). (C) OARSI scores of the medial tibial plateau of sham or DMM mice. Data are expressed as means, and the error bars indicate the standard deviation. n = 6, ****p < 0.0001. (D, E) The representative images and scores of synovitis of mice that underwent sham or DMM surgery. n = 6, ***p < 0.001, ****p < 0.0001. (F-G) Representative images for Sirt4, Pink1, Col2a1, Mmp13, p21, p16, p62 and Lc3 immunofluorescent staining in cartilage tissues obtained from sham or DMM mouse knees. Scale bar: 50 μm. (H-O) The bar graphs show quantification (%) of the Sirt4, Pink1, Col2a1, Mmp13, p21, p16, p62 and Lc3-positive cells from total cell population per field in immunofluorescent staining sections. n = 6, **p < 0.01, ***p < 0.001, ****p < 0.0001.
Figure 10
Figure 10
Schematic representation of mechanisms by which Sirt4 mediates chondrocyte senescence and OA development.

Similar articles

Cited by

References

    1. Sharma L. Osteoarthritis of the Knee. N Engl J Med. 2021;384(1):51–59. - PubMed
    1. Zhao X, Shah D, Gandhi K. et al. Clinical, humanistic, and economic burden of osteoarthritis among noninstitutionalized adults in the United States. Osteoarthritis Cartilage. 2019;27(11):1618–1626. - PubMed
    1. Yue L, Berman J. What Is Osteoarthritis? Jama. 2022;327(13):1300. - PubMed
    1. Loeser RF, Goldring SR, Scanzello CR, Goldring MB. Osteoarthritis: a disease of the joint as an organ. Arthritis Rheum. 2012;64(6):1697–1707. - PMC - PubMed
    1. Liu Q, Wang S, Lin J, Zhang Y. The burden for knee osteoarthritis among Chinese elderly: estimates from a nationally representative study. Osteoarthritis Cartilage. 2018;26(12):1636–1642. - PubMed