. 2024 Mar;33(3):e4930.
doi: 10.1002/pro.4930.

Structural insights into peptidoglycan glycosidase EtgA binding to the inner rod protein EscI of the type III secretion system via a designed EscI-EtgA fusion protein

Affiliations

Structural insights into peptidoglycan glycosidase EtgA binding to the inner rod protein EscI of the type III secretion system via a designed EscI-EtgA fusion protein

J Boorman et al. Protein Sci. 2024 Mar.

Abstract

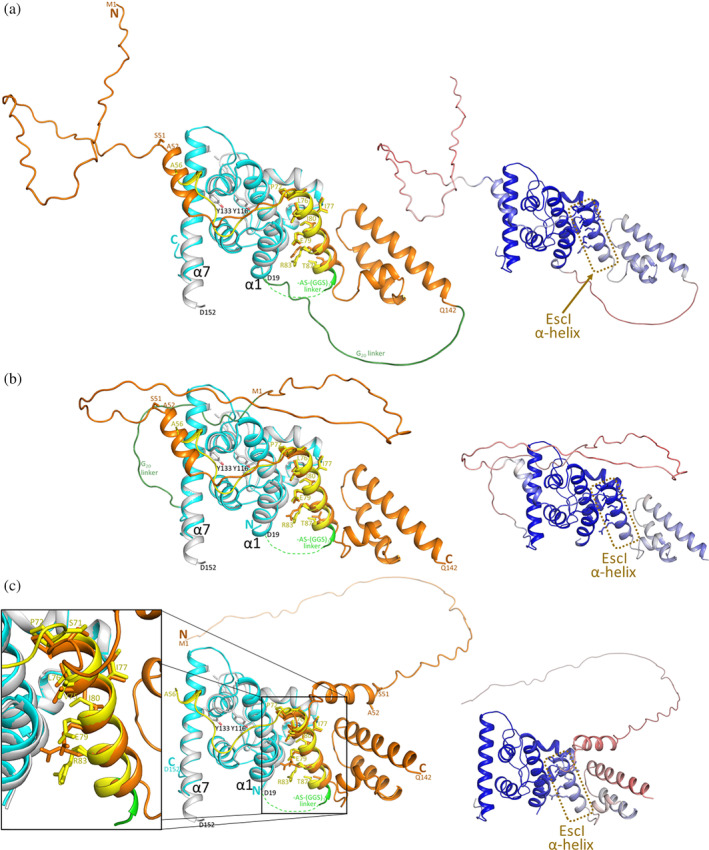
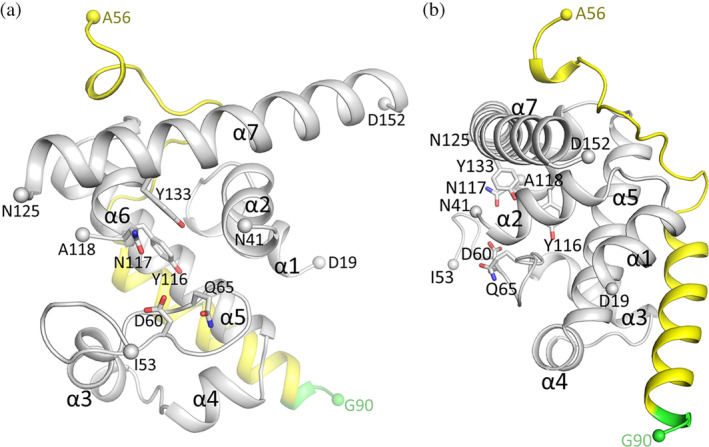
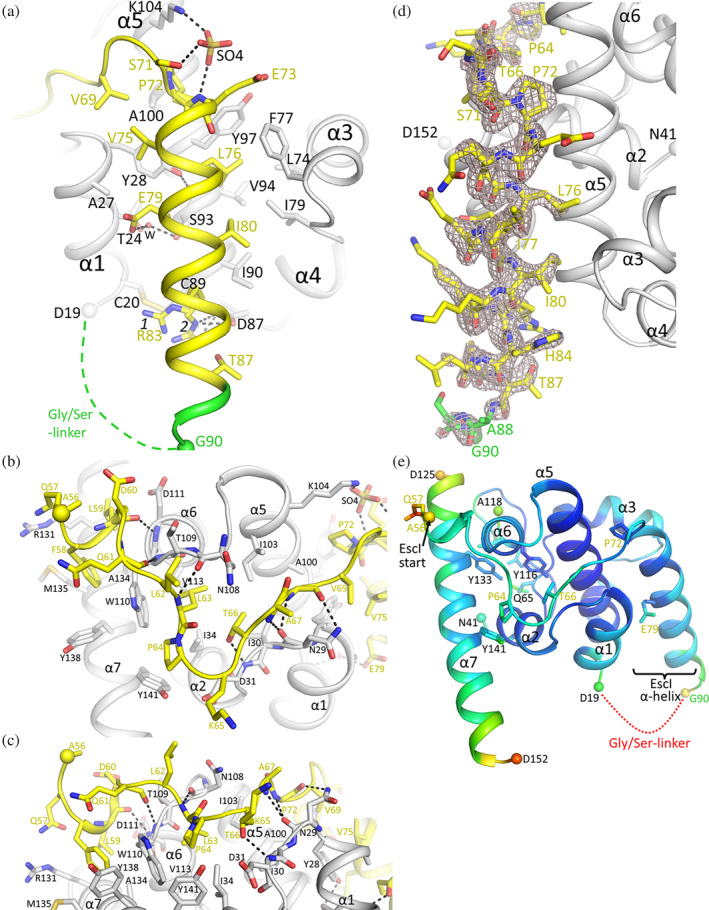
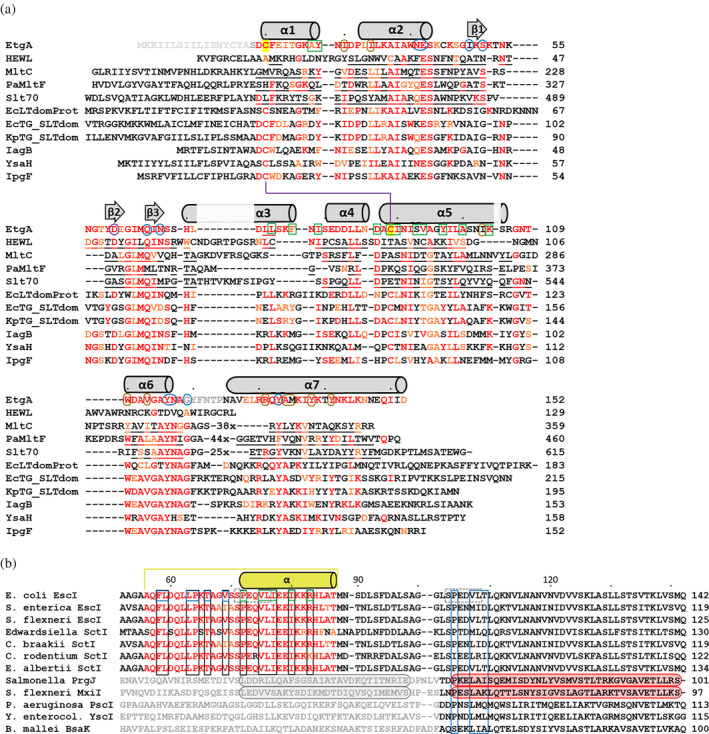
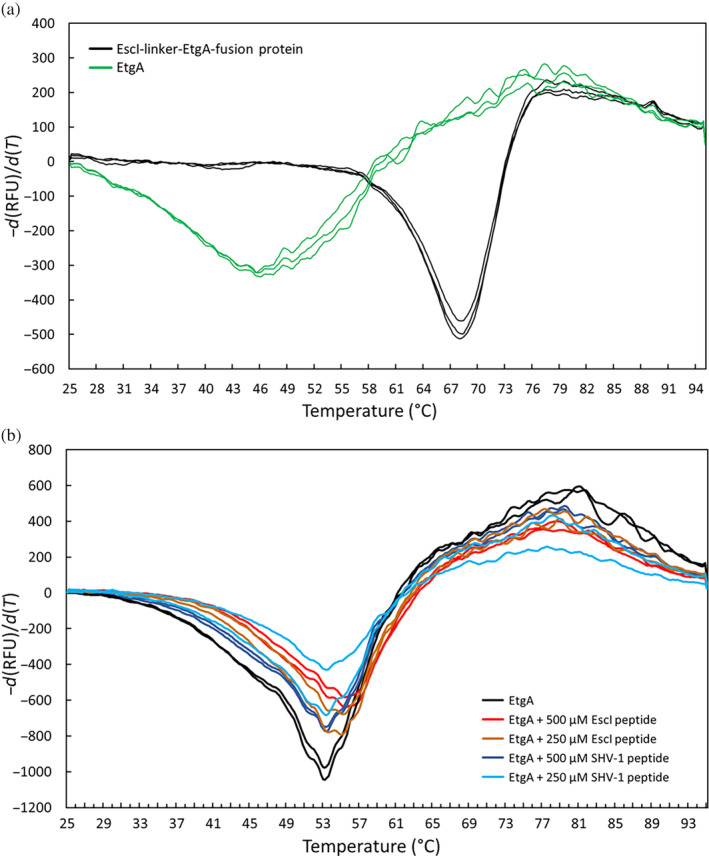
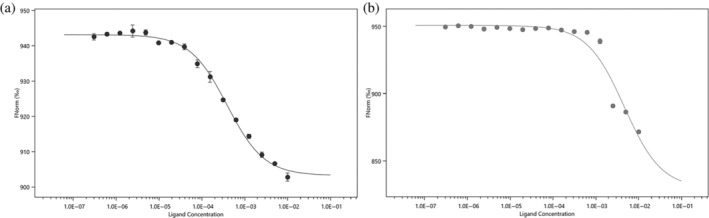
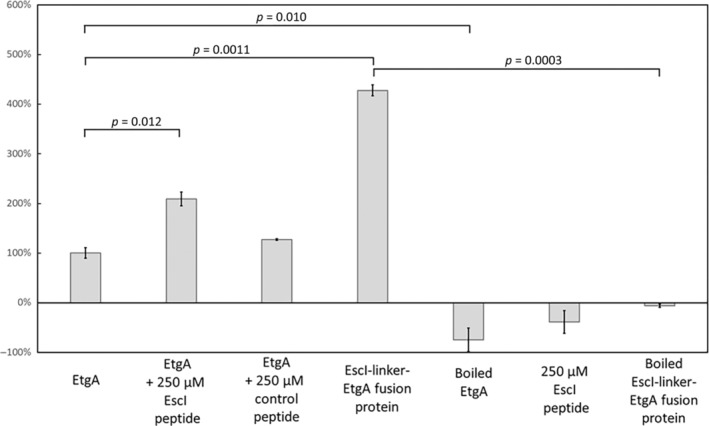
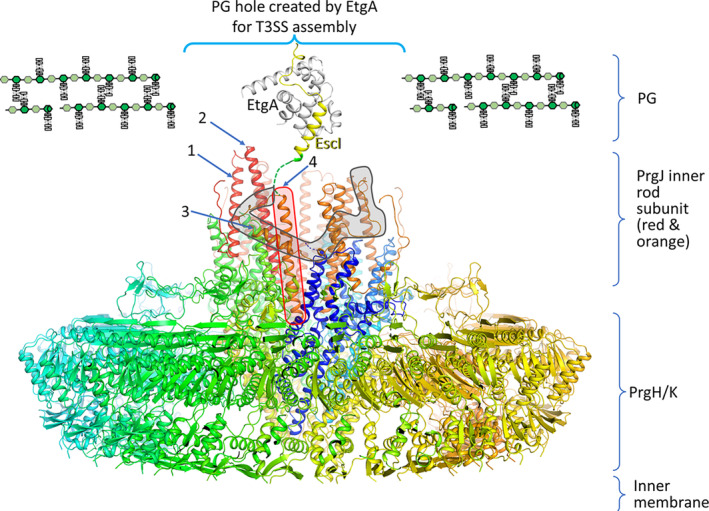
Bacteria express lytic enzymes such as glycosidases, which have potentially self-destructive peptidoglycan (PG)-degrading activity and, therefore, require careful regulation in bacteria. The PG glycosidase EtgA is regulated by localization to the assembling type III secretion system (T3SS), generating a hole in the PG layer for the T3SS to reach the outer membrane. The EtgA localization was found to be mediated via EtgA interacting with the T3SS inner rod protein EscI. To gain structural insights into the EtgA recognition of EscI, we determined the 2.01 Å resolution structure of an EscI (51-87)-linker-EtgA fusion protein designed based on AlphaFold2 predictions. The structure revealed EscI residues 72-87 forming an α-helix interacting with the backside of EtgA, distant from the active site. EscI residues 56-71 also were found to interact with EtgA, with these residues stretching across the EtgA surface. The ability of the EscI to interact with EtgA was also probed using an EscI peptide. The EscI peptide comprising residues 66-87, slightly larger than the observed EscI α-helix, was shown to bind to EtgA using microscale thermophoresis and thermal shift differential scanning fluorimetry. The EscI peptide also had a two-fold activity-enhancing effect on EtgA, whereas the EscI-EtgA fusion protein enhanced activity over four-fold compared to EtgA. Our studies suggest that EtgA regulation by EscI could be trifold involving protein localization, protein activation, and protein stabilization components. Analysis of the sequence conservation of the EscI EtgA interface residues suggested a possible conservation of such regulation for related proteins from different bacteria.

Keywords: EscI inner rod protein; lytic transglycosylase; muramidase; peptidoglycan glycosidases EtgA; protein crystallography; type III secretion system.


Figures

FIGURE 1
FIGURE 1
Comparison of the EscI‐linker‐EtgA fusion protein crystal structure and AlphaFold2 predictions. (a) AlphaFold2 structure prediction of an EscI‐G20‐EtgA sequence superimposed onto the crystal structure of EscI‐linker‐EtgA fusion protein. EscI and EtgA in the AlphaFold2 prediction are colored orange and cyan, respectively, with the glycine linker colored green. EtgA and EscI regions in the crystal structure are colored gray and yellow, respectively, and the connecting linker residues are colored green. The N‐ and C‐termini of the predicted fusion protein structure are labeled. On the right side is a smaller version of the same AlphaFold2 predicted structure but now colored by confidence level as estimated by AlphaFold2 (coloring spectrum is red, white, and blue with the minimum and maximum values set at 10% and 90%, respectively). The location of the EscI (72–87) helix is indicated by the brown rounded rectangle. (b) Same as (a), but now for the EtgA‐G20‐EscI AlphaFold2 prediction. (c) Same as (a), but now for the AlphaFold2 prediction entailed two separate sequences for EscI and EtgA instead of a glycine linker fusion input sequence. A zoomed‐in insert shows the match of experimental and prediction of the α‐helical region of EscI 72–87 interacting with EtgA.
FIGURE 2
FIGURE 2
Crystal structure of EscI‐EtgA fusion protein. (a) Cartoon representation of the EscI‐linker‐EtgA fusion protein. EtgA and EscI regions are colored gray and yellow, respectively, and the connecting linker residues are colored green. The ends of missing regions due to poor electron density or the end of the chain are indicated by larger spheres. The active site region is facing the viewer in this orientation; several conserved active site residues are shown in ball and stick and are labeled. EtgA α‐helices α1–α7 are labeled. (b) Same as (a), but the view is rotated ~90° vertically to show the position of EscI interacting with EtgA.
FIGURE 3
FIGURE 3
Interactions and electron density of EtgA binding to EscI. (a) View of the helical portion of EscI interacting with EtgA. The coloring is as in Figure 2. Hydrogen bonds are indicated by dashed lines. The missing linker residues connecting EscI to EtgA are shown by a green dashed line. A buffer component sulfate ion is shown (labeled SO4). (b) Close‐up view of EscI residues 56–71 interacting with EtgA. (c) Same as (b) but view is rotated about 90°. (d) Omit electron density map showing electron density for EscI in a similar view as in (a). Prior to the map calculation, the entire EscI and linker were removed from the model, and 10 rounds of additional crystallographic refinement were carried out to remove model bias (electron density is contoured at the 3σ level). (e) Temperature factor analysis of the EscI‐EtgA fusion protein. Crystallographically refined temperature factors of the atoms are color‐ramped from blue, green, orange, yellow, to red for progressively higher temperature factors (default values used in Pymol).
FIGURE 4
FIGURE 4
Structural comparisons of EscI‐EtgA fusion protein with EtgA D60N, lysozyme, and Slt70. (a) Superimposition of the EscI‐linker‐EtgA fusion protein and the apo EtgA D60N mutant structure (Protein Data Bank [PDB] ID 4XP8; Burkinshaw et al., 2015). The EscI‐linker‐EtgA fusion protein is shown in the same coloring as in Figure 2a and in a similar orientation. The apo EtgA D60N mutant structure is shown in red. The α‐helices are numbered (“α#”). (b) The apo EtgA D60N mutant structure is shown without the fusion protein for comparison to illustrate it is lacking part of the α5 and the whole α6 and α7 helices. In contrast, the apo EtgA D60N structure does have residues 42–52 resolved, including the catalytic E42 that the fusion protein structure is missing due to disorder. (c) Superimpositioning of the EscI‐linker‐EtgA fusion protein structure onto hen egg‐white lysozyme in complex with 4‐O‐β‐tri‐N‐acetylchitotriosyl moranoline (PDB ID 4HP0; Ogata et al., ; lysozyme is in green and ligand is shown in stick representation with dark green carbon atoms). The saccharide subsites are labeled in large bold font; several α‐helices from the fusion protein are labeled in large font. A number of EtgA active site residues are labeled, and those that are different between the two proteins are indicated by listing the lysozyme residue name in green. (d) Same as (c) but zoomed out to show the whole lysozyme molecule. (e) EscI‐linker‐EtgA fusion protein superimposed onto Escherichia coli Slt70 in complex with the inhibitor bulgecin A (PDB ID 1SLY; Thunnissen et al., 1995); Slt70 is in cyan with bulgecin A shown in stick representation with dark blue carbon atoms. A number of EtgA active site residues are labeled, and those that are different between the two proteins are indicated by listing the Slt70 residue name in cyan. (f) Same as (e) but zoomed out to show the whole Slt70 molecule. The view is slightly rotated from panel (e) to avoid having other regions of Slt70 obscure the superimposed catalytic domains.
FIGURE 5
FIGURE 5
Structure‐based sequence alignment of EtgA and EscI. (a) Structure‐based sequence alignment of EtgA and some of its closest homologs from the PDB and AlphaFold2 databases. The experimentally observed α‐helical and β‐strand secondary structure elements in EtgA (either in this fusion protein structure or in the EtgA D60N structure (Protein Data Bank [PDB] ID 4XP8; Burkinshaw et al., 2015) are indicated by gray cylinders and arrows, respectively. Residues at structurally conserved positions with the EtgA structure (the fusion protein structure and EtgA D60N) are underlined for sequences from PDB structures only. Residues identical or similar to EtgA are colored red and orange, respectively. Residues in the active site that are found to interact with substrates, products, and inhibitors in lysozyme and lytic transglycosylases (LTs) are circled blue. Residues found interacting with EscI residues 56–71 or with the α‐helical 72–87 region of EscI are highlighted in brown rounded boxes or green boxes, respectively. The aspartate residue at EtgA position 60 where muramidases such as lysozyme differ from LTs, is circled purple; this residue is hypothesized to facilitate hydrolysis of the peptidoglycan (PG) saccharide backbone, whereas LTs catalyze the breakdown of PG non‐hydrolytically resulting in a 1,6‐anhydo‐MurNAc PG end (Thunnissen et al., 1995). The cysteine residues in EtgA that form a disulfide bond are highlighted yellow, and their bond is indicated by the purple line. The signal peptide at the N‐terminus not included in the crystallized constructs is colored in light gray; disordered residues neither observed in the fusion protein structure nor in the EtgA D60N structure are labeled dark gray. The following sequences are aligned with their UniProt/Genbank/NCBI number and PDB or AlphaFold2 identifier listed in parentheses: EtgA (PSY23662.1), hen egg‐white lysozyme (HEWL, P00698, 4HP0), Escherichia coli MltC (P0C066, 4CHX), Pseudomonas aeruginosa MltF (QPV53566.1, 4OXV), E. coli Slt70 (P0AGC3.1, 1SLY), E. coli LT domain protein/putative peptidoglycan‐binding‐like protein Q46790 (WP_248785091, AF: Q46790), E. coli transglycosylase (TG) Soluble lytic transglycosylase (SLT) domain‐containing protein (WP_282840319.1, AF: Q00739), Klebsiella pneumoniae TG SLT domain‐containing protein (WP_283103658.1, AF: A0A0H3GZM5), Salmonella enterica IagB (WP_052940227), Yersinia enterocolitica YsaH (WP_032909100.1, AF: Q9KKJ1), and Shigella flexneri IpgF (WP_010921668.1, AF: Q07568). (b) Sequence alignment of the C‐terminal portion of EscI and related sequences. Bacterial sequences of inner rod secretion system proteins EscI, SctI, and the much more distantly related PrgJ, MxiI, PscI, YscI, and BsaK are aligned. The last five protein sequences are only weakly homologous with the EscI/SctI sequence, with homology present primarily in their C‐terminal portion of the alignment (as suggested by Monlezun et al., 2015); the sequences for their N‐terminal residues are therefore colored gray. The crystallographically observed section of EscI is indicated by the yellow lines above the sequence; the residues observed in an α‐helix are indicated by a yellow cylinder. Residues in this sequence section that are identical or similar to EtgA are colored red and orange, respectively (residues outside this section are colored black). EscI residues 56–71 and the α‐helical residues 72–87 observed to interact with EtgA are indicated by blue and green boxes, respectively; their conservation in the other EscI and SctI sequences are shown in the black boxes. The EscI sequence motif SPEQVL and the almost identical SPEDVL motif located more toward the C‐termini are indicated by gray boxes; the residues that are key in motif 1 to interact with EtgA appear with possible conservation in the more C‐terminally located motif in all 12 aligned sequences (indicated by blue boxes). The observed α‐helical structure of the two C‐terminal helices in Salmonella PrgJ (PDB ID 7AH9; Miletic et al., 2021) and S. flexneri MxiI (PDB ID 8AXK; Flacht et al., 2023) in their respective cryo‐EM structures are indicated by transparent gray and red cylinders, respectively. The following sequences are aligned with their National Center for Biotechnology Information (NCBI) reference sequence/Genbank number and PDB ID (if present) listed in parenthesis: E. coli EscI (QNS46965.1), S. enterica EscI (EAA7243576.1), S. flexneri EscI (EFP9271608.1), Edwardsiella SctI (WP_081854118.1), Citrobacter braakii SctI (MBJ9239943.1), Citrobacter rodentium SctI (WP_012907123.1), Escherichia albertii SctI (WP_149454893.1), Salmonella PrgJ (WP_000020431.1, 7AH9), S. flexneri MxiI (EJZ0508793.1, 8AXK), P. aeruginosa PscI (AAC44780.1), Y. enterocolitica YscI (WP_010891231.1), and Burkholderia mallei BsaK (QNS46965.1).
FIGURE 6
FIGURE 6
Differential scanning fluorimetry (DSF) analysis of EtgA EscI interaction. (a) DSF analysis of 8 μM EtgA (green) and 8 μM EscI (56–87)‐linker‐EtgA fusion protein (black). The first derivative of relative fluorescence units versus temperature is plotted (DeSantis et al., 2012); these data were obtained directly from the pre‐installed Fluorescence resonance energy transfer (FRET) channel of the CFX96 Touch ThermoCycler (Bio‐rad). Experiments were done in triplicate. (b) DSF analysis of 20 μM EtgA (black) in the presence of 500 and 250 μM EscI peptide (red and orange, respectively) or 500 and 250 μM control SHV‐1 peptide (blue and cyan, respectively). Experiments were done in duplicate.
FIGURE 7
FIGURE 7
Microscale thermophoresis (MST) measurements probing EscI peptide binding to EtgA. (a) MST analysis of EscI peptide (66–87) binding to 6xHis‐tag EtgA. A ligand dose–response curve is plotted for F norm, which is obtained by dividing the F 1 fluorescence by F 0 fluorescence, as carried out by the Nanotemper MO. Affinity Analysis v2.3 software. The EtgA was labeled with RED‐tris‐NTA His‐Tag 2nd generation nanotemper dye. The measurements yielded a K d of 385 ± 35 μM. (b) MST analysis of 6xHis‐tag EtgA in the presence of control peptide. The control peptide sequence was FIADKTGAGE, a peptide derived from the SHV‐1 β‐lactamase sequence. No K d could be calculated from this peptide that was used as a control peptide.
FIGURE 8
FIGURE 8
EnzChek activity assay of EtgA and the effect of EscI. Activity assay measurements of EtgA in the presence and absence of 250 μM EscI (66–87) peptide, 250 μM control peptide from SHV‐1, or as part of a fusion protein (i.e., EscI‐linker‐EtgA). Controls include boiled (inactivated) samples and EscI peptide by itself (no EtgA). Samples were done in duplicate, and calculated Student t‐test p‐values between different measurements are indicated.
FIGURE 9
FIGURE 9
Model of EtgA positioned near an assembling type III secretion system (T3SS) via binding to the inner rod subunit. Part of the cryo‐EM structure of the Salmonella T3SS (Protein Data Bank [PDB] ID 7AH9; Miletic et al., 2021) is depicted with the filament and InvG proteins omitted to model an assembling T3SS. Five of the six copies of PrgJ adopt a conformation where its two helices are antiparallel (labeled “1” and “2” for the red‐colored PrgJ); one of the PrgJ copies adopts a very different more extended conformation for its N‐terminal half (labeled “3”; gray transparent outline) whereas its C‐terminal helix is adopting the same conformation (labeled “4”; red transparent outline) as in the other PrgJ copies. To obtain insights into how EtgA or homolog would position itself onto an assembling T3SS, we positioned the EscI‐EtgA fusion protein above the one unique PrgJ copy that adopts a very different conformation for its N‐terminal half as we hypothesize this PrgJ region to be flexible in the assembling T3SS in agreement with a related cryo‐EM structure where this region was found to be disordered (Hu et al., 2019). The modeled EscI fusion protein is (virtually) connected to PrgJ via a dotted green line connecting the C‐terminal section of the EscI 72–87 helix and the PrgJ helix labeled “4.” Peptidoglycan (PG) is presented via alternating MurNAc and GlcNAc moieties colored dark green and light green hexagons, respectively; peptide moieties are shown as rectangular shapes.

Similar articles

References

    1. Agirre J, Atanasova M, Bagdonas H, Ballard CB, Basle A, Beilsten‐Edmands J, et al. The CCP4 suite: integrative software for macromolecular crystallography. Acta Crystallogr D Struct Biol. 2023;79(Pt 6):449–461. 10.1107/S2059798323003595 - DOI - PMC - PubMed
    1. Artola‐Recolons C, Lee M, Bernardo‐Garcia N, Blazquez B, Hesek D, Bartual SG, et al. Structure and cell wall cleavage by modular lytic transglycosylase MltC of Escherichia coli . ACS Chem Biol. 2014;9(9):2058–2066. 10.1021/cb500439c - DOI - PMC - PubMed
    1. Burkinshaw BJ, Deng W, Lameignere E, Wasney GA, Zhu H, Worrall LJ, et al. Structural analysis of a specialized type III secretion system peptidoglycan‐cleaving enzyme. J Biol Chem. 2015;290(16):10406–10417. 10.1074/jbc.M115.639013 - DOI - PMC - PubMed
    1. Chen X, Zaro JL, Shen WC. Fusion protein linkers: property, design and functionality. Adv Drug Deliv Rev. 2013;65(10):1357–1369. 10.1016/j.addr.2012.09.039 - DOI - PMC - PubMed
    1. Creasey EA, Delahay RM, Daniell SJ, Frankel G. Yeast two‐hybrid system survey of interactions between LEE‐encoded proteins of enteropathogenic Escherichia coli . Microbiology. 2003;149(Pt 8):2093–2106. 10.1099/mic.0.26355-0 - DOI - PubMed

MeSH terms

LinkOut - more resources