. 2024 Apr;11(16):e2307744.
doi: 10.1002/advs.202307744. Epub 2024 Feb 21.

Large-Scale Proteome Profiling Identifies Biomarkers Associated with Suspected Neurosyphilis Diagnosis

Affiliations

Large-Scale Proteome Profiling Identifies Biomarkers Associated with Suspected Neurosyphilis Diagnosis

Jun Li et al. Adv Sci (Weinh). 2024 Apr.

Abstract

Neurosyphilis (NS) is a central nervous system (CNS) infection caused by Treponema pallidum (T. pallidum). NS can occur at any stage of syphilis and manifests as a broad spectrum of clinical symptoms. Often referred to as "the great imitator," NS can be easily overlooked or misdiagnosed due to the absence of standard diagnostic tests, potentially leading to severe and irreversible organ dysfunction. In this study, proteomic and machine learning model techniques are used to characterize 223 cerebrospinal fluid (CSF) samples to identify diagnostic markers of NS and provide insights into the underlying mechanisms of the associated inflammatory responses. Three biomarkers (SEMA7A, SERPINA3, and ITIH4) are validated as contributors to NS diagnosis through multicenter verification of an additional 115 CSF samples. We anticipate that the identified biomarkers will become effective tools for assisting in diagnosis of NS. Our insights into NS pathogenesis in brain tissue may inform therapeutic strategies and drug discoveries for NS patients.

Keywords: cerebrospinal fluid; diagnostic biomarker; machine learning model; neurosyphilis; proteomics.


Conflict of interest statement

The authors declare no conflict of interest.

Figures

Figure 1
Figure 1
Proteomic features of CSF from NS patients. A) Schematic of the experimental workflow of the quantitative proteome and bioinformatics analyses used to analyze CSF samples from NNS (n = 25), NS (n = 15), PTNS (n = 7), NIBD (n = 9), and IBD (n = 7) patients. High‐resolution MS analyses of fractionated, pooled samples were performed in data‐dependent acquisition mode (DDA) for library construction and subsequently in data‐independent (DIA) acquisition mode for protein identification and quantitation. NNS: syphilis/nonneurosyphilis; NS: neurosyphilis; PTNS: posttreatment neurosyphilis; NIBD: noninfectious brain disease without syphilis; IBD: infectious brain disease unrelated to syphilis. B) Heatmap showing differentially expressed proteins (358 proteins in total) in the CSF between NNS (n = 25) and NS (n = 15) samples (Cohort 1). Pairwise comparisons are carried out using Limma and the proteins with a Benjamini–Hochberg (BH) adjusted p value ≤ 0.01 were considered to indicate statistical significance. The red and blue empty frames or boxes represent up‐ and downregulated proteins, respectively, in the NS vs. NNS comparison. C) Biological process analysis of differentially expressed proteins in the CSF of NS vs. NNS patients ranked according to the log10 p value. The colors indicate functional categories. Changes in expression levels of selected functional proteins that were significantly upregulated (red font) or downregulated (blue font) between NNS and NS samples.
Figure 2
Figure 2
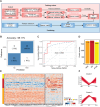
Identification of potential biomarkers for diagnosis of NS patients from NNS patients using machine learning methods. A) Schematic of the random forest (RF)‐based machine learning strategy developed for classifying the CSF of NS patients. The classifier was first trained and validated in two training and independent testing cohorts (Cohort 1 and Cohort 2) and then validated in a third independent testing cohort (Cohort 3). Cohort 1 included protein profiles from a cohort consisting of 15 NS individuals and 25 NNS individuals quantified via DIA‐MS. Cohort 2 was a protein profile of 35 NS individuals and 39 NNS individuals verified via PRM‐MS analysis. Cohort 3 included the protein profiles of 29 individuals suspected of having NS detected via PRM‐MS analysis, and 11 of them were verified via ELISA after prediction via the RF model. B) Confusion matrix showing the model performance for classifying NS individuals. The numbers represent the total number of repeats from three cross‐validations with train‐test splits. C) Receiver operating characteristic curves for the RF‐based model for classifying NS individuals. The red line shows values for the test cohort. Random performance is indicated by the gray dotted diagonal line. D) Distribution of proteins identified in CSF from NNS, NS, and PTNS samples. E) Heatmap showing the changes in expression of differentially expressed proteins (358 total proteins, z score‐normalized log2‐transformed value) in the NNS and NS samples within the PTNS sample. The red and blue boxes represent up‐ and downregulated proteins, respectively, among the three groups. F) Coexpression patterns of the proteins in the Cluster 1 and Cluster 2 modules are shown, representing proteins that were upregulated (cluster 1) and downregulated (cluster 2) in the NS group compared to the NNS group and recovered in the PTNS group.
Figure 3
Figure 3
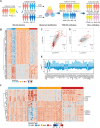
Exploration and identification of potential biomarkers for diagnosis of NS from other brain diseases. A) Workflows of CSF samples from NS, IBD, NIBD, and PTNS patients were measured by DIA‐MS, PRM‐MS, and ELISA. CSF samples were analyzed for biomarker identification based on the different cohorts. B) Heatmap showing the ability of differentially expressed proteins between NNS and NS (358 total proteins, z score‐normalized log2‐transformed value) in CSF among IBD and NIBD samples. The red and blue color bars represent the scaled expression levels of proteins among the four groups. C) Scatter plot of log2‐fold changes for NS vs. NNS (x‐axis) and IBD vs. NNS (y‐axis). The red dots indicate proteins with fold changes consistent and p values that met the cutoff of p < 0.01 for both pairwise comparisons. The blue dots indicate proteins that met the opposite fold changes and a p value cutoff of p < 0.01 for both pairwise comparisons. D) Scatter plot of log2‐fold changes for NS vs. NNS (x‐axis) and NIBD vs. NS (y‐axis). The red dots indicate proteins with consistent fold changes and p values that met the cutoff of p < 0.01 for both pairwise comparisons. The blue dots indicate proteins that met the opposite fold changes and a p value cutoff of p < 0.01 for both pairwise comparisons. E) Histogram showing differentially expressed proteins in both the NS vs. IBD (light blue) and NS vs. NIBD (dark blue) groups based on the log fold change. F) Heatmap showing differentially expressed proteins (58 proteins in total, z score‐normalized log2‐transformed value) in CSF among NNS (n = 39), NS (n = 35), IBD (n = 32), and NIBD (n = 14) samples for PRM‐MS verification. The red and blue color bars represent the scaled expression levels of proteins among these groups.
Figure 4
Figure 4
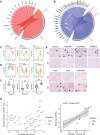
Verification of potential biomarkers for diagnosis of NS. The correlation of upregulated (A) and downregulated (B) proteins with clinical indicators (CSF‐PRP, CSF‐WBC, and CSF‐PRP). Protein expression levels of SEMA7A, SERPINA3, and ITIH4 in the NNS, NS, PTNS, IBD, and NIBD groups measured by the DIA identification (C) and PRM‐MS verification (D) according to the normalized protein intensity. Pairwise comparisons are carried out using Limma to determine the proteins with significantly different expression levels. BH‐adjusted p values: *p < 0.05; **p < 0.01; ***p < 0.001. E) Immunohistochemical staining of LINGO1, SERPINI1, CNTNAP4, SEMA7A, ITIH1, ITIH4, and SERPINA3 in the brain tissue of the NNS and normal control (NC) groups (scale bar: 50 µm). F) ELISA analysis of SEMA7A, SERPINA3, and ITIH4 expression in the CSF of the NNS (n = 45) and NS (n = 44) groups according to log10 (intensity). Data are presented as mean ±SEM and Student's t‐test was conducted to compare data between two groups. BH‐adjusted p values: *p < 0.05; **p < 0.01; ***p < 0.001. G) Performance of the RF model in the test cohort of 29 suspected NS patients (Cohort 3). A scatter plot of the predicted values against the average molecular intensity is shown in the left panel, and a scatter plot of the predicted values against the ELISA results is shown in the right panel. Patients labeled in red were predicted to have NS; the other patients labeled in orange were predicted to have NNS.

Similar articles

References

    1. Peeling R. W., Mabey D., Kamb M. L., Chen X. S., Radolf J. D., Benzaken A. S., Nat. Rev. Dis. Primers 2017, 3, 17073. - PMC - PubMed
    1. Wang C., Zhao P., Xiong M., Tucker J. D., Ong J. J., Hall B. J., Sami M., Zheng H., Yang B., Front Med. (Lausanne) 2021, 8, 781759. - PMC - PubMed
    1. Ghanem K. G., Ram S., Rice P. A., N. Engl. J. Med. 2020, 382, 845. - PubMed
    1. Ropper A. H., N. Engl. J. Med. 2019, 381, 1358. - PubMed
    1. Radolf J. D., Deka R. K., Anand A., Šmajs D., Norgard M. V., Yang X. F., Nat. Rev. Microbiol. 2016, 14, 744. - PMC - PubMed

Publication types

LinkOut - more resources