. 2024 Feb 20;17(824):eadg9256.
doi: 10.1126/scisignal.adg9256. Epub 2024 Feb 20.

Designer high-density lipoprotein particles enhance endothelial barrier function and suppress inflammation

Affiliations

Designer high-density lipoprotein particles enhance endothelial barrier function and suppress inflammation

Yueh-Chien Lin et al. Sci Signal. .

Abstract

High-density lipoprotein (HDL) nanoparticles promote endothelial cell (EC) function and suppress inflammation, but their utility in treating EC dysfunction has not been fully explored. Here, we describe a fusion protein named ApoA1-ApoM (A1M) consisting of apolipoprotein A1 (ApoA1), the principal structural protein of HDL that forms lipid nanoparticles, and ApoM, a chaperone for the bioactive lipid sphingosine 1-phosphate (S1P). A1M forms HDL-like particles, binds to S1P, and is signaling competent. Molecular dynamics simulations showed that the S1P-bound ApoM moiety in A1M efficiently activated EC surface receptors. Treatment of human umbilical vein ECs with A1M-S1P stimulated barrier function either alone or cooperatively with other barrier-enhancing molecules, including the stable prostacyclin analog iloprost, and suppressed cytokine-induced inflammation. A1M-S1P injection into mice during sterile inflammation suppressed neutrophil influx and inflammatory mediator secretion. Moreover, systemic A1M administration led to a sustained increase in circulating HDL-bound S1P and suppressed inflammation in a murine model of LPS-induced endotoxemia. We propose that A1M administration may enhance vascular endothelial barrier function, suppress cytokine storm, and promote resilience of the vascular endothelium.


Conflict of interest statement

Competing interests: TH and SS are named as inventors on patent applications (#XX) that describe A1M. The other authors claim that they have no competing interests.

Figures

Fig. 1.
Fig. 1.. Production, purification, and characterization of S1P binding by the A1M fusion protein.
(A) Purified A1M (4 μg) from CHO cell conditioned media was separated by reducing 10% SDS-PAGE and stained with Coomassie brilliant blue. (B) Purified A1M was incubated with S1P for 24 hours, lipidated, and purified by gel filtration chromatography. S1P content of A1M-S1P was analyzed by electrospray ionization-MS/MS. The resulting data are the mean ± S.D.; N = 5 biological replicates per group. ****P < 0.0001 by unpaired t-test. (C) Representative FPLC elution profiles (OD 280 nm) of 200 μl of mouse plasma (black), purified recombinant A1M (blue), and lipidated A1M with S1P loading (A1M-S1P, red). FPLC elution of plasma standards: vLDL/LDL (21–26 mL), HDL (28–31 mL), and soluble protein (31–35 mL) fractions. Elution profiles are representative of 3 independent experiments. (D) Representative negative-stain transmission EM image of lipidated A1M-S1P complex with some particles highlighted in white circles (top) and 2D averages with potential ApoM densities indicated by arrows (bottom). Box dimension of each 2D average is 215 Å. Images are representative of 3 independent experiments. (E) Schematic model of A1M-S1P.
Fig. 2
Fig. 2. Molecular dynamics simulation study of A1M-S1P complex.
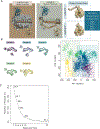
(A) Side view of A1M-S1P complex with and without the phospholipids, highlighting the S1P binding pocket in both the ApoM-S1P and ApoA1-fused systems. Monomer 1 - ApoA1 in sienna, linker in brown, and ApoM in beige. Monomer 2 - ApoA1 in sage, linker in turquoise, and ApoM in teal. Detail of the binding pocket in A1M-S1P and ApoM-S1P are shown in the right panel. (B) Projection of protein atoms along the top two dominant eigenvectors (eigenvector 1 - PC1 and eigenvector 2 – PC2) is responsible for over 40% of the dominant collective variances in the structure set, generating 5 clusters for which the three-dimensional structure of the most representative member of each cluster is shown. Permanence times: cluster 1 – 9.6%, cluster 2 – 52.9%, cluster 3 – 18.7%, cluster 4 – 12.2%, cluster 5 – 6.5%. (C) Distribution of the proportion of variance between the PCs.
Fig. 3.
Fig. 3.. A1M-S1P activates S1PRs in G-protein dissociation and β-arrestin coupling assays
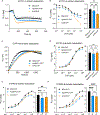
(A) Temporal analysis of S1P-induced S1PR1 activation in cells treated with 100 nM of S1P complexed with various chaperones through a NanoBiT G-protein dissociation assay (N = 3 biological replicates per group). (B) Dose-response analysis of S1PR1-dependent Gαi activation by bovine serum albumin-S1P (BSA-S1P), ApoM-Fc-S1P, or A1M-S1P by NanoBiT assay assessing G-protein dissociation (N = 3 biological replicates per group). (C) Temporal analysis of S1P-induced S1PR1 activation in cells treated with 100 nM of S1P complexed with various chaperones through a NanoBit β-arrestin association assay (N = 3 biological replicates per group). (D) Dose analysis of S1PR1-β-arrestin coupling induced by BSA-S1P, ApoM-Fc-S1P, or A1M-S1P by NanoBiT assay (N = 3 biological replicates per group). (E) Dose analysis of S1PR2-β-arrestin coupling induced by BSA-S1P, ApoM-Fc-S1P, or A1M-S1P by NanoBiT assay (N = 3 biological replicates per group). (F) Dose analysis of S1PR3-β-arrestin coupling induced by BSA-S1P, ApoM-Fc-S1P, or A1M-S1P by NanoBiT assay (N = 3 biological replicates per group). Data represent mean ± S.D. The bar graphs in (B), (D), (E), and (F) show the responses at 1 μM S1P. **P < 0.01, ***P < 0.001, ****P < 0.0001 by ordinary one-way ANOVA with Tukey’s multiple comparisons test.
Fig. 4.
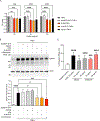
Fig. 4.. A1M-S1P maintains endothelial barrier function in vitro and suppresses thrombin-induced barrier degradation.
(A) TEER analysis to measure barrier function was performed on HUVECs treated with A1M-S1P, ApoM-Fc-S1P or chaperone only (N = 3 biological replicates per group). (B) TEER analysis to measure barrier function was performed on HUVECs treated with Ang-1 (300 ng/mL), A1M-S1P (30 nM) or both (N = 3 biological replicates per group). (C and D) TEER analysis to measure barrier function was performed on HUVECs treated with APC (5 μg/mL) alone or with A1M-S1P (30 nM) (C) or ApoM-Fc-S1P (30 nM) (D). After 1 hour pretreatment, thrombin was added for an additional 2 hours. N = 3 biological replicates per group. The EC barrier index (above the baseline) and EC barrier degradation index (below the baseline) were analyzed by calculating the area under the curve of TEER value and are presented as means ± SD. ***P < 0.001, ****P < 0.0001 by ordinary one-way ANOVA with Tukey’s multiple comparisons test.
Fig. 5
Fig. 5. Production and characterization of A1M-iloprost
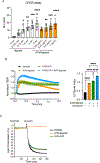
(A) Cells expressing a CREB-luciferase reporter with prostacyclin receptor (IP) were stimulated with vehicle or A1M-iloprost for 8 hours, and cell lysates were assayed for luciferase activity (N ≥ 3 biological replicates per group). 0 nM was used as a reference control and was normalized to 1. Data are presented as means ± S.D. *P < 0.05, **P < 0.01, ***P < 0.001, ****P < 0.0001 by ordinary one-way ANOVA with Dunnett’s multiple comparisons test. (B) TEER analysis to measure barrier function was performed on HUVECs treated with A1M-S1P (8 μg/mL with 100 nM S1P), A1M-iloprost (25 μg/mL with 200 nM iloprost), or both (N = 4 biological replicates per group). Data are presented as means ± SD. ****P < 0.0001 by ordinary one-way ANOVA with Tukey’s multiple comparisons test. (C) Human platelets were assayed for aggregation in response to the thrombin receptor mimetic peptide SFLLRN in the presence of vehicle control, A1M-iloprost (10 nM), A1M-S1P (200 nM), or in combination. Representative data from 3 biological replicates per group.
Fig. 6
Fig. 6. A1M attenuates TNFα-dependent inflammation
(A) HMEC-1 cells expressing an NF-κB-luciferase reporter were assayed for TNFα-induced NF-κB reporter activity in the presence of ApoA1, A1M, A1M-S1P, and ApoM-Fc-S1P (N = 3 biological replicates per group). Data are presented as means + S.D. **P < 0.01, ***P < 0.001, ****P < 0.0001 by ordinary two-way ANOVA with Tukey’s multiple comparisons test. TNFα is the reference group. (B) HUVECs were starved for 1 h, pre-treated for 10 minutes with ApoM-Fc-S1P (100 nM), iloprost (200 nM), both ApoM-Fc-S1P and iloprost, A1M (200 μg/mL), A1M-S1P (200 μg/mL), or A1M-iloprost (200 μg/mL) and induced with TNFα (10 ng/mL) for 5 hours. Lysates were subjected to immunoblot analysis for ICAM-1. Quantification of immunoblots was analyzed from 3 biological replicates per group. Data are presented as means ± S.D. *P < 0.05, **P < 0.01, ****P < 0.0001 by ANOVA with post-hoc Holm-Sidak’s multiple comparisons test. (C) Cholesterol efflux in response to human HDL (hHDL), human ApoA1 protein (hApoA1), and bacterial A1M (bA1M) in PMA-induced THP-1 cells (N ≥ 5 independent experiments). Data are presented as means + S.D. *P < 0.05, ***P < 0.001, ****P < 0.0001 by one-way ANOVA with Dunnett’s multiple comparisons test.
Fig. 7
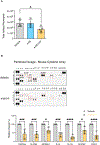
Fig. 7. A1M-S1P suppresses inflammation in a murine peritonitis model.
(A) Mice were treated intraperitoneally with thioglycolate and either PBS, A1M (0.2 mg/animal), or lipidated A1M-S1P (0.2 mg/animal). Peritoneal cells were collected at 4 h and analyzed by flow cytometry. N = 4–5 mice per group. Data are presented as means ± S.D. *P < 0.05 by one-way ANOVA with Dunnett’s multiple comparisons test. Vehicle was the reference group. (B) Peritoneal lavage supernatant from mice treated as described in (A) was assayed by cytokine array analysis. Statistical tests were done on analytes with changes in abundance after normalization (control was set at 100%). N = 3 mice per group. Data are presented as means ± S.D. *P < 0.05, ***P < 0.001, ****P < 0.0001 by ANOVA with Sidak’s multiple comparisons test.
Fig. 8
Fig. 8. The ApoA1 moiety of bA1M suppresses the systemic inflammatory response induced by LPS.
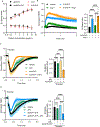
(A to C) Mice were injected intravenously with 40 mg/Kg of bA1M or PBS (vehicle) for 1 hour to allow for A1M lipidation in vivo before being injected intraperitoneally with 10 mg/Kg of LPS or saline. Groups were saline (N ≥ 6 mice), LPS alone (N ≥ 14 mice), and LPS with A1M (N ≥ 10 mice). Mice were assessed for sepsis score (A), body temperature (B), and plasma IL-6 amounts (C) at 12 hours post-LPS injection. Data are presented as means ± S.D. ***P < 0.001, ****P < 0.0001 by one-way ANOVA with Tukey’s multiple comparisons test. (D) 0.5 μl of plasma from mice injected with LPS alone (10 mg/Kg) or LPS and bA1M (40 mg/Kg) at 12 hours post-injection were subjected to Western blot analysis for ApoM. Each lane represents an individual mouse. (E) Plasma S1P content in mice injected with saline, LPS alone, or LPS and bA1M at 12 hours post-injection were analyzed by LC-MS/MS (N = 4 mice per group). Data are presented as means ± S.D. ***P < 0.001 by one-way ANOVA with Tukey’s multiple comparisons test.

Similar articles

References

    1. Pober JS, Sessa WC, Evolving functions of endothelial cells in inflammation. Nat Rev Immunol 7, 803–815 (2007). - PubMed
    1. Kiseleva RY et al., Targeting therapeutics to endothelium: are we there yet? Drug Deliv Transl Res 8, 883–902 (2018). - PMC - PubMed
    1. Yvan-Charvet L, Wang N, Tall AR, Role of HDL, ABCA1, and ABCG1 transporters in cholesterol efflux and immune responses. Arterioscler Thromb Vasc Biol 30, 139–143 (2010). - PMC - PubMed
    1. Ouimet M, Barrett TJ, Fisher EA, HDL and Reverse Cholesterol Transport. Circ Res 124, 1505–1518 (2019). - PMC - PubMed
    1. Remaley AT, Norata GD, Catapano AL, Novel concepts in HDL pharmacology. Cardiovasc Res 103, 423–428 (2014). - PMC - PubMed

LinkOut - more resources