[Preprint]. 2024 Jul 12:2024.02.06.579062.
doi: 10.1101/2024.02.06.579062.

Transcription Factor Condensates Mediate Clustering of MET Regulon and Enhancement in Gene Expression

Affiliations

Transcription Factor Condensates Mediate Clustering of MET Regulon and Enhancement in Gene Expression

James Lee et al. bioRxiv. .

Update in

Abstract

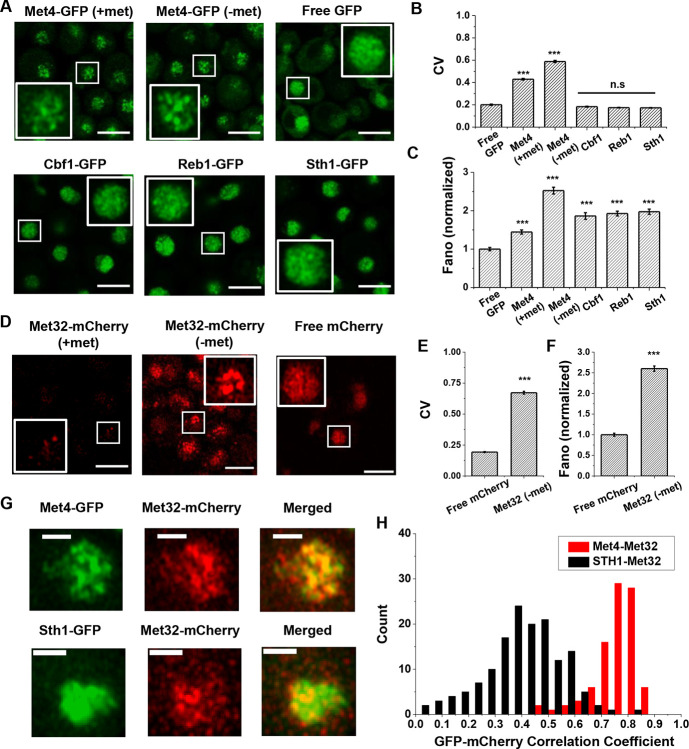
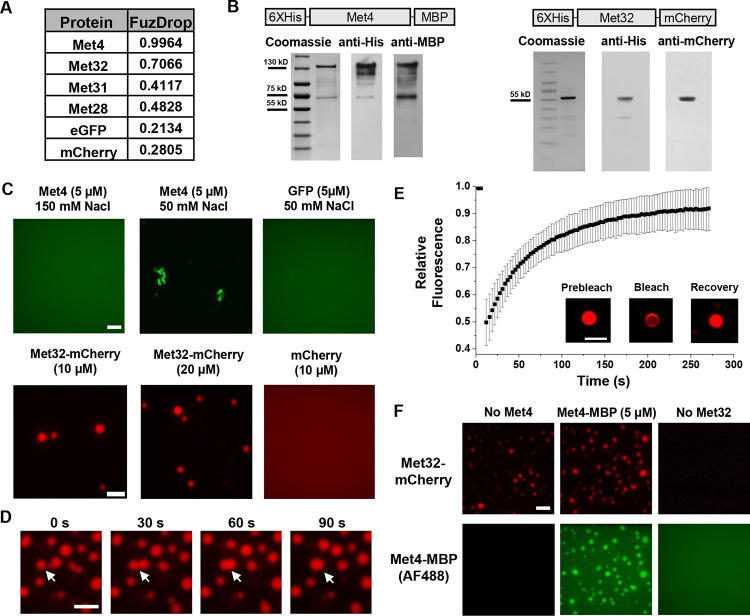
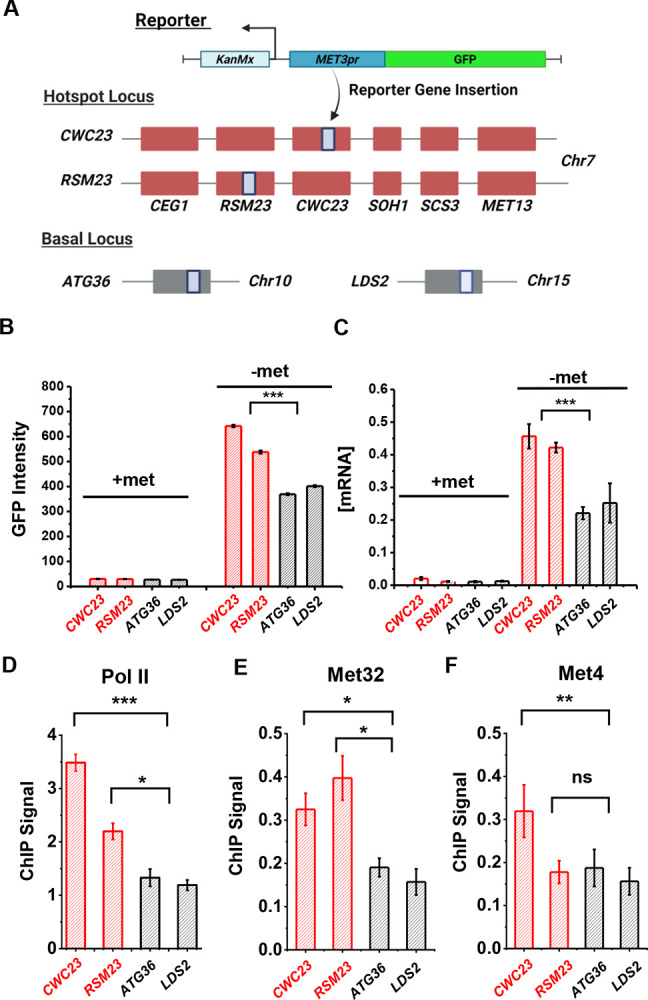
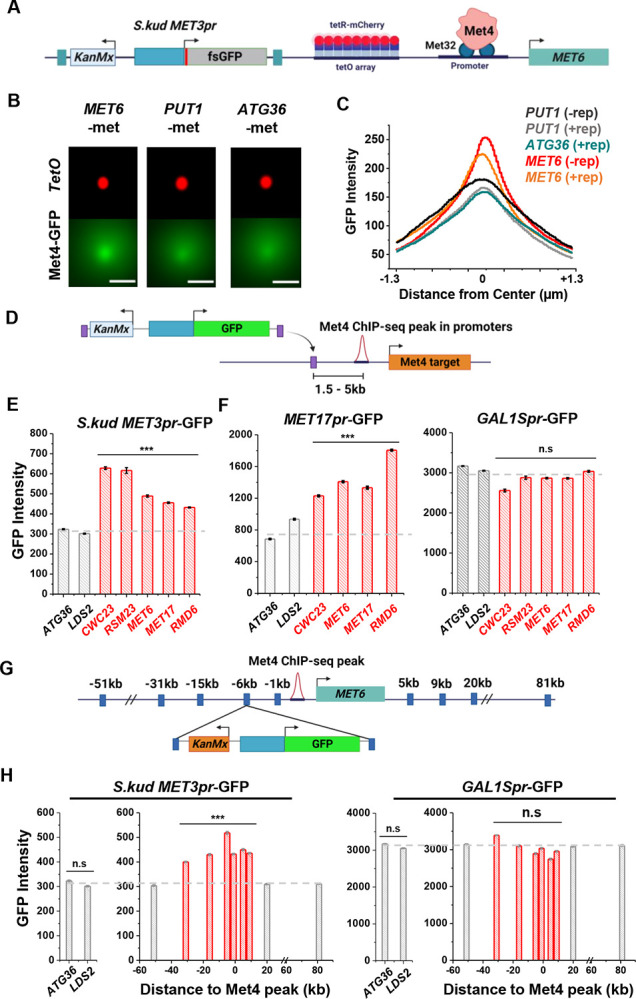
Some transcription factors (TFs) can form liquid-liquid phase separated (LLPS) condensates. However, the functions of these TF condensates in 3D genome organization and gene regulation remain elusive. In response to methionine (met) starvation, budding yeast TF Met4 and a few co-activators, including Met32, induce a set of genes involved in met biosynthesis. Here, we show that the endogenous Met4 and Met32 form co-localized puncta-like structures in yeast nuclei upon met depletion. Recombinant Met4 and Met32 form mixed droplets with LLPS properties in vitro. In relation to chromatin, Met4 puncta co-localize with target genes, and at least a subset of these target genes is clustered in 3D in a Met4-dependent manner. A MET3pr-GFP reporter inserted near several native Met4 binding sites becomes co-localized with Met4 puncta and displays enhanced transcriptional activity. A Met4 variant with a partial truncation of an intrinsically disordered region (IDR) shows less puncta formation, and this mutant selectively reduces the reporter activity near Met4 binding sites to the basal level. Overall, these results support a model where Met4 and co-activators form condensates to bring multiple target genes into a vicinity with higher local TF concentrations, which facilitates a strong response to methionine depletion.


Conflict of interest statement

Conflict of Interest Statement The authors declare no conflict of interest.

Figures

Figure 1.
Figure 1.. The trans-activator Met4 and its co-factor Met32 form puncta in the nucleus.
A) Representative images of Met4-GFP in ± methionine (met) conditions. Control cells expressing free GFP (driven by the HOpr), Cbf1-GFP, Reb1-GFP, and Sth1-GFP cells are shown with similar contrasts. Scale bars represent 4μm (same as in D & G). B & C) The mean coefficient of variance (CV) and Fano numbers of nuclear pixel intensities for different versions of GFPs in panel A. The Fano numbers are normalized so that the free GFP has a Fano number 1. Significance was calculated in comparison with free GFP values using two-tailed Student’s t-test (***: p<0.001). Number of cell analyzed: Met4-GFP +/−met (65/147), free GFP (67), Cbf1 (48), Reb1 (50), Sth1 (59). D) Representative images of strains expressing Met32-mCherry in +/− met conditions. Control strain expressing free mCherry (driven by the HOpr) is shown with similar contrasts. E & F) The mean CV and normalized Fano number of pixel intensities of Met32-mCherry vs free mCherry. G) Representative images of strains co-expressing Met4-GFP and Met32-mCherry (top row), or Sth1-GFP and Met32-mCherry (bottom row). H) A histogram of Pearson correlation coefficient between co-expressed Met4-GFP and Met32-mCherry signals (red bars N=93) or Sth1-GFP and Met32-mCherry signals (black bars N=149) in each cell.
Figure 2.
Figure 2.. Met32 forms condensates with LLPS properties in vitro.
A) Probabilities of individual Met TFs (Met4, Met32, Met31, Met28), GFP, and mCherry to undergo liquid-liquid phase separation from a published prediction program (Fuzdrop). B) Coomassie staining and western blots of purified Met4 and Met32 proteins. C) Protein aggregate and droplet formation observed for Met4-MBP and Met32-mCherry fusion proteins. Met4 and GFP are 5 μM, Met32-mCherry and mCherry are 10 μM in 20 mM HEPES pH 7.5, 150 mM NaCl buffer. Met4 and GFP are in 20 mM HEPES pH 7.5, 150 mM NaCl or 50 mM NaCl. Met4 is labeled with Alexa 488 (AF488). Scale bar represent 10 μm (same as in D-F). D) Merging of Met32-mCherry droplets. Met32-mCherry is at 30 μM in 20 mM HEPES pH 7.5, 150 mM NaCl. E) Fluorescence recovery after photobleaching (FRAP) data for 20 μM Met32 droplets. The intensity data was collected every 3 seconds for 270 seconds and normalized to percent bleaching. Inset: Representative images of Met32 FRAP. F) Colocalization of Met32-mCherry droplets (10 μM) with Met4-MBP (5 μM) in 150 mM NaCl.
Figure 3.
Figure 3.. Met4-activated genes co-localize with Met4 puncta.
A) Model of Met4 condensate in the chromatin context. Upon met depletion, Met TFs may form condensates that interact with multiple target genes, leading to the 3D clustering of these co-regulated genes. B) Examples of ChIP-seq signals of Met TFs (Met4, Met32, Met28 and Cbf1) in ±met conditions. The Met TF co-binding peak shown here is near the MET13 gene. C) Heatmaps of Met4, Met32, Met28, and Cbf1 ChIP-seq peaks in ± met conditions. The peaks were clustered into ones enriched with all four Met TFs (N = 34), enriched with Met4 and Cbf1 (N = 11), and enriched with Cbf1 only (N = 107). D) Volcano plot of RNA-seq data comparing mRNA levels in ± met conditions. Most genes near Met TFs co-binding peaks are strongly induced by met depletion (red dots). E) Single nuclei images of yeast cells expressing Met4-GFP and TetR-mCherry with a TetO array integrated near MET13 / MET6 (Met4 targets), or MAT / PUT1 (non-targeted control). Images were taken with 14 z-stacks with step size 0.4 μm. Max intensity projection (“MIP”) and “same Z” show Met4-GFP images with either maximum intensity projection among all z stacks, or with a single stack at the same z plane as “mCherry”, where the mCherry labeled TetO array shows the highest intensity. “merged” is the merged image of the “same Z” and the “mCherry”. Scale bars represent 1μm (same as in F). F) MIP of mCherry and GFP intensities. Images of each cell are aligned and centered with the mCherry dot, which represents the TetO array, and the corresponding GFP MIPs for all cells are averaged. Number of cell analyzed: MET13 +/−met (447/413), MET6 (381), MAT +met/-met (290/424), PUT1 (524). G) The GFP intensity profiles of the averaged MIP images shown in F. A line was drawn across the dot center and the GFP intensity was calculated along the line. The GFP intensity near the dot center is significantly higher for MET13 / MET6 loci in −met condition than PUT1 and MAT. Significance was calculated using two-tailed Student’s t-test (***: p<0.001).
Figure 4.
Figure 4.. Met4-dependent clustering of MET genes upon induction.
A) MTAC workflow. In a “targeted” MTAC strain, a LacO array is integrated into a genomic locus (viewpoint, VP) and recruits LacI-M.CviPI, an ectopic DNA methyltransferase that methylates the cytosine in a “GC” dinucleotide in proximal DNA. LacI-M.CviPI is also expressed in a control strain with no LacO array insertion (background methylation). Methylation in these two strains is detected by ChIP, and methylation level in nucleosome-depleted regions (NDRs) are compared in targeted vs control strains. Significantly higher methylation in the targeted strain indicates proximity to the VP. B) VP design of the MET13 locus. C) Volcano plot of MTAC signals with MET13 as VP in ±met conditions. Each dot represents an individual NDR, and colored dots are the NDRs that show proximity to the VP (significantly higher methylation in the targeted vs control strains). Local (intra-chromosomal interactions within 30kb), far-cis (intra-chromosomal interactions over 30kb), and trans (inter-chromosomal interactions) are shown in blue, green, and orange. Same as below. D) Design of Met4 depletion assay. Met4 is depleted by auxin-degron system in ±met conditions, resulting in four conditions: (1) +met, −IAA, (2) −met, −IAA, (3) +met, +IAA, (4) −met, +IAA. β-estradiol is added in all conditions to induce the expression of LacI-M.CviPI. E) Volcano plot of MTAC signals with MET6 as VP for the four conditions in panel D. Note that long-distance interactions are detected in condition (2) but are largely absent in other three conditions. F) MTAC and Met4 ChIP-seq data at the MET6 locus (VP) and MUP1, STR3 and YKG9 as interacting regions of the VP. MTAC signal is shown in the four conditions in panel D. The ChIP enrichment of Met4 is shown in ±met conditions. P, FDR-adjusted P value, Wald test by DESeq2. ns, non-significant.
Figure 5.
Figure 5.. Characterization of a MET “transcriptional hotspot” in haploid yeast.
A) Schematic of strains constructed with S.kud MET3pr-GFP reporter inserted near the MET13 transcriptional hotspot (CWC23, RSM23) and “basal” loci (ATG36, LDS2). B & C) Mean cellular GFP fluorescent intensities and GFP mRNA measured by qRT-PCR in the four strains above in ±met conditions. D) ChIP-qPCR of Rpb1 over the GFP ORF in the four strains above in −met. E & F) ChIP-qPCR of Met32 and Met4 over the S.kud MET3pr in the four strains above in −met. The asterisks represent *: <0.05, **: <0.01, ***: <0.001. Same as below.
Figure 6.
Figure 6.. Reporter activities near Met4 binding sites are enhanced over a ~40kb range.
A) Schematics of measuring the co-localization of the GFP reporter with Met4 puncta. S.kud MET3pr-fsGFP (frameshifted GFP) reporter gene and a tetO array (196x) are inserted side by side into the genome, in this case near the MET6 gene. B) Averaged MIPs of mCherry and GFP intensities near MET6 (Met4 target) and PUT1 / ATG36 (not Met4 targets) in the presence of nearby reporter. These images are generated using the same method as in Figure 3F. Scale bars represent 1μm. C) The GFP intensity profile across the dot center in panel B. For MET6 and PUT1, the same type of data without the GFP reporter (-rep) are also included. Number of cells analyzed (for panel B & C): PUT1 +/−rep (318/524), ATG36 +rep (386), MET6 +/−rep (330/381). D) Schematic of GFP reporter insertion near three additional Met4-bound loci, MET17, RMD6, and MET6. The distance and orientation of the insertion are labeled in the diagram. E) Mean GFP fluorescent intensities when S.kud MET3pr-GFP are inserted near indicated genes. The genes labeled in red have adjacent Met4-bound sites, while the ones labeled in grey do not. F) Same as in panel E except with MET17pr-GFP and GAL1Spr-GFP reporter. Strains with MET17pr-GFP were grown in −met, and the ones with GAL1Spr-GFP were pre-grown in raffinose and induced by galactose for 6 hours. G) Schematic of the MET3pr-GFP reporter inserted at various distances from the Met4 binding site near the MET6 gene. The same orientation was used for all the loci as indicated. H) Mean GFP fluorescent intensities with MET3pr-GFP and GAL1Spr-GFP reporters inserted into locations indicated in panel G, in comparison to the same reporter inserted into two control loci far from Met4 binding sites.
Figure 7.
Figure 7.. The deletion of a disordered region in Met4 reduces puncta formation and reporter expression at transcriptional hotspots.
A) PONDR disorder plot of Met4 with previously annotated functional domains, including activation domain (aa95–144) that interacts with mediator, inhibitory domain (aa188–235), auxiliary domain (aa312–375) that interacts with Met31/32, and bZIP domain (aa595–660) that interacts with Cbf1. B) Single nuclei images of cells expressing full length Met4 (±met) or Met4 with various truncations (-met) fused with GFP. C) The Fano numbers of nuclear pixel intensities for different versions of GFPs in panel B. Number of cell analyzed: Met4GFP +/−met (65/147), Free GFP (67), ΔIDR1/2/3 (172/95/172), ΔIDR2.1/2.2/2.3 (134/177/161). D) Heatmaps of full length Met4 and Met4 ΔIDR2.3 ChIP-seq in –met over previously identified Met TF binding sites. E) Alignment counts underneath the Met TF ChIP-seq peaks over the same sites for TAP tagged full length Met4 and Met4 ΔIDR2.3 (sorted from high to low). F) Volcano plot from RNA-seq data from cells containing full length Met4 or Met4 Δ IDR2.3 in −met. Genes associated with Met TFs (Fig. 3C) are indicated in red. G) Mean GFP intensities from cells expressing full length Met4 and Met4 ΔIDR2.3 with MET3pr-GFP reporter inserted into loci near (red) or far away from (black) Met4-target genes. The dashed lines represent basal reporter expression.

Similar articles

References

    1. Ahn JH, Davis ES, Daugird TA, Zhao S, Quiroga IY, Uryu H, Li J, Storey AJ, Tsai YH, Keeley DP et al. 2021. Phase separation drives aberrant chromatin looping and cancer development. Nature 595: 591–595. - PMC - PubMed
    1. Apostolou E, Thanos D. 2008. Virus Infection Induces NF-kappaB-dependent interchromosomal associations mediating monoallelic IFN-beta gene expression. Cell 134: 85–96. - PubMed
    1. Banani SF, Lee HO, Hyman AA, Rosen MK. 2017. Biomolecular condensates: organizers of cellular biochemistry. Nat Rev Mol Cell Biol 18: 285–298. - PMC - PubMed
    1. Bartlett J, Blagojevic J, Carter D, Eskiw C, Fromaget M, Job C, Shamsher M, Trindade IF, Xu M, Cook PR. 2006. Specialized transcription factories. Biochem Soc Symp doi:10.1042/bss0730067: 67–75. - DOI - PubMed
    1. Blaiseau PL, Thomas D. 1998. Multiple transcriptional activation complexes tether the yeast activator Met4 to DNA. EMBO J 17: 6327–6336. - PMC - PubMed

Publication types