[Preprint]. 2024 Feb 5:2024.02.05.578969.
doi: 10.1101/2024.02.05.578969.

Sparse CBX2 nucleates many Polycomb proteins to promote facultative heterochromatinization of Polycomb target genes

Affiliations

Sparse CBX2 nucleates many Polycomb proteins to promote facultative heterochromatinization of Polycomb target genes

Steven Ingersoll et al. bioRxiv. .

Abstract

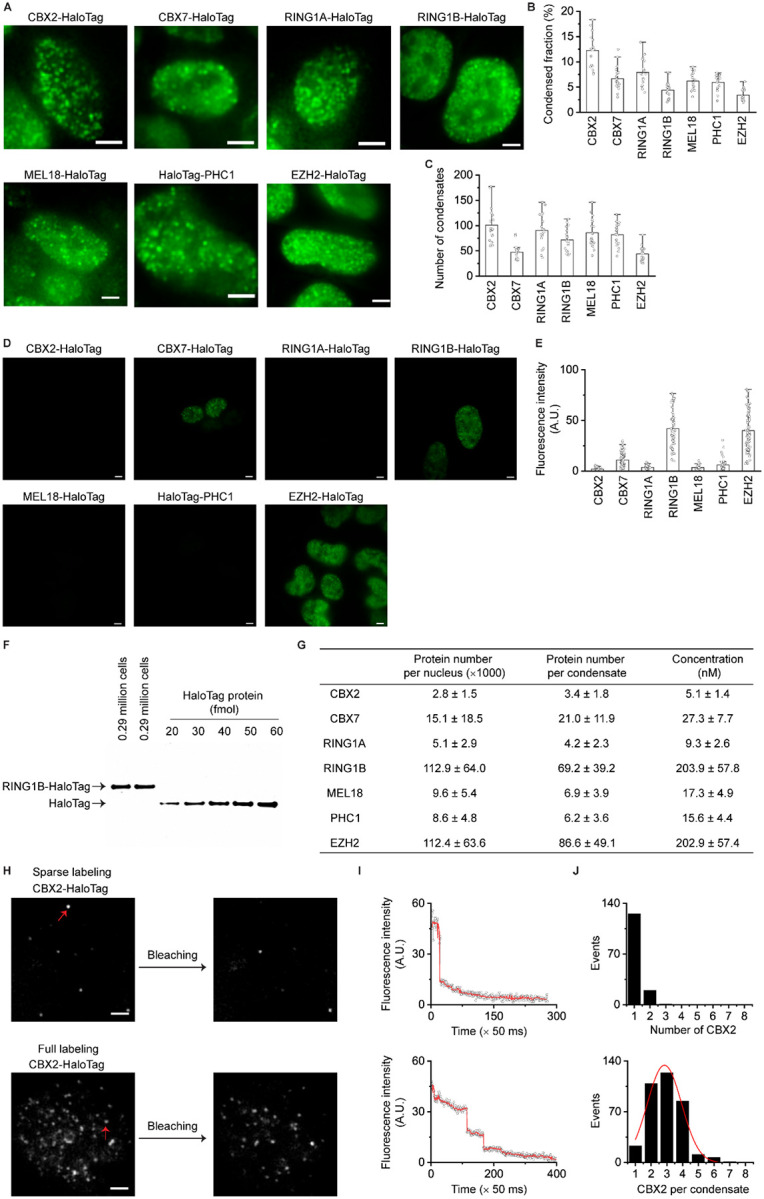
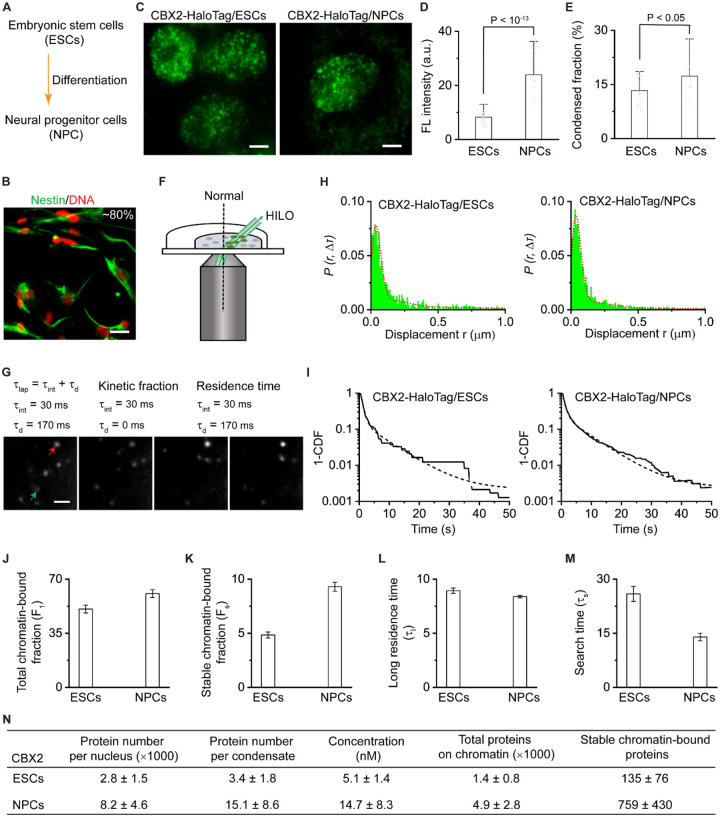
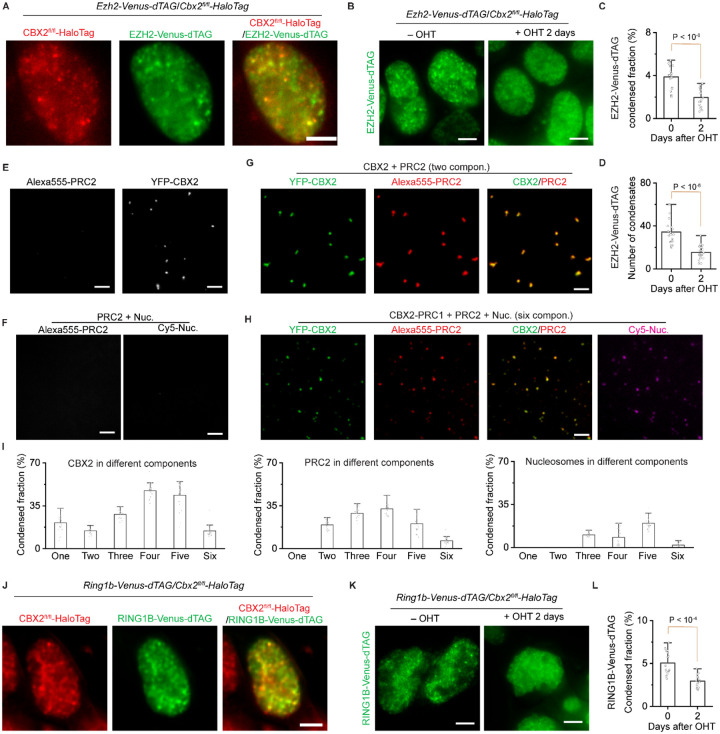
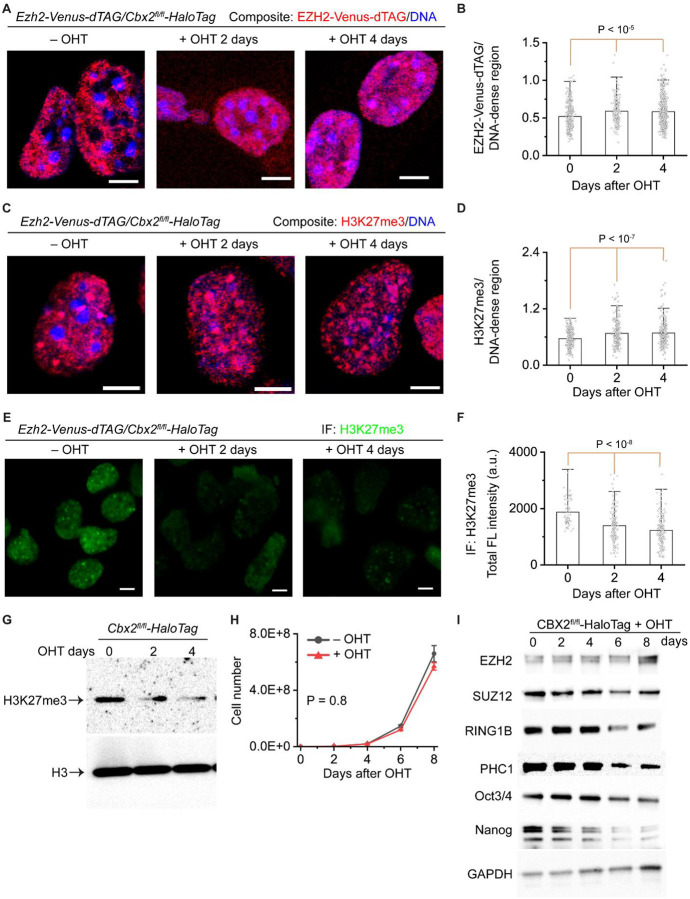
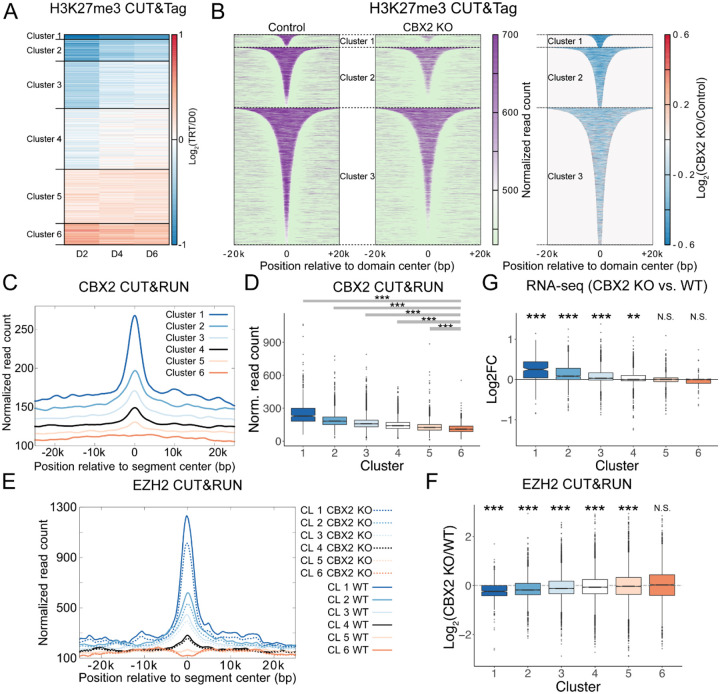
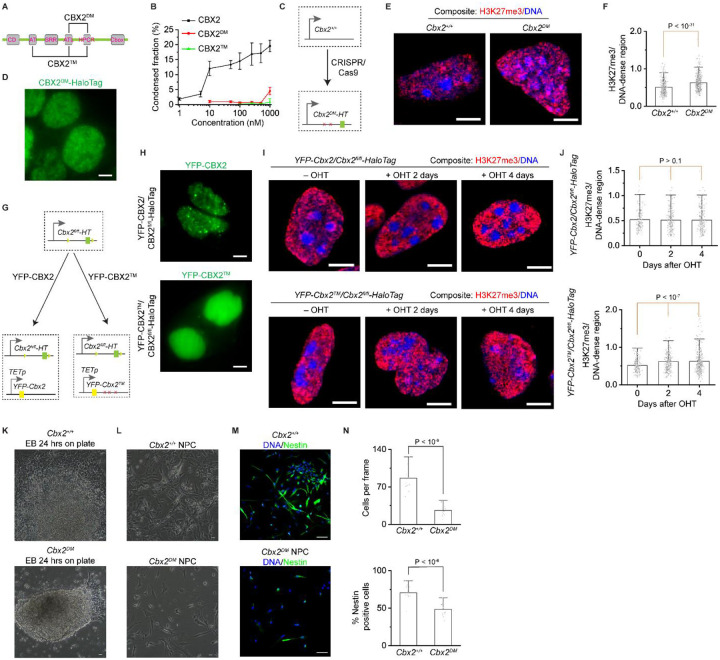
Facultative heterochromatinization of genomic regulators by Polycomb repressive complex (PRC) 1 and 2 is essential in development and differentiation; however, the underlying molecular mechanisms remain obscure. Using genetic engineering, molecular approaches, and live-cell single-molecule imaging, we quantify the number of proteins within condensates formed through liquid-liquid phase separation (LLPS) and find that in mouse embryonic stem cells (mESCs), approximately 3 CBX2 proteins nucleate many PRC1 and PRC2 subunits to form one non-stoichiometric condensate. We demonstrate that sparse CBX2 prevents Polycomb proteins from migrating to constitutive heterochromatin, demarcates the spatial boundaries of facultative heterochromatin, controls the deposition of H3K27me3, regulates transcription, and impacts cellular differentiation. Furthermore, we show that LLPS of CBX2 is required for the demarcation and deposition of H3K27me3 and is essential for cellular differentiation. Our findings uncover new functional roles of LLPS in the formation of facultative heterochromatin and unravel a new mechanism by which low-abundant proteins nucleate many other proteins to form compartments that enable them to execute their functions.

Keywords: CBX2; H3K27me3; PRC1; PRC2; Polycomb; chromatin; constitutive heterochromatin; facultative heterochromatin; liquid-liquid phase separation; live-cell single-molecule tracking; nucleation; single-molecule imaging.


Conflict of interest statement

DECLARATION OF INTERESTS The authors declare no competing financial interest.

Figures

Figure 1.
Figure 1.. ~3 CBX2 proteins per condensate in mESCs
(A) Live-cell epifluorescence images of HaloTag Polycomb fusion proteins. HaloTag was inserted into the N- or C-terminus of genetic loci of PRC1 subunits (CBX2, CBX7, RING1A, RING1B, MEL18, and PHC1) and the C-terminus of genetic loci of PRC2 subunit (EZH2) in mESCs. Micrographs were taken by using single-molecule sensitive highly inclined thin illumination (HILO) microscopy (Figure 2F) since CBX2-HaloTag was undetectable when using fluorescence microscopy without a single-molecule sensitivity (unless otherwise indicated, all epifluorescence images were taken by single-molecule HILO microscopy). To show the distribution of proteins, images were taken and presented by using different settings. Scale bar, 5.0 μm. (B) Bar overlap plot of the condensed fraction of HaloTag Polycomb fusion proteins quantified from Figure 1A. Condensed fraction is defined as the fraction of condensed proteins to total proteins within the nucleus. (C) Bar overlap plot of the number of condensates of HaloTag Polycomb fusion proteins quantified from Figure 1A. (D) Live-cell epifluorescence images of HaloTag Polycomb fusion proteins. To compare fluorescence intensities, images were taken and presented by using the same settings. Scale bar, 5.0 μm. (E) Bar overlap plot of the fluorescence intensity of HaloTag Polycomb fusion proteins quantified from Figure 1D. RING1B-HaloTag, MEL18-HaloTag, PHC1-HaloTag, and EZH2-HaloTag are heterozygous while others are homozygous. The final intensity was normalized as homozygosity. (F) Immunoblotting analysis of the RING1B-HaloTag protein extracted from mESCs and recombinant HaloTag protein with a series of dilutions. Blot was probed by using anti-HaloTag antibodies. (G) Estimated protein number per nucleus, protein number per condensate, and concentration for HaloTag Polycomb fusion proteins. Error represents standard deviation from three biological triplicates. (H) Single-molecule photobleaching of CBX2-HaloTag sparely (top) or densely fully (bottom) labelled with HaloTag ligand JF549. Cells were fixed by 4.0% paraformaldehyde and imaged at single-molecule conditions. Red arrowheads indicate fluorescent spots/condensates to be bleached. Scale bar, 5.0 μm. (I) Representative photobleaching curve. The photobleaching steps were detected by Chung-Kennedy filter (red line). The number of individual steps represents the number of proteins within a spot. (J) Histogram of single-molecule photo-bleaching steps of CBX2-HaloTag that were sparsely (top) and fully (bottom) labelled, respectively. The bottom histogram was fitted by a Gaussian function to estimate average protein number per condensate.
Figure 2.
Figure 2.. Cell-type-dependent control of the number of CBX2 proteins per condensate and of the interacting of CBX2 with chromatin
(A) Overview of experimental approaches. mESCs were differentiated into neural progenitor cells (NPCs). (B) Immunostaining of mESCs-derived NPCs by anti-Nestin antibodies. DNA was stained using Hoechst. A representative overlay image is shown. Nestin is green and Hoechst is red. Scale bar, 5.0 μm. (C) Live-cell epifluorescence images of CBX2-HaloTag in mESCs and NPCs. To show distributions, images were taken under different settings. Scale bar, 5.0 μm. (D) Bar overlap plot of the fluorescence intensity of CBX2-HaloTag in mESCs and NPCs. Images used for quantification were taken under the same settings. P value, student’s t-test with two-tailed distribution and two-sample unequal variance. (E) Bar overlap plot of the condensed fraction of CBX2-HaloTag in mESCs and NPCs. P value, student’s t-test with two-tailed distribution and two-sample unequal variance. (F) Schematic representation of single-molecule HILO microscopy used for live-cell single-molecule tracking (SMT). (G) Example images showing individual CBX2-HaloTag molecules. The red arrowhead indicates that a CBX2-Halotag molecule stays at chromatin and the green arrowhead represents that a CBX2-HaloTag molecule freely diffuses. For studies of kinetic fraction, the camera integration time is 30 ms with no dark time between camera exposures. For estimating of residence time, the integration time is 30 ms and the dark time is 170 ms. Scale bar is 5.0 μm. (H) Displacement histogram for CBX2-HaloTag in mESCs (N = 22 cells, n = 3082 displacements) and NPCs (N = 33 cells, n = 10666 displacements). The short dash red curve indicates the overall fit. (I) Survival probability distribution of the dwell times for CBX2-HaloTag in mESCs and NPCs. The distributions were fitted with a two-component exponential decay model (dotted lines). (J-K) Total chromatin-bound fraction (F1) and stable chromatin-bound fraction (Fs) for CBX2-HaloTag in mESCs and NPCs estimated from kinetic modelling of live-cell SMT data. (L-M) Long residence time (τl) and target-search time (τs) for CBX2-HaloTag in mESCs and NPCs estimated from kinetic modelling of live-cell SMT data. (N) Estimated protein number per nucleus, protein number per condensate, protein concentration in nucleus, total proteins on chromatin, and stable chromatin-bound proteins for CBX2-HaloTag in ESCs and NPCs. Error represents standard deviation. Results are from three biological triplicates.
Figure 3.
Figure 3.. Sparse CBX2 nucleates Polycomb condensates
(A) Live-cell epifluorescence images of CBX2-HaloTag (red) and EZH2-Venus-dTAG (green) in Ezh2-Venus-dTAG/Cbx2fl/fl-HaloTag dual knockin mESC lines. Overlay image is shown. Scale bar, 5.0 μm. (B) Live-cell epifluorescence images of EZH2-Venus-dTAG in Ezh2-Venus-dTAG/Cbx2fl/fl-HaloTag dual knockin mESCs before and after depletion of CBX2. CBX2 was depleted by administrating OHT for two days. Scale bar, 5.0 μm. (C) Bar overlap plot of the condensed fraction of EZH2-Venus-dTAG quantified from Figure 3B. P value, student’s t-test with two-tailed distribution and two-sample unequal variance. (D) Bar overlap plot of the number of condensates of EZH2-Venus-dTAG quantified from Figure 3B. P value, student’s t-test with two-tailed distribution and two-sample unequal variance. (E) Epifluorescence images of a one-component system of YFP-CBX2 or Alexa555-labelled PRC2 consisted of EZH2, SUZ12, EED, and RbAp46/48. When defining the number of components, solvent was not counted. For the sake of simplicity, PRC2 was defined as one component. YFP-CBX2 formed condensates but Alexa555-PRC2 did not form. YFP-CBX2 was 500 nM and Alexa555-PRC2 was 50 nM. Scale bar, 5.0 μm. (F) Epifluorescence images of a two-component system of Alexa555-PRC2 and Cy5-nucleosomes. Alexa555-PRC2 and Cy5-nucleosomes were mixed and did not appear as condensates. Alexa555-PRC2 was 50 nM and Cy5-nucleosomes were 200 nM. Scale bar, 5.0 μm. (G) Epifluorescence images of condensates of a two component-system of YFP-CBX2 and Alexa555-labelled PRC2. YFP-CBX2 and Alexa555-PRC2 were mixed. PRC2 was enriched within YFP-CBX2 condensates. YFP-CBX2 was 500 nM and Alexa555-PRC2 was 50 nM. Scale bar, 5.0 μm. (H) Epifluorescence images of condensates of a six-component system of YFP-CBX2, Alexa555-PRC2, and Cy5-nucleosomes. The system includes CBX2 (500 nM), RING1B (500 nM), MEL18 (500 nM), PHC1 (500 nM), nucleosomes (200 nM), and PRC2 (50 nM). Individual and overlay images of CBX2 and PRC2 were shown. Images of nucleosomes were also shown. Scale bar, 5.0 μm. (I) Bar overlap plot of the condensed fraction of CBX2, PRC2, and nucleosomes quantified from Figure S3G. The condensed fraction was from the systems with different components. (J) Live-cell epifluorescence images of CBX2-HaloTag (red) and RING1B-Venus-dTAG (green) in Ring1b-Venus-dTAG/Cbx2fl/fl-HaloTag dual knockin mESC lines. Overlay images were shown. Scale bar, 5.0 μm. (K) Live-cell epifluorescence images of RING1B-Venus-dTAG in Ring1b-Venus-dTAG/Cbx2fl/fl-HaloTag dual knockin mESCs upon the depletion of CBX2. CBX2 was depleted by administrating OHT for two days. Scale bar, 5.0 μm. (L) Bar overlap plot of the condensed fraction of RING1B-Venus-dTAG quantified from Figure 3K. P value, student’s t-test with two-tailed distribution and two-sample unequal variance.
Figure 4.
Figure 4.. Sparse CBX2 demarcates the spatial boundaries of facultative heterochromatin and controls the H3K27me3 level
(A) Representative confocal images of EZH2-Venus-dTAG in Ezh2-Venus-dTAG/Cbx2fl/fl-HaloTag mESCs. Cbx2 is depleted by administrating OHT. DNA was stained by Hoechst. Overlay images are shown. EZH2-Venus-dTAG is red and DNA is blue. Scale bar, 5.0 μm. (B) Bar overlap plot of the fluorescence intensity ratio of EZH2-Venus-dTAG to DNA dense regions quantified from Figure 4A. P value, student’s t-test with two-tailed distribution and two-sample unequal variance. (C) Representative confocal images of H3K27me3 immunostained by anti-H3K27me3 antibodies in Ezh2-Venus-dTAG/Cbx2fl/fl-HaloTag mESCs. Cbx2 is depleted by administrating OHT. DNA was stained by Hoechst. Overlay images are shown. H3K27me3 is red and DNA is blue. Scale bar, 5.0 μm. (D) Bar overlap plot of the fluorescence intensity ratio of H3K27me3 to DNA dense regions quantified from Figure 4C. P value, student’s t-test with two-tailed distribution and two-sample unequal variance. (E) Representative epifluorescence images of H3K27me3 in Ezh2-Venus-dTAG/Cbx2fl/fl-HaloTag mESCs treated with or without OHT. H3K27me3 was immunostained by anti-H3K27me3 antibodies. Images were taken by using the same settings. Scale bar, 5.0 μm. (F) Bar box plot of the fluorescence intensity of H3K27me3 quantified from Figure 4E. P value, student’s t-test with two-tailed distribution and two-sample unequal variance. (G) Immunoblotting of histones extracted from Ezh2-Venus-dTAG/Cbx2fl/fl-HaloTag mESCs treated with or without OHT. Blots were probed by anti-H3K27me3 antibodies and anti-H3 antibodies. (H) Growth rate of Ezh2-Venus-dTAG/Cbx2fl/fl-HaloTag mESCs treated with or without OHT. P value, student’s t-test with two-tailed distribution and two-sample unequal variance. (I) Immunoblotting of PRC2 and PRC1 proteins as well as the pluripotency factors Oct3/4 and Nanog extracted from Ezh2-Venus-dTAG/Cbx2fl/fl-HaloTag mESCs treated with or without OHT. GAPDH was used for loading control.
Figure 5.
Figure 5.. Effect of CBX2 loss on H3K27me3 domains.
(A) Changes in H3K27me3 CUT&Tag enrichment at unique segments defined by Disjoin. Log2 enrichment over Day 0 is plotted as a heatmap. (B) H3K27me3 enrichment at Day 0 (Control, left) and Day 2 of OHT treatment (CBX2 KO, middle) are plotted for domains from the clusters defined in (A). Log2 ratio of H3K27me3 enrichment in CBX2 KO over Control within the H3K27me3 domains is plotted as a heatmap (right). (C) Normalized read counts from CBX2 CUT&RUN averaged over segments of each of the six clusters defined in (A) are plotted relative to the center of the segments. (D) CBX2 CUT&RUN enrichment was calculated at each H3K27me3 segment defined in (A) and the distribution for each cluster is shown as a boxplot. Wilcox rank sum test was used to calculate the p-value for the comparison between each cluster and cluster 6 and p-values were adjusted for multiple comparisons using the Bonferroni correction. *** denotes p < 2.2e-16. (E) Normalized read counts from EZH2 CUT&RUN averaged over segments of each of the six clusters defined in (A) are plotted relative to the center of the segments. (F) Log2 ratio of EZH2 CUT&RUN enrichment in WT to that in CBX2 KO was calculated at each H3K27me3 segment defined in (A), and the distribution for each cluster is shown as a boxplot. Wilcox rank sum test was used to calculate the p-value with the null hypothesis that the log2 fold change for each cluster is 0, and p-values were adjusted for multiple comparisons using the Bonferroni correction. *** denotes p < 2.2e-16, N.S. denotes not significant (p>0.05). (G) The distribution of log2 fold change in TPM values for genes overlapping segments plotted in (A) are shown as boxplots. Wilcox rank sum test was used to calculate the p-value with the null hypothesis that the log2 fold change for each cluster is 0, and p-values were adjusted for multiple comparisons using the Bonferroni correction. *** denotes p < 2.2e-16, ** denotes p= 1.9e-08, N.S. denotes not significant (p>0.05).
Figure 6.
Figure 6.. CBX2 is needed for proper cellular differentiation
(A) Phase-contrast images of the outgrowth of day-8 EBs on gelatin-coated plates for 24 hours for wild-type (Cbx2+/+) and knockout (Cbx2−/−) cells in the presence of retinoic acid (RA). Scale bar, 100 μm. (B) Representative epifluorescence images of immunostained NPCs derived from wild-type (Cbx2+/+) and knockout (Cbx2−/−) cells under the same differentiation conditions. Cells were immunostained by anti-Nestin antibodies. DNA was stained by Hoechst. Overlay images are shown. Nestin, green color. DNA, blue color. Scale bar, 50 μm. (C) Number of cells per frame and percentage of Nestin-positive cells. Cells were derived from wild-type (Cbx2+/+) and knockout (Cbx2−/−) cells under the same differentiation conditions. P value, student’s t-test with two-tailed distribution and two-sample unequal variance. (D) Volcano plot of differentially expressed genes (DEGs) between wild-type (Cbx2+/+) and knockout (Cbx2−/−) from day-4 (left) and day-8 (right) EBs, with numbers of significantly up-regulated (red) and down-regulated (green) genes (red dots, p<0. 1, |log2 fold change|>1) shown. (E) The hierarchical clustering analysis of the DEGs between wild-type (Cbx2+/+) and knockout (Cbx2−/−) from day-8 EBs. RNA expression values (RPKM, reads per kilobase per million reads) are represented by z-score across samples. (F) Gene ontology (GO) analysis of the up-regulated and down-regulated genes from day-8 EBs with the top 10 significant GO terms and p value displayed. (G) Transcriptional activities of pluripotent genes and lineage-specific genes for differentiation of wild-type (Cbx2+/+) and knockout (Cbx2−/−) cells for different days.
Figure 7.
Figure 7.. LLPS of CBX2 demarcates the spatial boundaries of facultative heterochromatin and regulates cellular differentiation
(A) Schematic representation of the secondary structure of CBX2. CBX2DM is a variant of CBX2 where the Arg and Lys residues within ATL and HPCR have been substituted with Ala. CBX2 is a variant of CBX2 where the Arg and Lys residues within AT, ATL, and HPCR have been substituted with Ala. CD, chromodomain. AT, AT-hook motif. ATL, AT-hook-like motif. HPCR, highly positively charged region. Cbox, chromobox. (B) Plot of the condensed fraction of CBX2, CBX2DM, and CBX2 versus different protein concentrations. (C) Schematic representation of the generating of Cbx2DM-HaloTag (for the sake of simplicity, Cbx2DM-HaloTag sometimes was referred to as Cbx2DM) mESC lines by CRISPR/Cas9. (D) Live-cell epifluorescence images of CBX2DM-HaloTag in Cbx2DM-HaloTag mESCs. Scale bar, 5.0 μm. (E) Representative confocal images of H3K27me3 and DNA in wild-type and Cbx2DM-HaloTag mESCs. H3K27me3 was stained by anti-H3K27me3 antibodies, and DNA was stained by Hoechst. Composite images are shown. H3K27me3 is red, and DNA is blue. Scale bar, 5.0 μm. (F) Box overlap plot of the fluorescence intensity ratio of H3K27me3 to DNA dense regions quantified from Figure 7E. P value, student’s t-test with two-tailed distribution and two-sample unequal variance. (G) Schematic representation of the functional complementation assay. YFP-Cbx2 and YFP-Cbx2TM were stably integrated into the genome of Cbx2fl/fi-HaloTag mESCs, respectively. (H) Live-cell epifluorescence images of YFP-CBX2 in YFP-Cbx2/Cbx2fl/fi-HaloTag mESCs and YFP-CBX2 in YFP-Cbx2TM/Cbx2fl/fi-HaloTag mESCs, respectively. Scale bar, 5.0 μm. (I) Representative confocal images of H3K27me3 and DNA in YFP-Cbx2/Cbx2fl/fl-HaloTag and YFP-Cbx2TM/Cbx2fl/fl-HaloTag mESCs, respectively. Cells were treated with or without OHT for different time periods. Composite images are shown with DNA being blue color and H3K27me3 as red color. H3K27me3 was immunostained by anti-H3K27me3 antibodies. DNA was stained by Hoechst. Scale bar, 5.0 μm. (J) Bar overlap plot of the fluorescent intensity ratio of H3K27me3 to DNA-dense regions in YFP-Cbx2/Cbx2fl/fl-HaloTag and YFP-Cbx2TM/Cbx2fl/fl-HaloTag mESCs quantified from Figure 7I. (K) Phase-contrast images of the outgrowth of day-8 EBs derived from wild-type and Cbx2DM-HaloTag cells on gelatin-coated plates for 24 hours. Scale bar, 100 μm. (L) Phase-contrast images of NPC derived from wild-type and Cbx2DM-HaloTag cells. Scale bar, 100 μm. (M) Representative epifluorescence images of immunostained NPCs derived from wild-type and Cbx2DM-HaloTag cells. Cells were immunostained by anti-Nestin antibodies. DNA was stained by Hoechst. Overlay images are shown with Nestin being green and DNA being blue. Scale bar, 100 μm. (K) Bar overlap plot of the number of cells per frame and percentage of Nestin-positive cells. P value, student’s t-test with two-tailed distribution and two-sample unequal variance.

Similar articles

References

    1. Zylicz J.J., and Heard E. (2020). Molecular Mechanisms of Facultative Heterochromatin Formation: An X-Chromosome Perspective. Annu Rev Biochem 89, 255–282. 10.1146/annurev-biochem-062917-012655. - DOI - PubMed
    1. Trojer P., and Reinberg D. (2007). Facultative heterochromatin: is there a distinctive molecular signature? Mol Cell 28, 1–13. 10.1016/j.molcel.2007.09.011. - DOI - PubMed
    1. Grewal S.I.S. (2023). The molecular basis of heterochromatin assembly and epigenetic inheritance. Mol Cell 83, 1767–1785. 10.1016/j.molcel.2023.04.020. - DOI - PMC - PubMed
    1. Piunti A., and Shilatifard A. (2021). The roles of Polycomb repressive complexes in mammalian development and cancer. Nat Rev Mol Cell Biol 22, 326–345. 10.1038/s41580-021-00341-1. - DOI - PubMed
    1. Kuroda M.I., Kang H., De S., and Kassis J.A. (2020). Dynamic Competition of Polycomb and Trithorax in Transcriptional Programming. Annu Rev Biochem 89, 235–253. 10.1146/annurev-biochem-120219-103641. - DOI - PMC - PubMed

Publication types