. 2024 Mar 19;9(3):e0121423.
doi: 10.1128/msystems.01214-23. Epub 2024 Feb 16.

Intestinal lysozyme1 deficiency alters microbiota composition and impacts host metabolism through the emergence of NAD+-secreting ASTB Qing110 bacteria

Affiliations

Intestinal lysozyme1 deficiency alters microbiota composition and impacts host metabolism through the emergence of NAD+-secreting ASTB Qing110 bacteria

Chengye Zhang et al. mSystems. .

Abstract

The intestine plays a pivotal role in nutrient absorption and host defense against pathogens, orchestrated in part by antimicrobial peptides secreted by Paneth cells. Among these peptides, lysozyme has multifaceted functions beyond its bactericidal activity. Here, we uncover the intricate relationship between intestinal lysozyme, the gut microbiota, and host metabolism. Lysozyme deficiency in mice led to altered body weight, energy expenditure, and substrate utilization, particularly on a high-fat diet. Interestingly, these metabolic benefits were linked to changes in the gut microbiota composition. Cohousing experiments revealed that the metabolic effects of lysozyme deficiency were microbiota-dependent. 16S rDNA sequencing highlighted differences in microbial communities, with ASTB_g (OTU60) highly enriched in lysozyme knockout mice. Subsequently, a novel bacterium, ASTB Qing110, corresponding to ASTB_g (OTU60), was isolated. Metabolomic analysis revealed that ASTB Qing110 secreted high levels of NAD+, potentially influencing host metabolism. This study sheds light on the complex interplay between intestinal lysozyme, the gut microbiota, and host metabolism, uncovering the potential role of ASTB Qing110 as a key player in modulating metabolic outcomes.

Importance: The impact of intestinal lumen lysozyme on intestinal health is complex, arising from its multifaceted interactions with the gut microbiota. Lysozyme can both mitigate and worsen certain health conditions, varying with different scenarios. This underscores the necessity of identifying the specific bacterial responses elicited by lysozyme and understanding their molecular foundations. Our research reveals that a deficiency in intestinal lysozyme1 may offer protection against diet-induced obesity by altering bacterial populations. We discovered a strain of bacterium, ASTB Qing110, which secretes NAD+ and is predominantly found in lyz1-deficient mice. Qing110 demonstrates positive effects in both C. elegans and mouse models of ataxia telangiectasia. This study sheds light on the intricate role of lysozyme in influencing intestinal health.

Keywords: Lyz1; NAD+; aging; gut microbiota; metabolism.


Conflict of interest statement

The authors declare no conflict of interest.

Figures
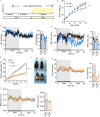
Fig 1
Fig 1
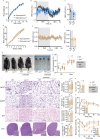
Improved metabolic phenotype of Lyz1−/− mice on different diets compared to WT controls. (a) Schematic representation of the feeding scheme. (b) Weekly monitoring of body weight from the 4th week after birth for Lyz1−/− and WT control mice (n = 9 ~ 10 mice per group). (c) 10-week-old mice’s energy expenditure plotted over a 24-h period. (d) 10-week-old mice’s respiratory exchange ratio (RER) plotted over a 24-h period. (e) Body weight measurements were taken every 3 days after transitioning mice to a high-fat diet at 12 weeks of age (n = 20 mice per group). (f) Comparison of representative WT (left) and Lyz1−/− (right) mice after 7 weeks of high-fat diet feeding. (g) Energy expenditure of 19-week-old mice on a high-fat diet plotted over a 24-h period. (h) Respiratory exchange ratio of 19-week-old mice on a high-fat diet plotted over a 24-h period. Mean values are presented with error bars indicating the standard error of the mean (SEM) in panels (b, e). In panels (c, d, g, h), individual data points are represented by symbols, with the means (±SEM) displayed. Statistical analysis was conducted using two-way ANOVA with Bonferroni’s multiple comparisons test for panels (b, e), and one-way ANOVA with Tukey’s multiple comparisons test for panels (c, d, g, h). "NS" indicates no significant difference (P > 0.05), while asterisks denote significance levels: *P < 0.05, ***P < 0.001, ****P < 0.0001. The data shown are representative of results obtained from at least three independent experiments.
Fig 2
Fig 2
Impact of cohousing on metabolic benefits of Lyz1−/− mice. (a) Weekly monitoring of body weight from the 4th week after birth for cohoused WT and Lyz1−/− mice (n = 14 mice per group). (b) RER of cohoused 10-week-old WT and Lyz1−/− mice plotted over a 24-h period (n = 4 mice per group). (c) Average RER of cohoused 10-week-old WT and Lyz1−/− mice during the light and dark periods. (d) Body weight measurements were taken every 3 days after cohoused mice were placed on an HFD at the age of week 12 (n = 14 mice per group). (e) RER of cohoused 19-week-old WT and Lyz1−/− mice on HFD plotted over a 24-h period (n = 4 mice per group). (f) Average RER of cohoused 19-week-old WT and Lyz1−/− mice on HFD during the light and dark periods. (g) Photographs comparing separately housed and cohoused mice after 7 weeks on HFD. Representative images of the liver, subcutaneous adipose tissue (SAT), visceral adipose tissue (VAT), and brown adipose tissue (BAT) from these groups. (h) Quantitative estimation of fat tissue mass and lean tissue mass evaluated by whole-body EchoMRI analysis of WT and Lyz1−/− mice, separately housed or cohoused, on HFD. (i) Representative H&E-stained images of perigonadal VAT (pgVAT), inguinal SAT (ingSAT), BAT, and liver from WT and Lyz1−/− mice, separately housed or cohoused, on HFD (scale bar = 100 µm). (j) Relative adipocyte area of pgVAT. (k) Relative adipocyte area of ingSAT. (l) Relative lipid droplet covered area in BAT. (m) Levels of triglycerides determined biochemically in the livers of different mice. (n) Number of crown-like structures (CLS) in pgVAT. (o) Plasma glucose concentration and mean area under the curve measured during an intraperitoneal glucose tolerance test (ipGTT) in different groups of mice fed with HFD (n = 7 ~ 9 mice per group). (p) Plasma glucose concentration and mean area under the curve measured during an insulin tolerance test (ITT) in different groups of mice fed with HFD (n = 10 ~ 12 mice per group). Mean values are presented with error bars indicating SEM in panels (a, b, d, e, j, k, o, p). Means (±SEM) are plotted with each symbol representing an individual animal in panels (c, f, h, l-n). Statistical analysis was conducted using one-way ANOVA with Tukey’s multiple comparisons test in panels (c, f, j-p) or two-way ANOVA with Tukey’s multiple comparisons test in panel (h). “NS” indicates no significant difference (P > 0.05), while asterisks denote significance levels: *P < 0.05, **P < 0.01, ****P < 0.0001. The data presented are representative of results from at least three independent experiments.
Fig 3
Fig 3
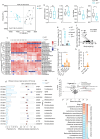
Differential microbial composition in WT and Lyz1−/− mice. (a) Weighted UniFrac distance analysis of operational taxonomic units (OTUs) in fecal samples collected from SFD-fed WT and Lyz1−/− mice, showing separation in gut microbiota composition among the groups based on distance analysis. Each dot represents an individual mouse. (b) Diversity analysis with Shanon index, Simpson index, Ace index, and Chao index of OTUs in fecal samples collected from SFD-fed WT and Lyz1−/− mice. (c) Heatmap depicting the abundance of the top 25 OTUs in SFD-fed WT and Lyz1−/− mice. Averages for multiple mice at each group and time point are presented, and the heatmap is based on log10-normalized counts. (d) Relative abundance and statistical description of the top 15 enriched OTUs. (e) Real-time PCR analysis of Qing110 in fecal samples from WT and Lyz1−/−, separately housed or cohoused. The relative abundance of Qing110 was quantified by normalizing it to total bacteria. (f) Pearson’s correlation analysis between Qing110 abundance and body weight. (g) Real-time PCR analysis of Qing110 in fecal samples from Lyz1−/− mice on SFD and HFD. The relative abundance of Qing110 was quantified by normalizing it to total bacteria, and the relative abundance of Qing110 on HFD was normalized to the relative abundance of Qing110 on SFD. (h) Real-time PCR analysis of Qing110 in fecal samples from WT mice treated with PBS or Qing110 for 1 month. The relative abundance of Qing110 was quantified by normalizing to total bacteria. (i) Analysis of metabolites in supernatants of ASTB Qing110 and the control Allobaculum. (j) Heatmaps displaying NAD+ levels in culture medium from common intestinal commensal bacteria. The data presented are representative of results from at least three independent experiments. Mean values are presented with error bars indicating SEM in panels (b, d). Means (±SEM) are plotted with each symbol representing an individual animal in panel (e, g, h). Statistical analysis was conducted using two-tailed Student’s t-tests in panel (b, h), multiple t-tests in panel (I), or one-way ANOVA with Tukey’s multiple comparisons test in panel (e, g). “NS” indicates no significant difference (P > 0.05), while asterisks denote significance levels: *P < 0.05, **P < 0.01, ***P < 0.001, ****P < 0.0001.
Fig 4
Fig 4
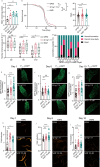
Qing110 supplementation enhances lifespan, health span, and mitochondrial function in the C. elegans model. (a) Measurement of NAD+ levels in day 3 adult N2 worms treated with E. coli OP50, Qing110, and NAD+ at concentrations of 50 µM and 500 µM, respectively. (b) Survival curve and lifespan of N2 worms treated with E. coli OP50, Qing110, and NAD+ starting at the L4 stage (n ≥ 90 worms for each group). (c) Crawling activity analysis by counting the number of sine waves (≥1 mm) that N2 worms crawled out in 30 s on days 2, 6, and 12. (d) Classification of locomotion ability in N2 worms on days 8, 12, and 16 (n > 20 worms for each group). (e) Images and relative GFP quantification of mitochondrial content in a muscle reporter strain (pmyo-3mito::GFP) on day 1 of adulthood. (f) Images and relative GFP quantification of mitochondrial content in pmyo-3mito::GFP on day 6. (g) Images and relative GFP quantification of mitochondrial content in pmyo-3mito::GFP on day 10. (h) Images and relative fluorescence quantification of mitochondrial membrane potential by staining with tetramethylrhodamine ethyl ester (TMRE) dye in day 1 adults. (i) Images and relative fluorescence quantification of TMRE in day 6 adults. (j) Images and relative fluorescence quantification of TMRE in day 10 adults. Mean values are presented with error bars indicating SEM in panel (a). Means (±SEM) are plotted with each symbol representing an individual animal in panels (b, c, e-j). Statistical analysis was conducted using one-way ANOVA with Tukey’s multiple comparisons test in panels (a, b, e-j), Log-rank (Mantel-Cox) test in panel (b), or two-way ANOVA with Tukey’s multiple comparisons test in panel (c). “NS” indicates no significant difference (P > 0.05), while asterisks denote significance levels: *P < 0.05, **P < 0.01, ***P < 0.001, ****P < 0.0001. The data presented in panels (a, e-j) are representative of results from at least two independent experiments.
Fig 5
Fig 5
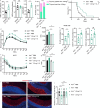
Qing110 supplementation exerts metabolic benefits and extends lifespan in the ataxia telangiectasia mouse model. (a) Measurement of NAD+, NADH, and NAD(H) levels in small intestinal epithelial cells after treatment with Qing110 and glycerol via oral gavage for 2 weeks. (b) The number of mice with thymus greater than 100 mg in 100-day-old Atm−/− mice treated with PBS or Qing110 (n = 18–19 mice/group). (c) Kaplan-Meier survival curves of Atm−/− mice, PBS- or Qing110-treated. Atm−/− mice were exposed to Qing110 or PBS from 3 weeks of age and lifespan was determined (n = 15–17 mice/group). (d) Plasma glucose profiles were measured during an oral glucose tolerance test (OGTT) in Atm+/+ and Atm−/− mice, PBS- or Qing110-treated (n = 11–12 mice/group). (e) Mean OGTT area under the curve measured in (d). (f) Plasma glucose profiles were measured during an insulin tolerance (ITT) in Atm+/+ and Atm−/− mice, PBS- or Qing110-treated (n = 5–9 mice/group). (g) Mean ITT area under the curve measured in (f). (h) The abundance of B-cell and T-cell subsets (CD4+ and CD8+) in peripheral blood was examined by flow cytometry and compared between Atm−/− mice treated with PBS or Qing110. (i) Confocal microscopy images of the Purkinje cells in the cerebellum of 3-month-old Atm+/+ and Atm−/− mice, PBS- or Qing110-treated (n = 3 ~ 5 mice/group). Scale bar = 100 µm. (j) Quantification of the numbers of Purkinje cells/100 µm (n = 3–5 mice/group). Mean values are presented with error bars indicating SEM in panels (d-g, j). Means (±SEM) are plotted with each symbol representing an individual animal in panels (a, h). Statistical analysis was conducted using two-tailed Student’s t-tests in panels (a, h), a one-sided chi-square test in panel (b), the log-rank (Mantel-Cox) test in panel (c), or one-way ANOVA with Tukey’s multiple comparisons test in panels (e, g, j). “NS” indicates no significant difference (P > 0.05), while asterisks denote significance levels: *P < 0.05, **P < 0.01, ***P < 0.001, ****P < 0.0001. The data presented in panels (d-g) are representative of results from at least two independent experiments.

Similar articles

References

    1. Cai R, Cheng C, Chen J, Xu X, Ding C, Gu B. 2020. Interactions of commensal and pathogenic microorganisms with the mucus layer in the colon. Gut Microbes 11:680–690. doi:10.1080/19490976.2020.1735606 - DOI - PMC - PubMed
    1. Bevins CL, Salzman NH. 2011. Paneth cells, antimicrobial peptides and maintenance of intestinal homeostasis. Nat Rev Microbiol 9:356–368. doi:10.1038/nrmicro2546 - DOI - PubMed
    1. Cash HL, Whitham CV, Behrendt CL, Hooper LV. 2006. Symbiotic bacteria direct expression of an intestinal bactericidal lectin. Science 313:1126–1130. doi:10.1126/science.1127119 - DOI - PMC - PubMed
    1. Vaishnava S, Yamamoto M, Severson KM, Ruhn KA, Yu X, Koren O, Ley R, Wakeland EK, Hooper LV. 2011. The antibacterial lectin RegIIIgamma promotes the spatial segregation of microbiota and host in the intestine. Science 334:255–258. doi:10.1126/science.1209791 - DOI - PMC - PubMed
    1. Jang KK, Heaney T, London M, Ding Y, Putzel G, Yeung F, Ercelen D, Chen Y-H, Axelrad J, Gurunathan S, Zhou C, Podkowik M, Arguelles N, Srivastava A, Shopsin B, Torres VJ, Keestra-Gounder AM, Pironti A, Griffin ME, Hang HC, Cadwell K. 2023. Antimicrobial overproduction sustains intestinal inflammation by inhibiting Enterococcus colonization. Cell Host Microbe 31:1450–1468. doi:10.1016/j.chom.2023.08.002 - DOI - PMC - PubMed

LinkOut - more resources