. 2024 Feb 16;10(7):eadj1290.
doi: 10.1126/sciadv.adj1290. Epub 2024 Feb 14.

Nutrient availability regulates the secretion and function of immune cell-derived extracellular vesicles through metabolic rewiring

Affiliations

Nutrient availability regulates the secretion and function of immune cell-derived extracellular vesicles through metabolic rewiring

Yizhuo Wang et al. Sci Adv. .

Abstract

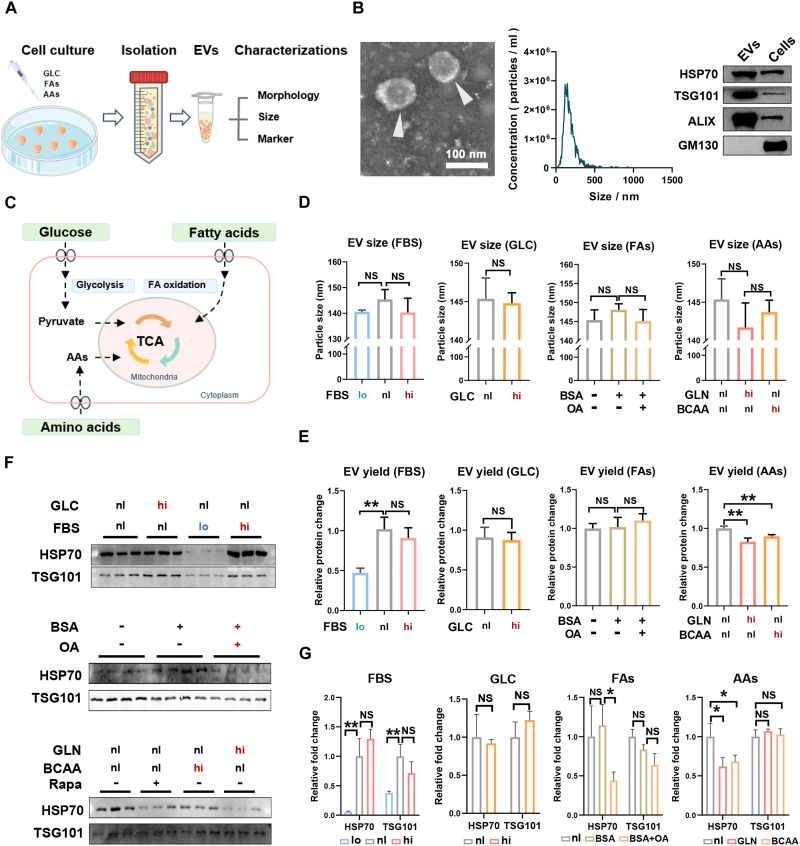
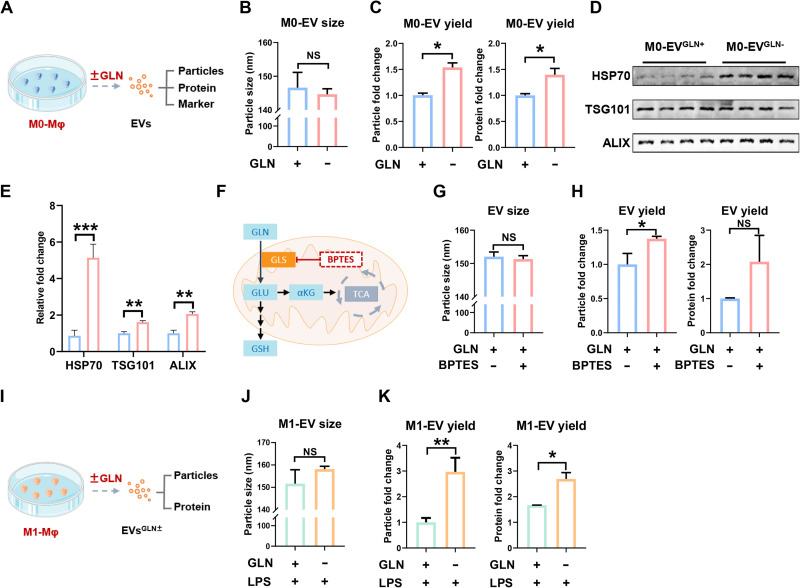
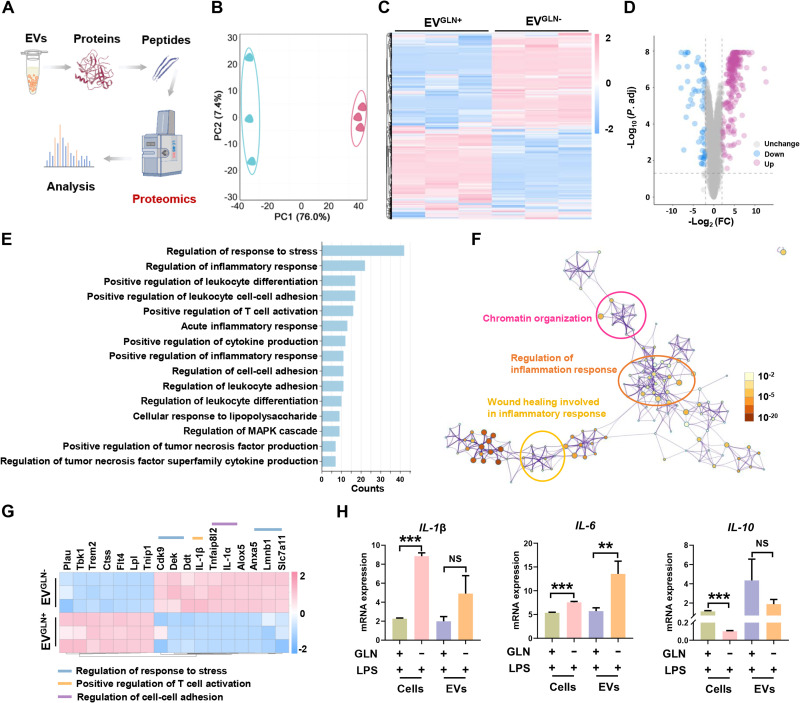
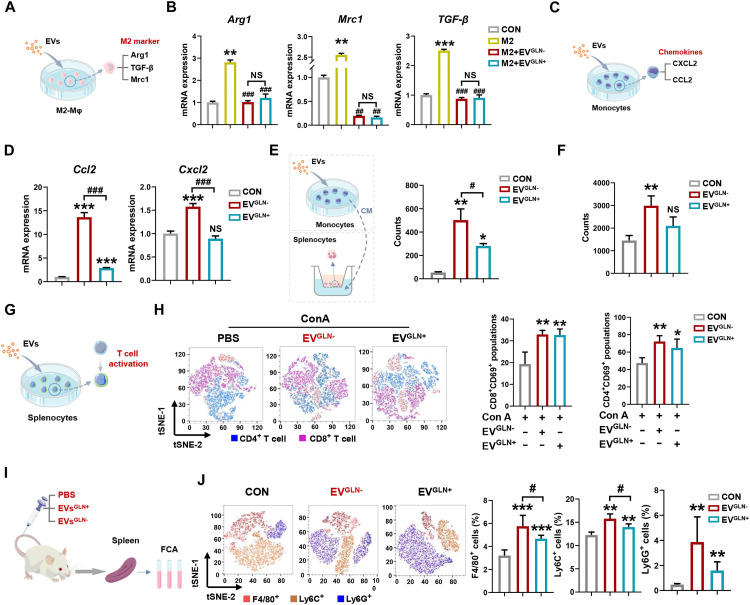
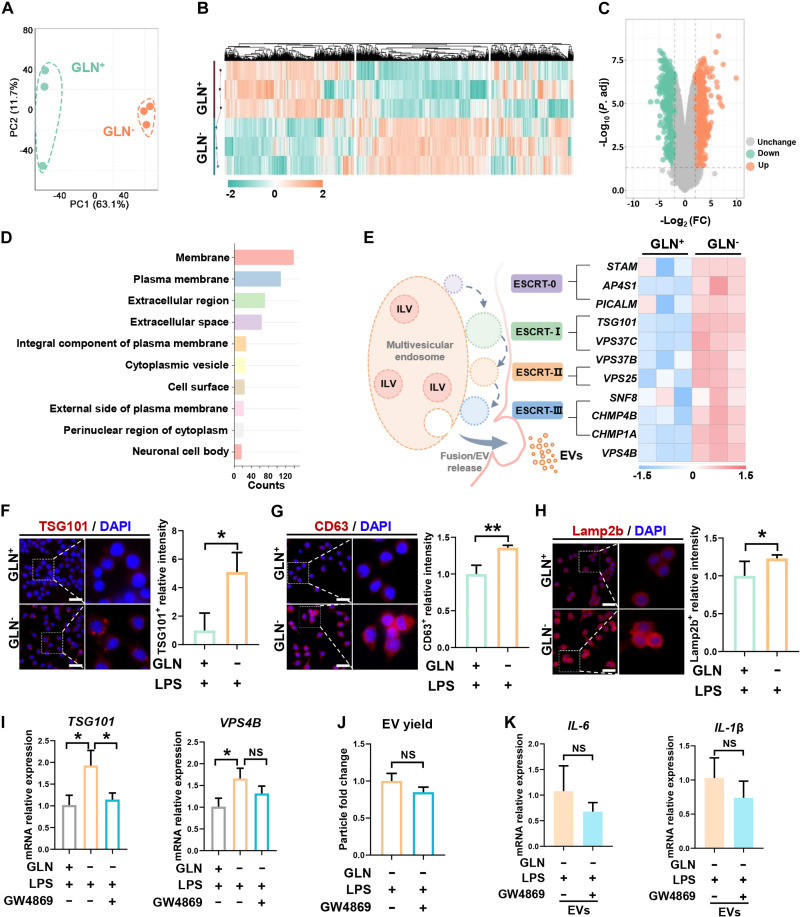
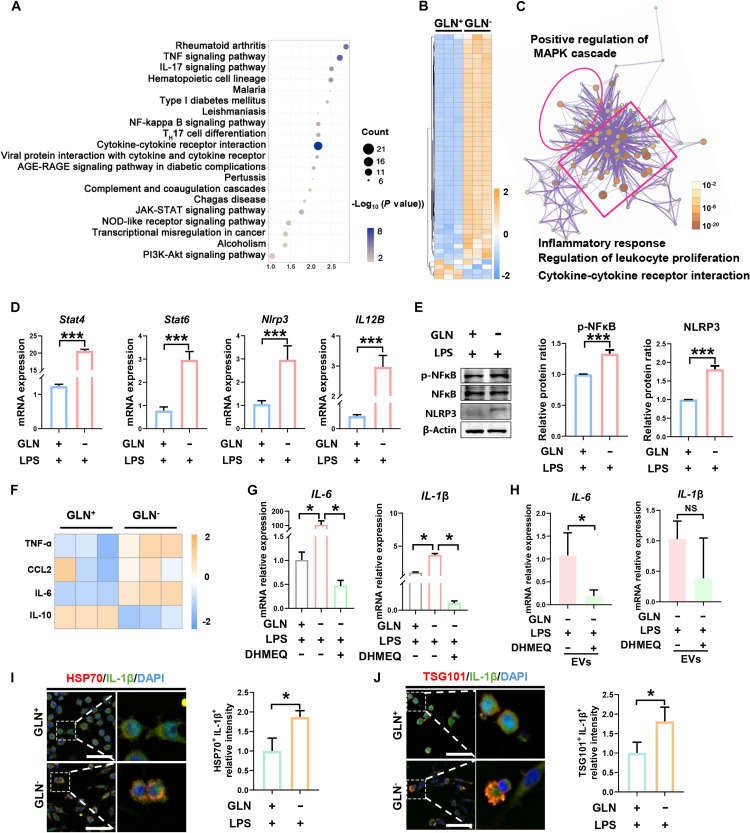
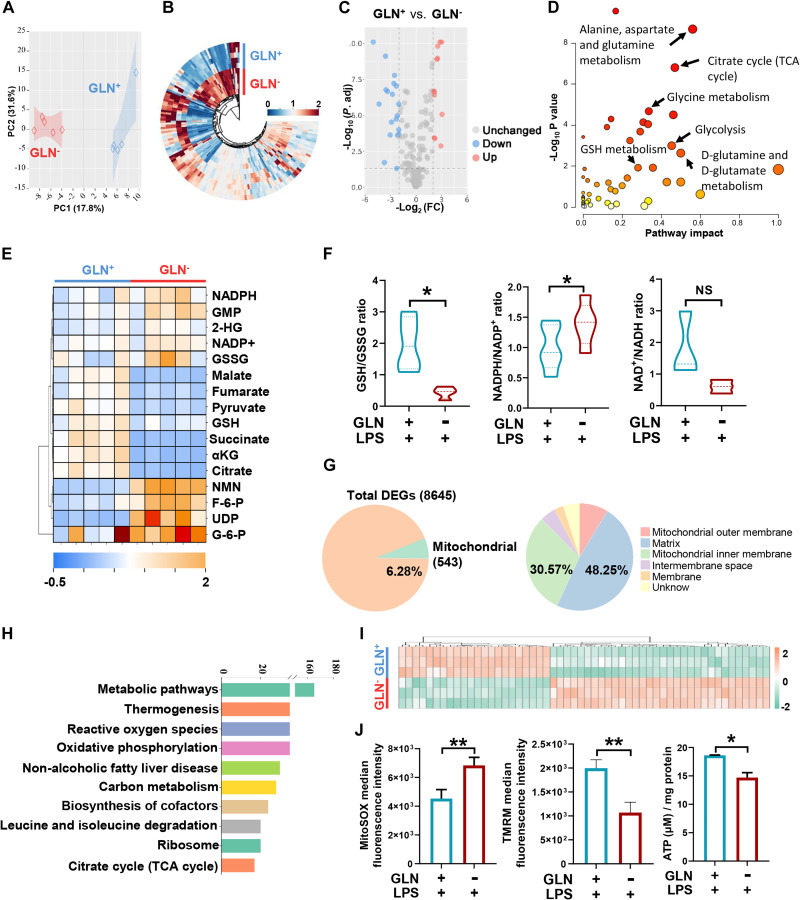
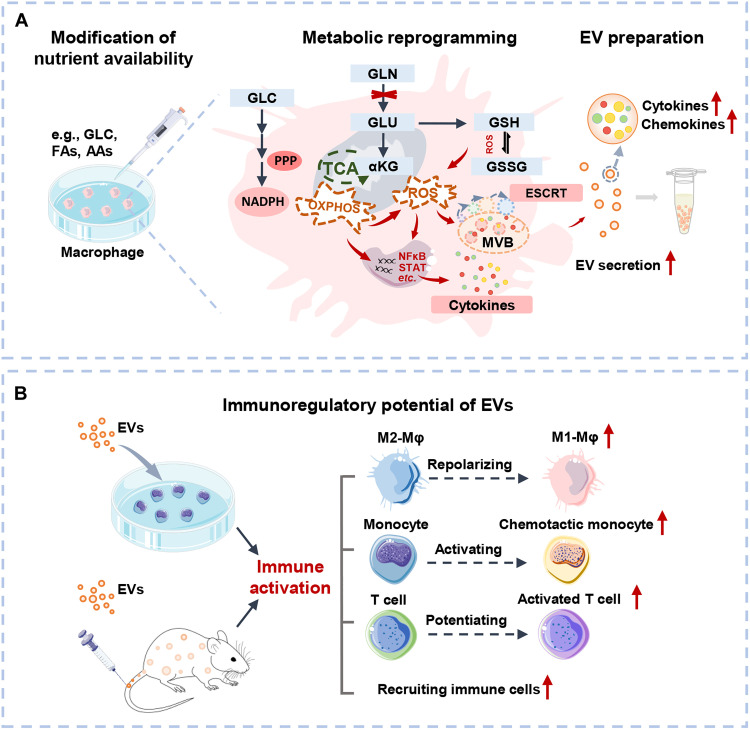
Extracellular vesicle (EV)-based immunotherapeutics have emerged as promising strategy for treating diseases, and thus, a better understanding of the factors that regulate EV secretion and function can provide insights into developing advanced therapies. Here, we report that nutrient availability, even changes in individual nutrient components, may affect EV biogenesis and composition of immune cells [e.g., macrophages (Mφs)]. As a proof of concept, EVs from M1-Mφ under glutamine-depleted conditions (EVGLN-) had higher yields, functional compositions, and immunostimulatory potential than EVs from conventional GLN-present medium (EVGLN+). Mechanistically, the systemic metabolic rewiring (e.g., altered energy and redox metabolism) induced by GLN depletion resulted in up-regulated pathways related to EV biogenesis/cargo sorting (e.g., ESCRT) and immunostimulatory molecule production (e.g., NF-κB and STAT) in Mφs. This study highlights the importance of nutrient status in EV secretion and function, and optimizing metabolic states and/or integrating them with other engineering methods may advance the development of EV therapeutics.


Figures

Fig. 1.
Fig. 1.. Effect of nutrient availability on EV secretion in Mφs.
(A) Schematic illustration of the EV isolation and characterization process. (B) Representative TEM images of EV preparations (left), size distributions of EVs measured by NTA (middle), and Western blot analysis of EV markers (ALIX, HSP70, TSG101, and GM130; right). (C) Schematic illustration of major cellular nutrient components. (D) EV sizes determined by NTA from Mφs cultured in control medium (nl) or modified medium supplemented with 2.5% FBS (lo), 20% FBS (hi), GLC (9 mM, hi), OA (100 μM, hi), BCAA (5 mM, hi), or GLN (8 mM, hi) for 24 hours. (E) Relative EV yields of the different groups were quantified by normalizing the EV protein mass to the cell protein mass. (F) Western blot analysis of the expression of EV markers (HSP70 and TSG101) in equal amounts of EV samples with equal protein amounts (10 μg per panel). (G) Quantification of the expression of EV-positive markers (HSP70 and TSG101) in various groups. BSA was used as a carrier to prepare the OA solution, while BSA alone served as the vehicle control (n ≥ 3; **P < 0.01, *P < 0.05, NSP ≥ 0.05 versus the “nl” group).
Fig. 2.
Fig. 2.. Effect of GLN conditions on Mφ-derived EV secretion.
(A and B) Schematic illustrating GLN experiments in M0-Mφs and the sizes of EVs from M0-Mφs cultured with GLN (GLN+, 2 mM) or without GLN (GLN) for 24 hours. (C) EV yield of different groups determined by the EV number/cell protein ratio (left) or the EV protein/cell protein ratio (right). (D and E) Western blot analysis and the expression of EV markers (HSP70, TSG101, and ALIX) in equal amounts of EVs (10 μg per panel, n = 4). (F and G) Schematic map of the GLN catabolism inhibition experiment and EV sizes from M0-Mφs cultured in GLN+ medium with or without BPTES (10 nM) treatment for 24 hours. (H) EV yield of different groups determined by the EV number/cell protein ratio (left) or the EV protein/cell protein ratio (right). (I and J) Schematic illustrating GLN experiments in M1-Mφs and EV sizes from M1-Mφs cultured with GLN (GLN+, 2 mM) or without GLN (GLN) for 24 hours. (K) EV yield of different groups determined by the EV number/cell protein ratio (left) or the EV protein/cell protein ratio (right) (n = 3; relative to the “GLN+” group; ***P < 0.001, **P < 0.01, *P < 0.05, NSP ≥ 0.05 versus the GLN+ group).
Fig. 3.
Fig. 3.. Effect of GLN conditions on M1-EV composition.
(A) Schematic illustrating the EV proteomics experiments. (B) PCA scatterplot of different groups based on proteomic data showing the differences between different groups (n = 3). (C) Heatmap displaying variations in protein composition between the EVGLN+ group and the EVGLN− group (n = 3). (D) Volcano plots showing the DEPs (FC > 1.5 and P-adjusted < 0.05) between the EVGLN+ group and the EVGLN− group (n = 3). (E and F) GO enrichment analysis and interaction network analysis of DEPs in response to GLN conditions (FC > 1.5). (G) Heatmap illustrating specific immune processes related to DEPs in different groups (FC > 1.5). (H) qPCR analysis of cytokine (IL-1β, IL-6, and IL-10) gene expression in M1-Mφs or M1-EVs from the GLN+ or GLN group (n = 3; ***P < 0.001, **P < 0.01, *P < 0.05, NSP ≥ 0.05 versus the GLN+ group).
Fig. 4.
Fig. 4.. Immunostimulatory effects of M1-EVs from GLN conditions.
(A and B) M2-Mφs were induced by IL-4/TGF-β (20 ng/ml each), and qPCR analysis was conducted to measure the expression of the M2 gene (Arg1, Mrc1, and TGF-β) expression in M2-Mφs treated with EVGLN− (20 μg/ml) or EVGLN+ (20 μg/ml) for 48 hours (n = 3; ***P < 0.001, **P < 0.01, ##P < 0.01, ###P < 0.01 versus the M2 group). (C and D) qPCR analysis of chemokine gene expression (Ccl2 and Cxcl2) in THP-1 monocytes treated with EVGLN− preparations or EVGLN+ preparations (20 μg/ml) for 24 hours (n = 3; ***P < 0.001, **P < 0.01 versus the “CON” group). (E and F) Chemotaxis evaluation of (E) conditioned culture medium from EV pretreated THP-1 cells and (F) EVs from splenocytes using a Transwell system, and the migrated cells in the lower chamber were counted using FCA (n = 3; **P < 0.01, *P < 0.05 versus the CON group). (G and H) Mouse splenocytes were treated with ConA or ConA plus EVGLN− or EVGLN+ (20 μg/ml) for 72 hours, and the populations of activated CD4+ T cells and (CD3+CD4+CD69+) activated CD8+ T cells (CD3+CD8+CD69+) were determined by FCA (n = 3). (I and J) Evaluation of immune responses in mice (n = 5) intravenously injected with EVGLN− or EVGLN+ (30 μg/mouse) for 4 hours and immune cell populations (F4/80+ Mφs, Ly6C+ monocytes, and Ly6G+ neutrophils) in the spleen were analyzed using FCA (**P < 0.01, *P < 0.05 versus the CON group).
Fig. 5.
Fig. 5.. Effect of GLN conditions on EV biogenesis in M1-like Mφs.
(A) PCA scatterplot based on RNA-seq data of M1-Mφs treated with GLN+ (2 mM) or without GLN (GLN) for 24 hours. (B) Heatmap showing the different gene expression profiles in the different groups. (C) Volcano plot showing DEGs (P-adjusted < 0.05) between groups. (D) GO enrichment analysis of DEGs (FC > 1.5, top 10) in response to GLN conditions. (E) Schematic illustrating the ESCRT machinery and heatmap showing ESCRT gene expression in the different groups. (F to H) Representative images and quantification of TSG101+ early endosomes, CD63+ MVBs, and Lamp2b+ late endosomes in M1-Mφs under GLN conditions (scale bar, 50 μm). (I) qPCR analysis of TSG101 and VPS4B gene expression in M1-Mφ under GLN conditions cotreated with GW4869 for 24 hours. (J) EV yield determined by the EV/cell protein ratio after GW4869 treatment. (K) qPCR analysis of cytokine gene expression (e.g., IL-6 and IL-1β) in EVGLN− after GW4869 treatment (n = 3; **P < 0.01, *P < 0.05 versus the GLN group).
Fig. 6.
Fig. 6.. Effect of GLN conditions on immunoregulatory cargo synthesis in Mφs.
(A) KEGG enrichment analysis of DEGs (FC > 1.5) in M1-Mφs under GLN conditions for 24 hours. (B) Heatmap showing the differential expression levels of immune-related genes in the different groups. (C) Interaction network analysis of DEGs in response to GLN conditions. (D) qPCR analysis of Stat4, Stat6, IL-12B, and Nlrp3 gene expression in Mφs from the different groups. (E) Western blot analysis and quantification of inflammatory pathway proteins (NF-κB and NLRP3) in Mφs from the different groups (n = 3). (F) Luminex assay measuring cytokine (TNF-α, IL-6, and IL-10) and chemokine (CCL2) levels in culture medium from M1-Mφs cultured under GLN+ or GLN conditions for 24 hours. (G) qPCR analysis of cytokine gene expression (IL-1β and IL-6) in M1-Mφs under GLN conditions cotreated with DHMEQ for 24 hours. (H) qPCR analysis of cytokine gene expression (e.g., IL-6 and IL-1β) in EVGLN− after DHMEQ treatment. (I and J) Representative images and quantification of the colocalization of cytokines (IL-1β) with HSP70+ or TSG101+ endosomes in M1-Mφs under GLN conditions (scale bar, 50 μm) (n = 3; ***P < 0.001, *P < 0.05 versus the GLN+ group).
Fig. 7.
Fig. 7.. Systemic metabolic rewiring of Mφs under GLN conditions.
(A) Cells were cultured in medium supplemented with GLN (2 mM, GLN+) or without GLN (GLN) for 24 hours, and a PCA scatterplot was generated based on the metabolomic data of the different groups (n = 5). (B) Heatmap showing different metabolites in different groups (n = 5). (C) Volcano plots illustrating differentially abundant metabolites (P-adjusted < 0.05) between groups (n = 5). (D) Metabolic pathway enrichment of different metabolites under GLN conditions. (E) Heatmap showing detailed differentially abundant metabolites between groups (n = 5). (F) Measurements of cellular GSH/GSSG ratio (left), NADPH/NADP+ ratio (middle), and NAD+/NADH (right) ratio in the different groups (n = 5). (G) Pie charts depicting the number (top) and sublocalization (bottom) of mitochondrial DEGs (mito-DEGs) revealed by RNA-seq analysis between the GLN+ and GLN groups (n = 3). (H) KEGG enrichment analysis of mito-DEGs and the top 10 affected pathways (n = 3). (I) Heatmap showing mito-DEGs (FC > 2 and P-adjusted < 0.05) between groups (n = 3). (J) Measurements of mitochondrial ROS, mitochondrial membrane potential, and ATP levels in M1-Mφs under GLN+ conditions or GLN conditions for 24 hours (**P < 0.01, *P < 0.05, NSP > 0.05 versus the GLN+ group).
Fig. 8.
Fig. 8.. Effect of GLN metabolism anaplerosis on EV secretion and cytokine synthesis in Mφs.
(A and B) Schematic illustrating the αKG supplementation experiment. M1-Mφs were cultured in GLN medium supplemented with or without αKG (0.8 mM) for 24 hours, after which the gene expression levels of immunostimulatory molecules (IL-1β, IL-6, and IL-12B) were analyzed via qPCR analysis (n = 3). (C) EV sizes in the different groups (n = 3). (D) EV yields determined by the EV number/cell protein ratio (left) or the EV protein/cell protein ratio (right) in the different groups (n = 3). (E and F) Schematic illustrating the NAC treatment experiment. M1-Mφs were cultured in GLN medium supplemented with or without NAC (0.5 μM) for 24 hours, and the gene expression of immunostimulatory molecules (IL-1β, IL-6, and IL-12B) was analyzed using qPCR analysis (n = 3). (G) EV sizes in the different groups (n = 5). (H) EV yields determined by EV number/cell protein ratio (left) or EV protein/cell protein ratio (right) in the different groups (n = 5) (**P < 0.01, *P < 0.05, NSP > 0.05 versus the “GLNLPS+” group).
Fig. 9.
Fig. 9.. Nutrient availability can regulate EV secretion and function in immune cells.
Fine-tuning nutrient availability–induced metabolic rewiring is a basic and promising strategy for bioengineering EVs as advanced therapeutics for the treatment of diverse diseases. (A) GLN depletion efficiently promotes EV biogenesis and cargo packaging via systemic metabolic rewiring of Mφs. (B) EVs derived from Mφs under GLN conditions (EVGLN−) exhibit favorable immunostimulatory potential.

Similar articles

Cited by

References

    1. Buzas E. I., The roles of extracellular vesicles in the immune system. Nat. Rev. Immunol. 23, 236–250 (2023). - PMC - PubMed
    1. Thompson W., Papoutsakis E. T., The role of biomechanical stress in extracellular vesicle formation, composition and activity. Biotechnol. Adv. 66, 108158 (2023). - PubMed
    1. Wang Y., Zhao M., Liu S., Guo J., Lu Y., Cheng J., Liu J., Macrophage-derived extracellular vesicles: Diverse mediators of pathology and therapeutics in multiple diseases. Cell Death Dis. 11, 924 (2020). - PMC - PubMed
    1. Greening D. W., Xu R., Ale A., Hagemeyer C. E., Chen W., Extracellular vesicles as next generation immunotherapeutics. Semin. Cancer Biol. 90, 73–100 (2023). - PubMed
    1. Cheng L., Wang Y., Huang L., Exosomes from M1-polarized macrophages potentiate the cancer vaccine by creating a pro-inflammatory microenvironment in the lymph node. Mol. Ther. 25, 1665–1675 (2017). - PMC - PubMed