

This is a preprint.
Visualizing the impact of disease-associated mutations on G protein-nucleotide interactions
- PMID: 38352316
- PMCID: PMC10862895
- DOI: 10.1101/2024.01.30.578006
Visualizing the impact of disease-associated mutations on G protein-nucleotide interactions
Abstract
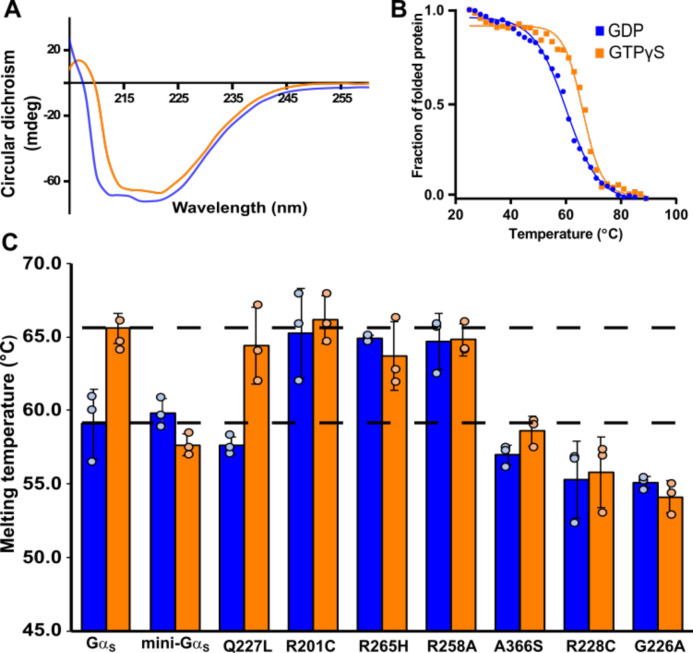
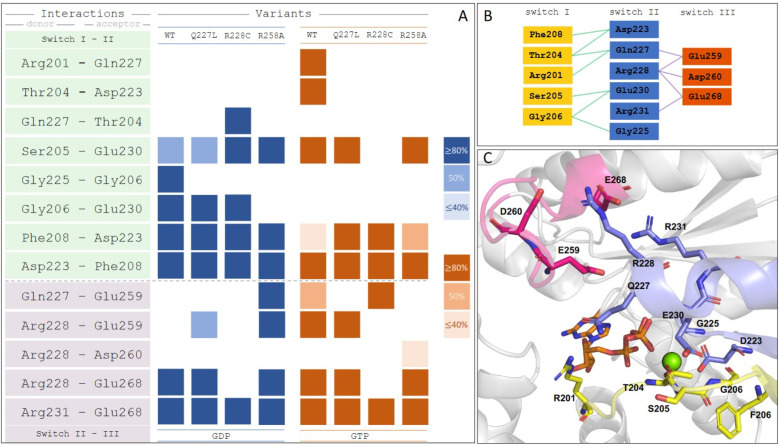
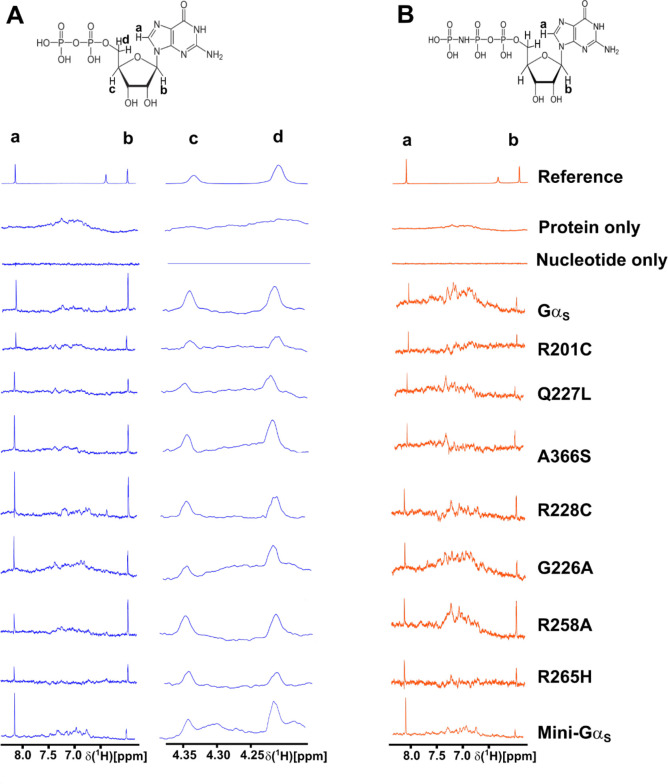
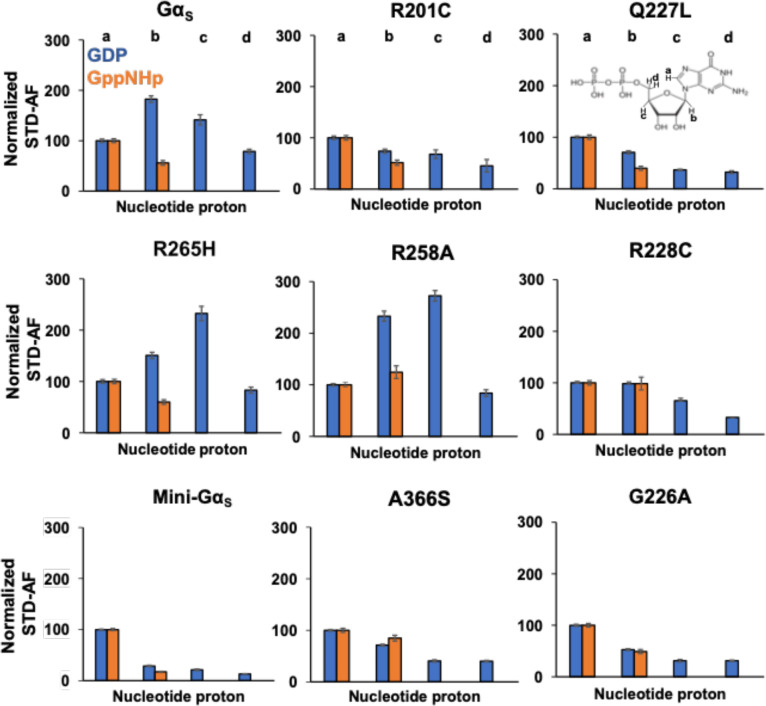
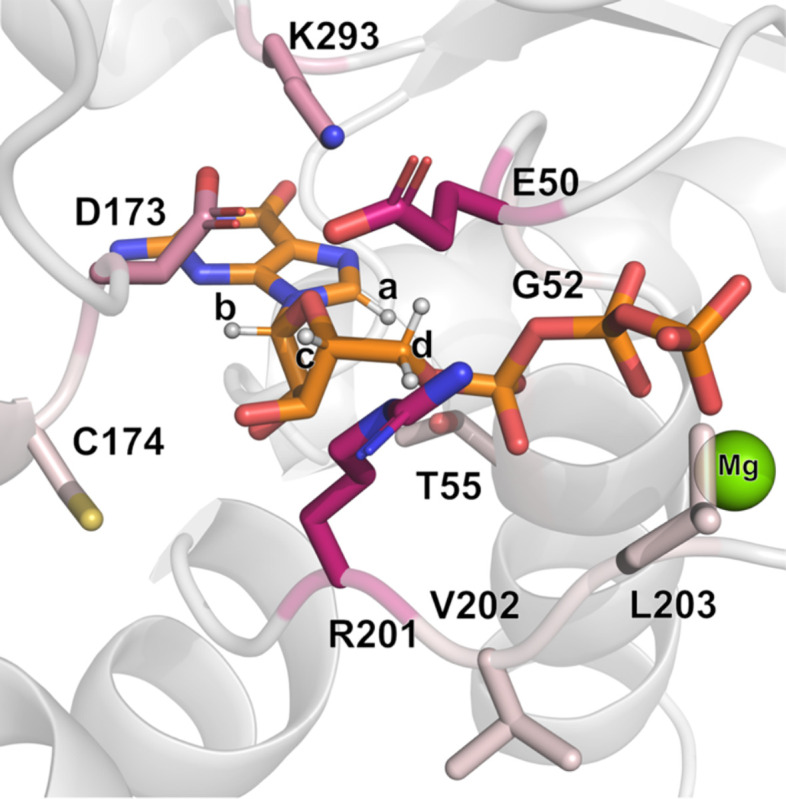
Activation of G proteins stimulates ubiquitous intracellular signaling cascades essential for life processes. Under normal physiological conditions, nucleotide exchange is initiated upon the formation of complexes between a G protein and G protein-coupled receptor (GPCR), which facilitates exchange of bound GDP for GTP, subsequently dissociating the trimeric G protein into its Gα and Gβγ subunits. However, single point mutations in Gα circumvent nucleotide exchange regulated by GPCR-G protein interactions, leading to either loss-of-function or constitutive gain-of-function. Mutations in several Gα subtypes are closely linked to the development of multiple diseases, including several intractable cancers. We leveraged an integrative spectroscopic and computational approach to investigate the mechanisms by which seven of the most frequently observed clinically-relevant mutations in the α subunit of the stimulatory G protein result in functional changes. Variable temperature circular dichroism (CD) spectroscopy showed a bimodal distribution of thermal melting temperatures across all GαS variants. Modeling from molecular dynamics (MD) simulations established a correlation between observed thermal melting temperatures and structural changes caused by the mutations. Concurrently, saturation-transfer difference NMR (STD-NMR) highlighted variations in the interactions of GαS variants with bound nucleotides. MD simulations indicated that changes in local interactions within the nucleotide-binding pocket did not consistently align with global structural changes. This collective evidence suggests a multifaceted energy landscape, wherein each mutation may introduce distinct perturbations to the nucleotide-binding site and protein-protein interaction sites. Consequently, it underscores the importance of tailoring therapeutic strategies to address the unique challenges posed by individual mutations.
Keywords: G protein; G protein-coupled receptor (GPCR); GTPase; cancer; molecular dynamics (MD); nuclear magnetic resonance (NMR).
Conflict of interest statement
Conflict of interest The authors declare that they have no conflicts of interest with the contents of this article.
Figures

Similar articles
-
Interaction networks within disease-associated GαS variants characterized by an integrative biophysical approach.J Biol Chem. 2024 Aug;300(8):107497. doi: 10.1016/j.jbc.2024.107497. Epub 2024 Jun 24. J Biol Chem. 2024. PMID: 38925329 Free PMC article.
-
Structural Elements in the Gαs and Gαq C Termini That Mediate Selective G Protein-coupled Receptor (GPCR) Signaling.J Biol Chem. 2016 Aug 19;291(34):17929-40. doi: 10.1074/jbc.M116.735720. Epub 2016 Jun 21. J Biol Chem. 2016. PMID: 27330078 Free PMC article.
-
Gbetagamma inhibits Galpha GTPase-activating proteins by inhibition of Galpha-GTP binding during stimulation by receptor.J Biol Chem. 2006 Feb 24;281(8):4746-53. doi: 10.1074/jbc.M510573200. Epub 2005 Dec 29. J Biol Chem. 2006. PMID: 16407201
-
The GAPs, GEFs, and GDIs of heterotrimeric G-protein alpha subunits.Int J Biol Sci. 2005;1(2):51-66. doi: 10.7150/ijbs.1.51. Epub 2005 Apr 1. Int J Biol Sci. 2005. PMID: 15951850 Free PMC article. Review.
-
Fine-tuning of GPCR signals by intracellular G protein modulators.Prog Mol Biol Transl Sci. 2013;115:421-53. doi: 10.1016/B978-0-12-394587-7.00010-5. Prog Mol Biol Transl Sci. 2013. PMID: 23415100 Review.
References
-
- Gilman A. G. (1987) G proteins: transducers of receptor-generated signals. Annu. Rev. Biochem. 56, 615–649 - PubMed
-
- Oldham W. M., and Hamm H. E. (2008) Heterotrimeric G protein activation by G-protein-coupled receptors. Nat. Rev. Mol. Cell Biol. 9, 60–71 - PubMed
-
- Helmrich S. P., Ragland D. R., Leung R. W., and Paffenbarger R. S. (1991) Activating Mutations of the Stimulatory G Protein in the McCune–Albright Syndrome. New Engl. J. Med. 325, 147–152 - PubMed
-
- Iiri T., Herzmark P., Nakamoto J. M., Van Dop C., and Bourne H. R. (1994) Rapid GDP release from Gsα in patients with gain and loss of endocrine function. Nature 371, 164–168 - PubMed
-
- Lee E., Taussig R., and Gilman A. G. (1992) The G226A mutant of Gsα highlights the requirement for dissociation of G protein subunits. J. Biol. Chem. 267, 1212–1218 - PubMed
Publication types
Grants and funding
LinkOut - more resources
Full Text Sources
Research Materials