

Estimating individualized treatment rules for multicategory type 2 diabetes treatments using electronic health records
- PMID: 38344146
- PMCID: PMC10857856
- DOI: 10.4310/22-sii739
Estimating individualized treatment rules for multicategory type 2 diabetes treatments using electronic health records
Abstract
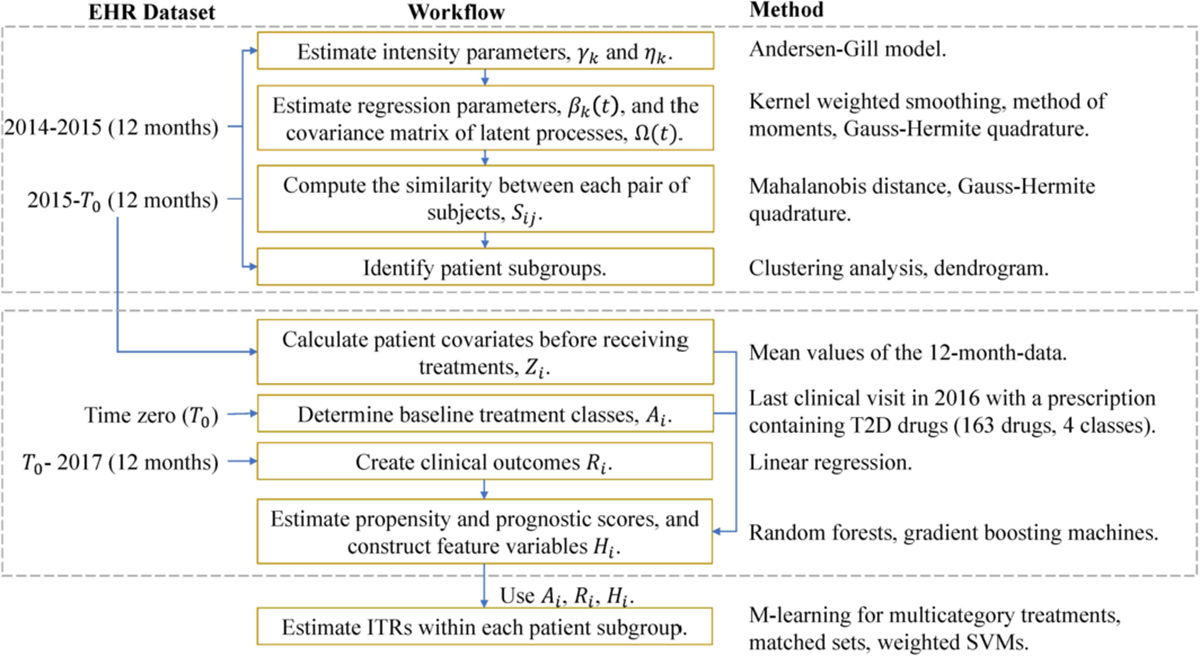
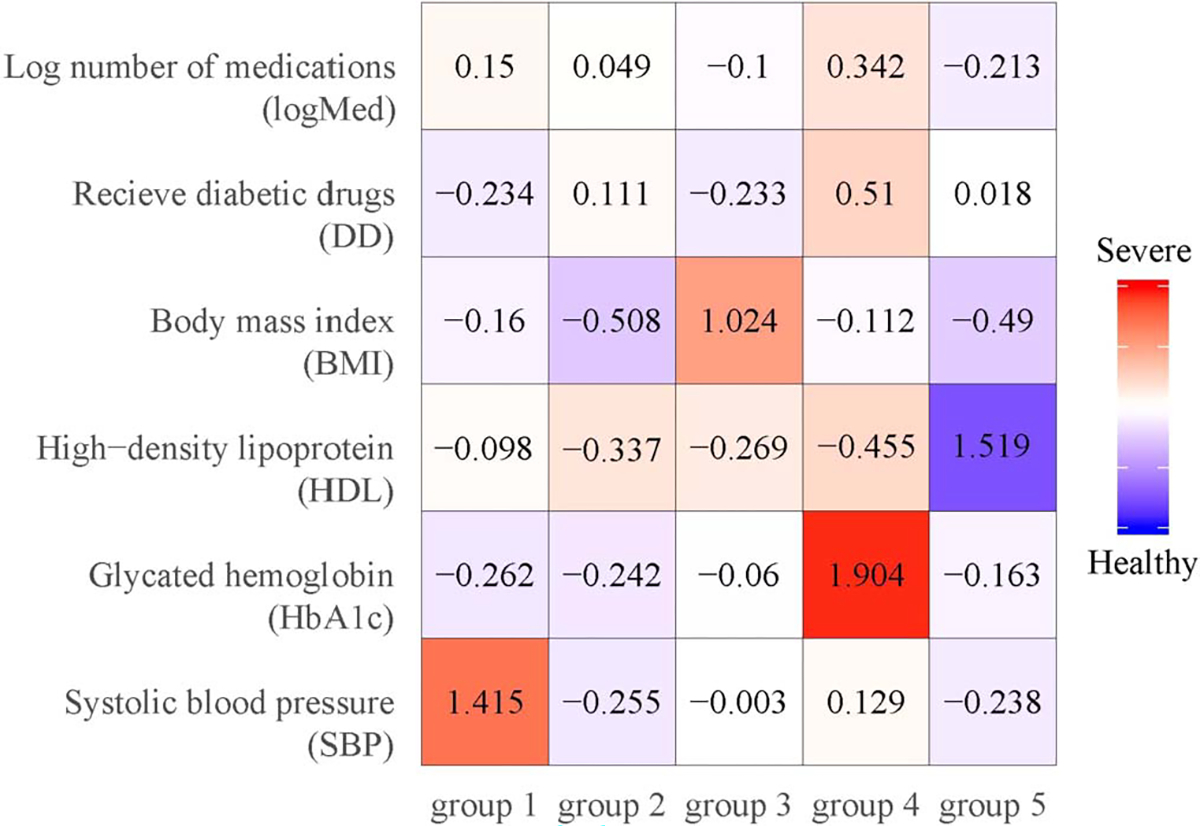
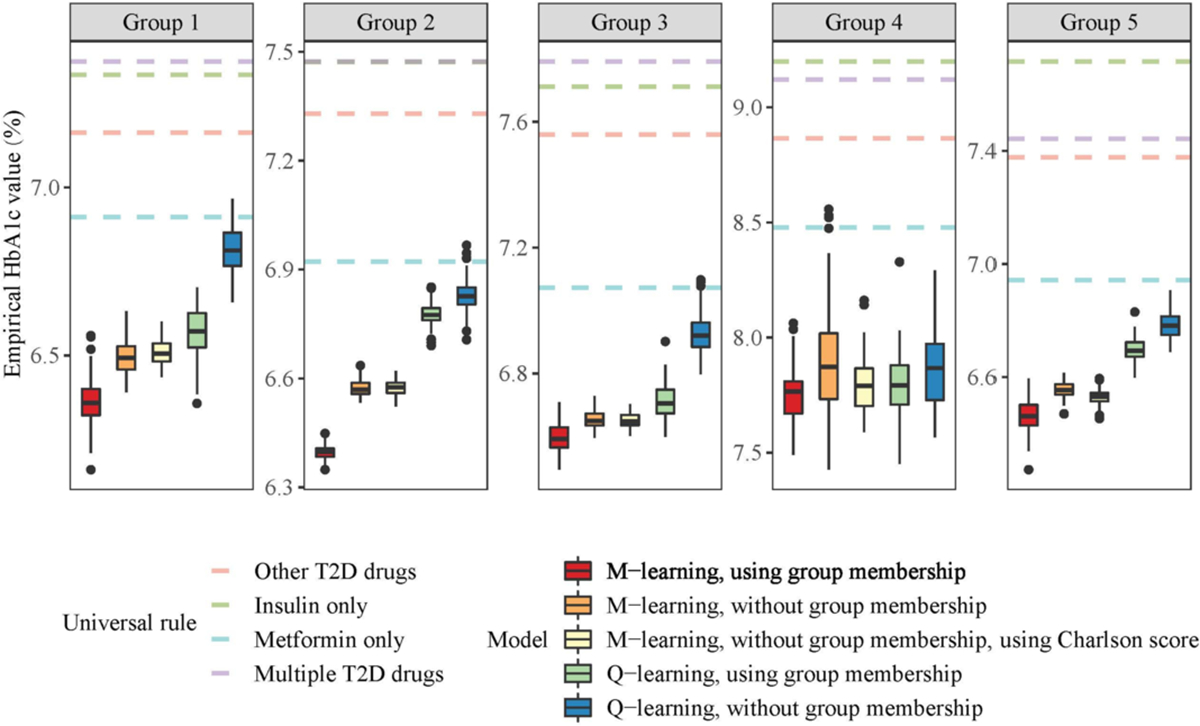
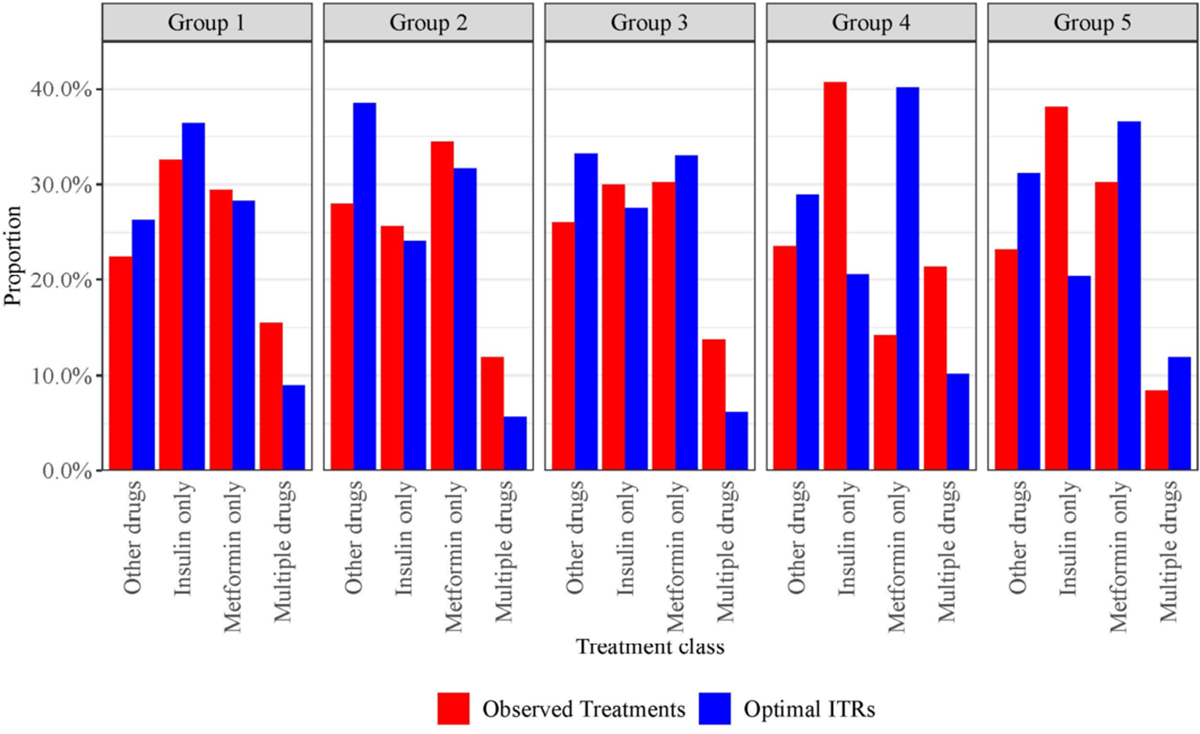
In this article, we propose a general framework to learn optimal treatment rules for type 2 diabetes (T2D) patients using electronic health records (EHRs). We first propose a joint modeling approach to characterize patient's pretreatment conditions using longitudinal markers from EHRs. The estimation accounts for informative measurement times using inverse-intensity weighting methods. The predicted latent processes in the joint model are used to divide patients into a finite of subgroups and, within each group, patients share similar health profiles in EHRs. Within each patient group, we estimate optimal individualized treatment rules by extending a matched learning method to handle multicategory treatments using a one-versus-one approach. Each matched learning for two treatments is implemented by a weighted support vector machine with matched pairs of patients. We apply our method to estimate optimal treatment rules for T2D patients in a large sample of EHRs from the Ohio State University Wexner Medical Center. We demonstrate the utility of our method to select the optimal treatments from four classes of drugs and achieve a better control of glycated hemoglobin than any one-size-fits-all rules.
Keywords: Electronic health records; Individualized treatment rules; Latent process; Machine learning; Multicategory treatments; Type 2 diabetes.
Figures
Similar articles
-
Matched Learning for Optimizing Individualized Treatment Strategies Using Electronic Health Records.J Am Stat Assoc. 2020;115(529):380-392. doi: 10.1080/01621459.2018.1549050. Epub 2019 Apr 23. J Am Stat Assoc. 2020. PMID: 33041401 Free PMC article.
-
Learning latent heterogeneity for type 2 diabetes patients using longitudinal health markers in electronic health records.Stat Med. 2021 Apr 15;40(8):1930-1946. doi: 10.1002/sim.8880. Epub 2021 Feb 15. Stat Med. 2021. PMID: 33586187 Free PMC article.
-
On using electronic health records to improve optimal treatment rules in randomized trials.Biometrics. 2020 Dec;76(4):1075-1086. doi: 10.1111/biom.13288. Epub 2020 May 14. Biometrics. 2020. PMID: 32365232 Free PMC article.
-
From Real-World Patient Data to Individualized Treatment Effects Using Machine Learning: Current and Future Methods to Address Underlying Challenges.Clin Pharmacol Ther. 2021 Jan;109(1):87-100. doi: 10.1002/cpt.1907. Epub 2020 Jun 28. Clin Pharmacol Ther. 2021. PMID: 32449163 Review.
-
Probability estimation with machine learning methods for dichotomous and multicategory outcome: theory.Biom J. 2014 Jul;56(4):534-63. doi: 10.1002/bimj.201300068. Epub 2014 Jan 29. Biom J. 2014. PMID: 24478134 Review.
References
-
- Abramowitz M and Stegun IA (1965). Handbook of Mathematical Functions: With Formulas, Graphs, and Mathematical Tables. Applied mathematics series. Dover Publications, New York, NY, USA. MR0415956
-
- Andersen PK and Gill RD (1982). Cox’s regression model for counting processes: a large sample study. The Annals of Statistics 10 1100–1120. MR0673646
-
- American Diabetes Association (2018). Pharmacologic approaches to glycemic treatment: standards of medical care in diabetes–2018. Diabetes Care 41 73–85. - PubMed
-
- American Diabetes Association (2021). Standards of Medical Care in Diabetes—2021. Diabetes Care 44 S73–S150. - PubMed
Grants and funding
LinkOut - more resources
Full Text Sources