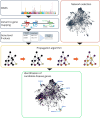
Network propagation for GWAS analysis: a practical guide to leveraging molecular networks for disease gene discovery
- PMID: 38340090
- PMCID: PMC10858647
- DOI: 10.1093/bib/bbae014
Network propagation for GWAS analysis: a practical guide to leveraging molecular networks for disease gene discovery
Abstract
Motivation: Genome-wide association studies (GWAS) have enabled large-scale analysis of the role of genetic variants in human disease. Despite impressive methodological advances, subsequent clinical interpretation and application remains challenging when GWAS suffer from a lack of statistical power. In recent years, however, the use of information diffusion algorithms with molecular networks has led to fruitful insights on disease genes.
Results: We present an overview of the design choices and pitfalls that prove crucial in the application of network propagation methods to GWAS summary statistics. We highlight general trends from the literature, and present benchmark experiments to expand on these insights selecting as case study three diseases and five molecular networks. We verify that the use of gene-level scores based on GWAS P-values offers advantages over the selection of a set of 'seed' disease genes not weighted by the associated P-values if the GWAS summary statistics are of sufficient quality. Beyond that, the size and the density of the networks prove to be important factors for consideration. Finally, we explore several ensemble methods and show that combining multiple networks may improve the network propagation approach.
Keywords: GWAS; disease gene; molecular network; network propagation.
© The Author(s) 2024. Published by Oxford University Press.
Figures


Similar articles
-
Assessing the comparative effects of interventions in COPD: a tutorial on network meta-analysis for clinicians.Respir Res. 2024 Dec 21;25(1):438. doi: 10.1186/s12931-024-03056-x. Respir Res. 2024. PMID: 39709425 Free PMC article. Review.
-
Healthcare workers' informal uses of mobile phones and other mobile devices to support their work: a qualitative evidence synthesis.Cochrane Database Syst Rev. 2024 Aug 27;8(8):CD015705. doi: 10.1002/14651858.CD015705.pub2. Cochrane Database Syst Rev. 2024. PMID: 39189465 Free PMC article.
-
Ethics of Procuring and Using Organs or Tissue from Infants and Newborns for Transplantation, Research, or Commercial Purposes: Protocol for a Bioethics Scoping Review.Wellcome Open Res. 2024 Dec 5;9:717. doi: 10.12688/wellcomeopenres.23235.1. eCollection 2024. Wellcome Open Res. 2024. PMID: 39839977 Free PMC article.
-
The use of Open Dialogue in Trauma Informed Care services for mental health consumers and their family networks: A scoping review.J Psychiatr Ment Health Nurs. 2024 Aug;31(4):681-698. doi: 10.1111/jpm.13023. Epub 2024 Jan 17. J Psychiatr Ment Health Nurs. 2024. PMID: 38230967
-
Factors that influence participation in physical activity for people with bipolar disorder: a synthesis of qualitative evidence.Cochrane Database Syst Rev. 2024 Jun 4;6(6):CD013557. doi: 10.1002/14651858.CD013557.pub2. Cochrane Database Syst Rev. 2024. PMID: 38837220 Review.
References
-
- Ghosh R, Tabrizi SJ. Clinical features of Huntington’s disease. Adv Exp Med Biol 2018; 1049:1–28. - PubMed
-
- Hirschhorn JN, Daly MJ. Genome-wide association studies for common diseases and complex traits. Nat Rev Genet 2005; 6(2): 95–108. - PubMed
-
- Hirschhorn JN. Genetic approaches to studying common diseases and complex traits. Pediatr Res 2005; 57:74R–7. - PubMed

