. 2024 Feb;532(2):e25575.
doi: 10.1002/cne.25575.

Distinct cellular expression and subcellular localization of Kv2 voltage-gated K+ channel subtypes in dorsal root ganglion neurons conserved between mice and humans

Affiliations

Distinct cellular expression and subcellular localization of Kv2 voltage-gated K+ channel subtypes in dorsal root ganglion neurons conserved between mice and humans

Robert G Stewart et al. J Comp Neurol. 2024 Feb.

Abstract

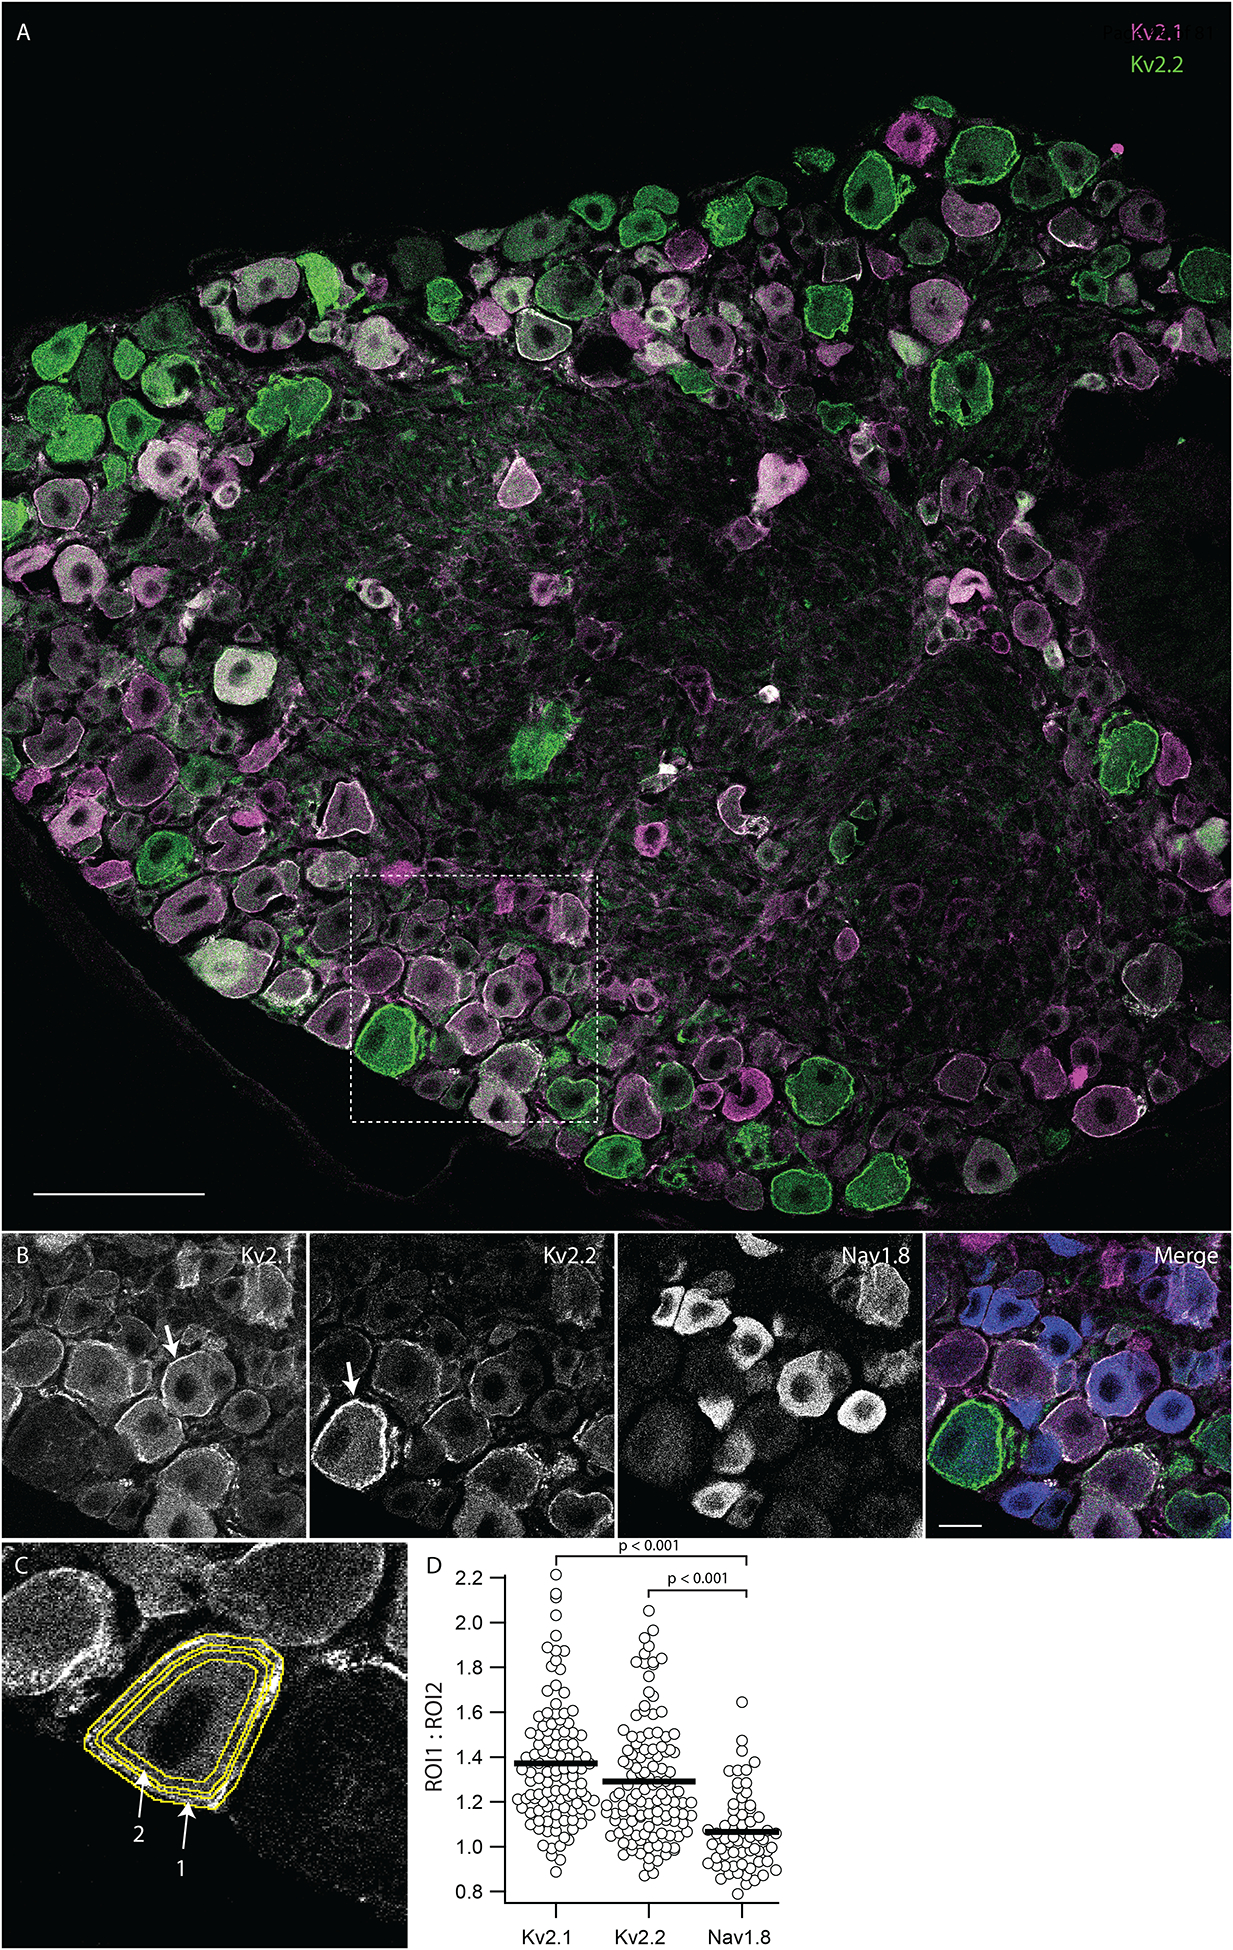
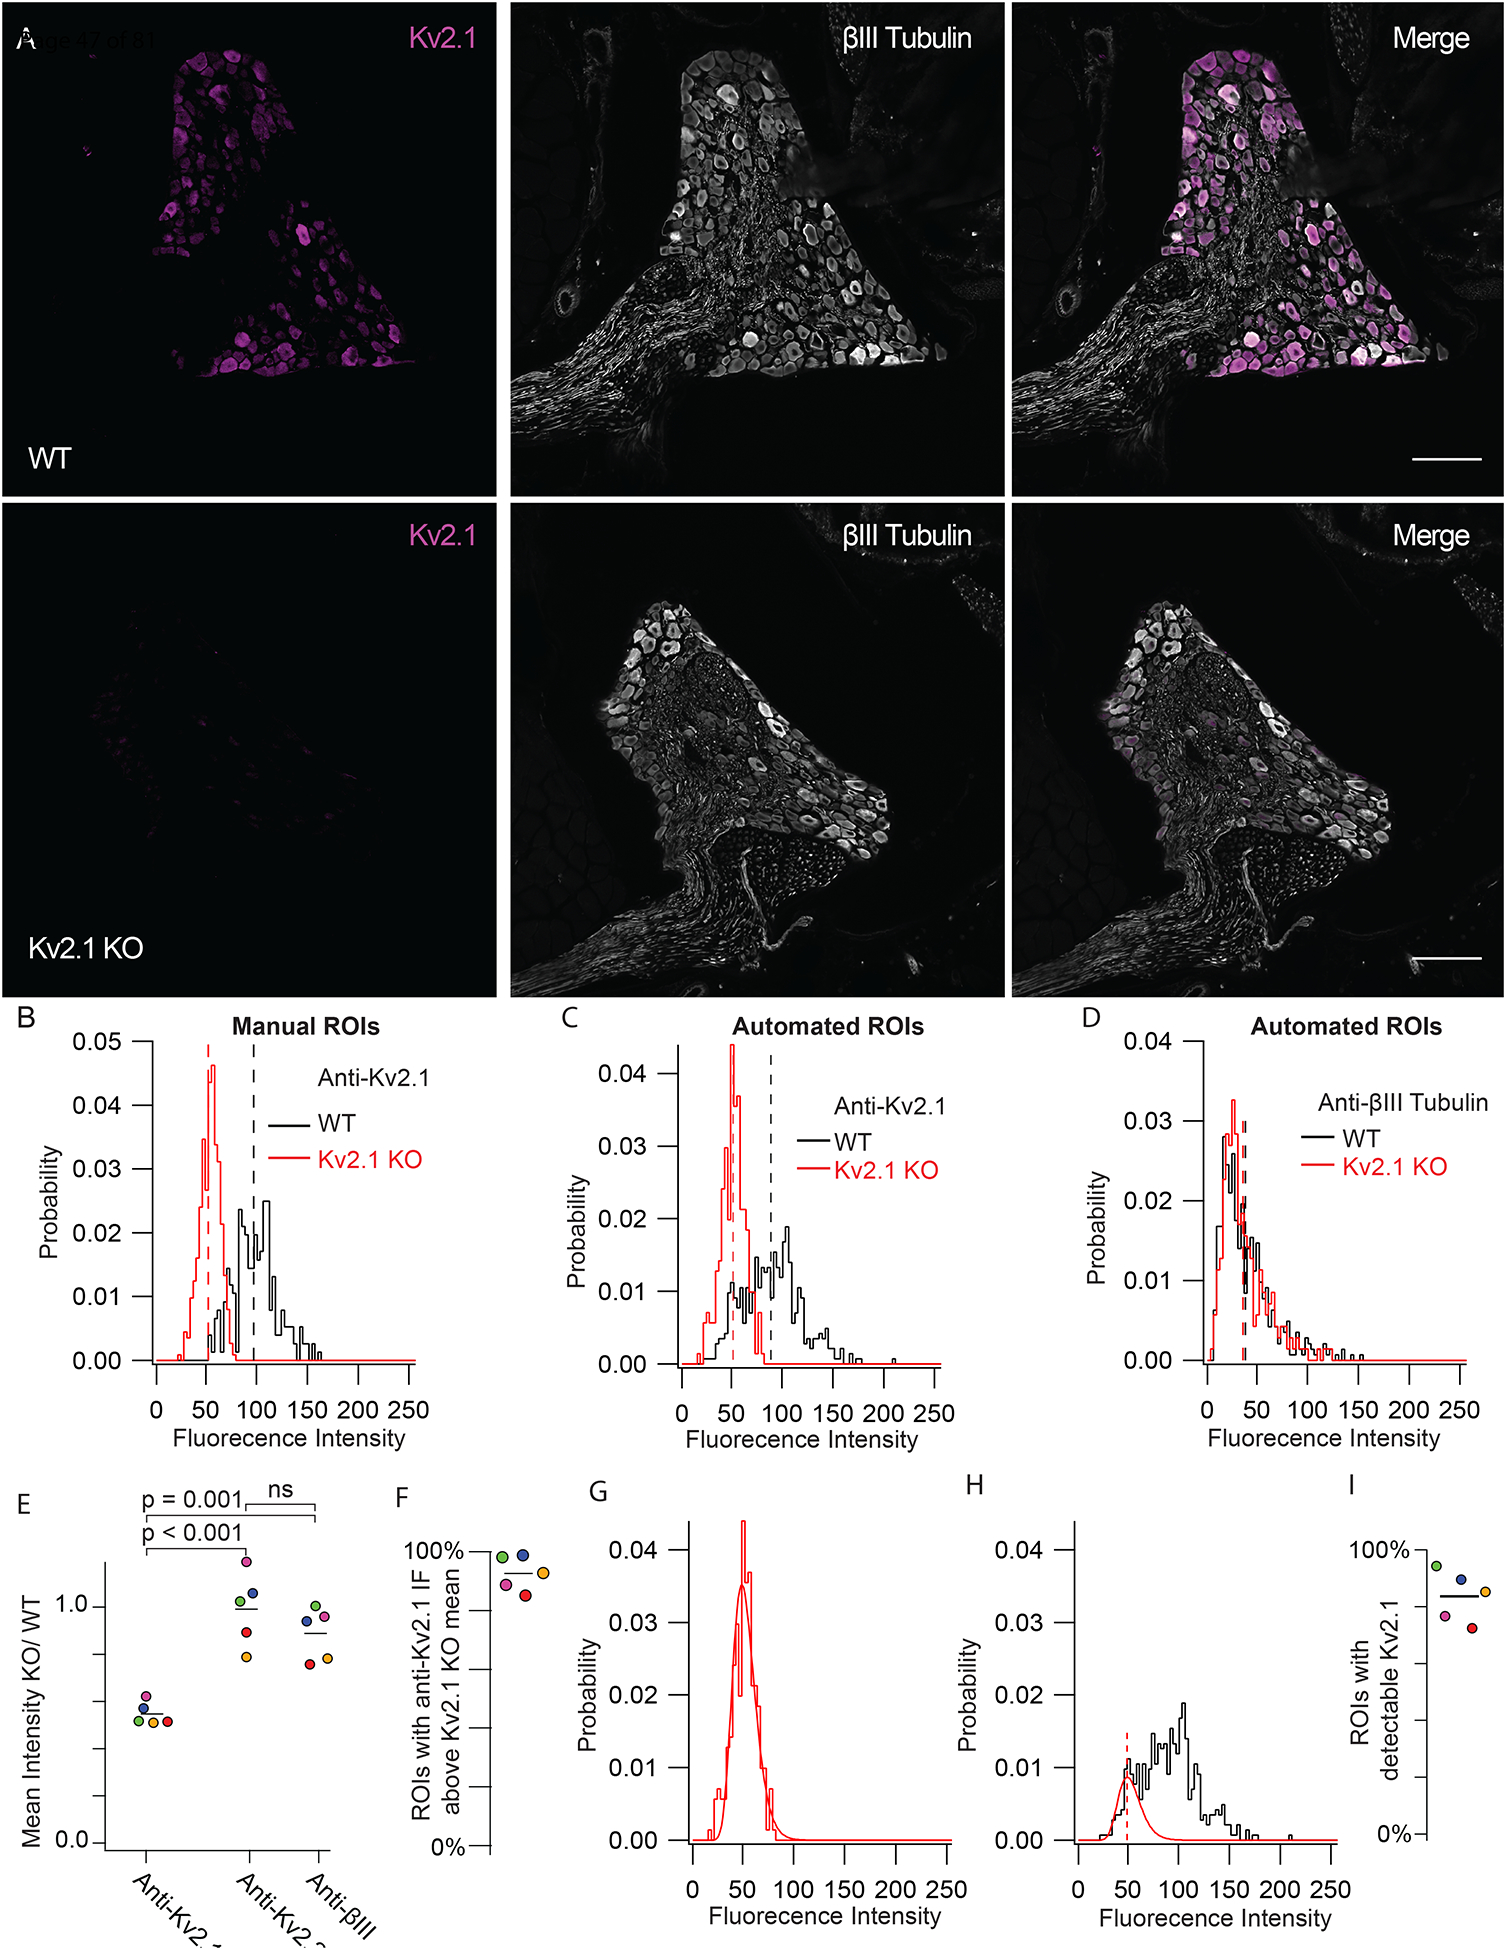
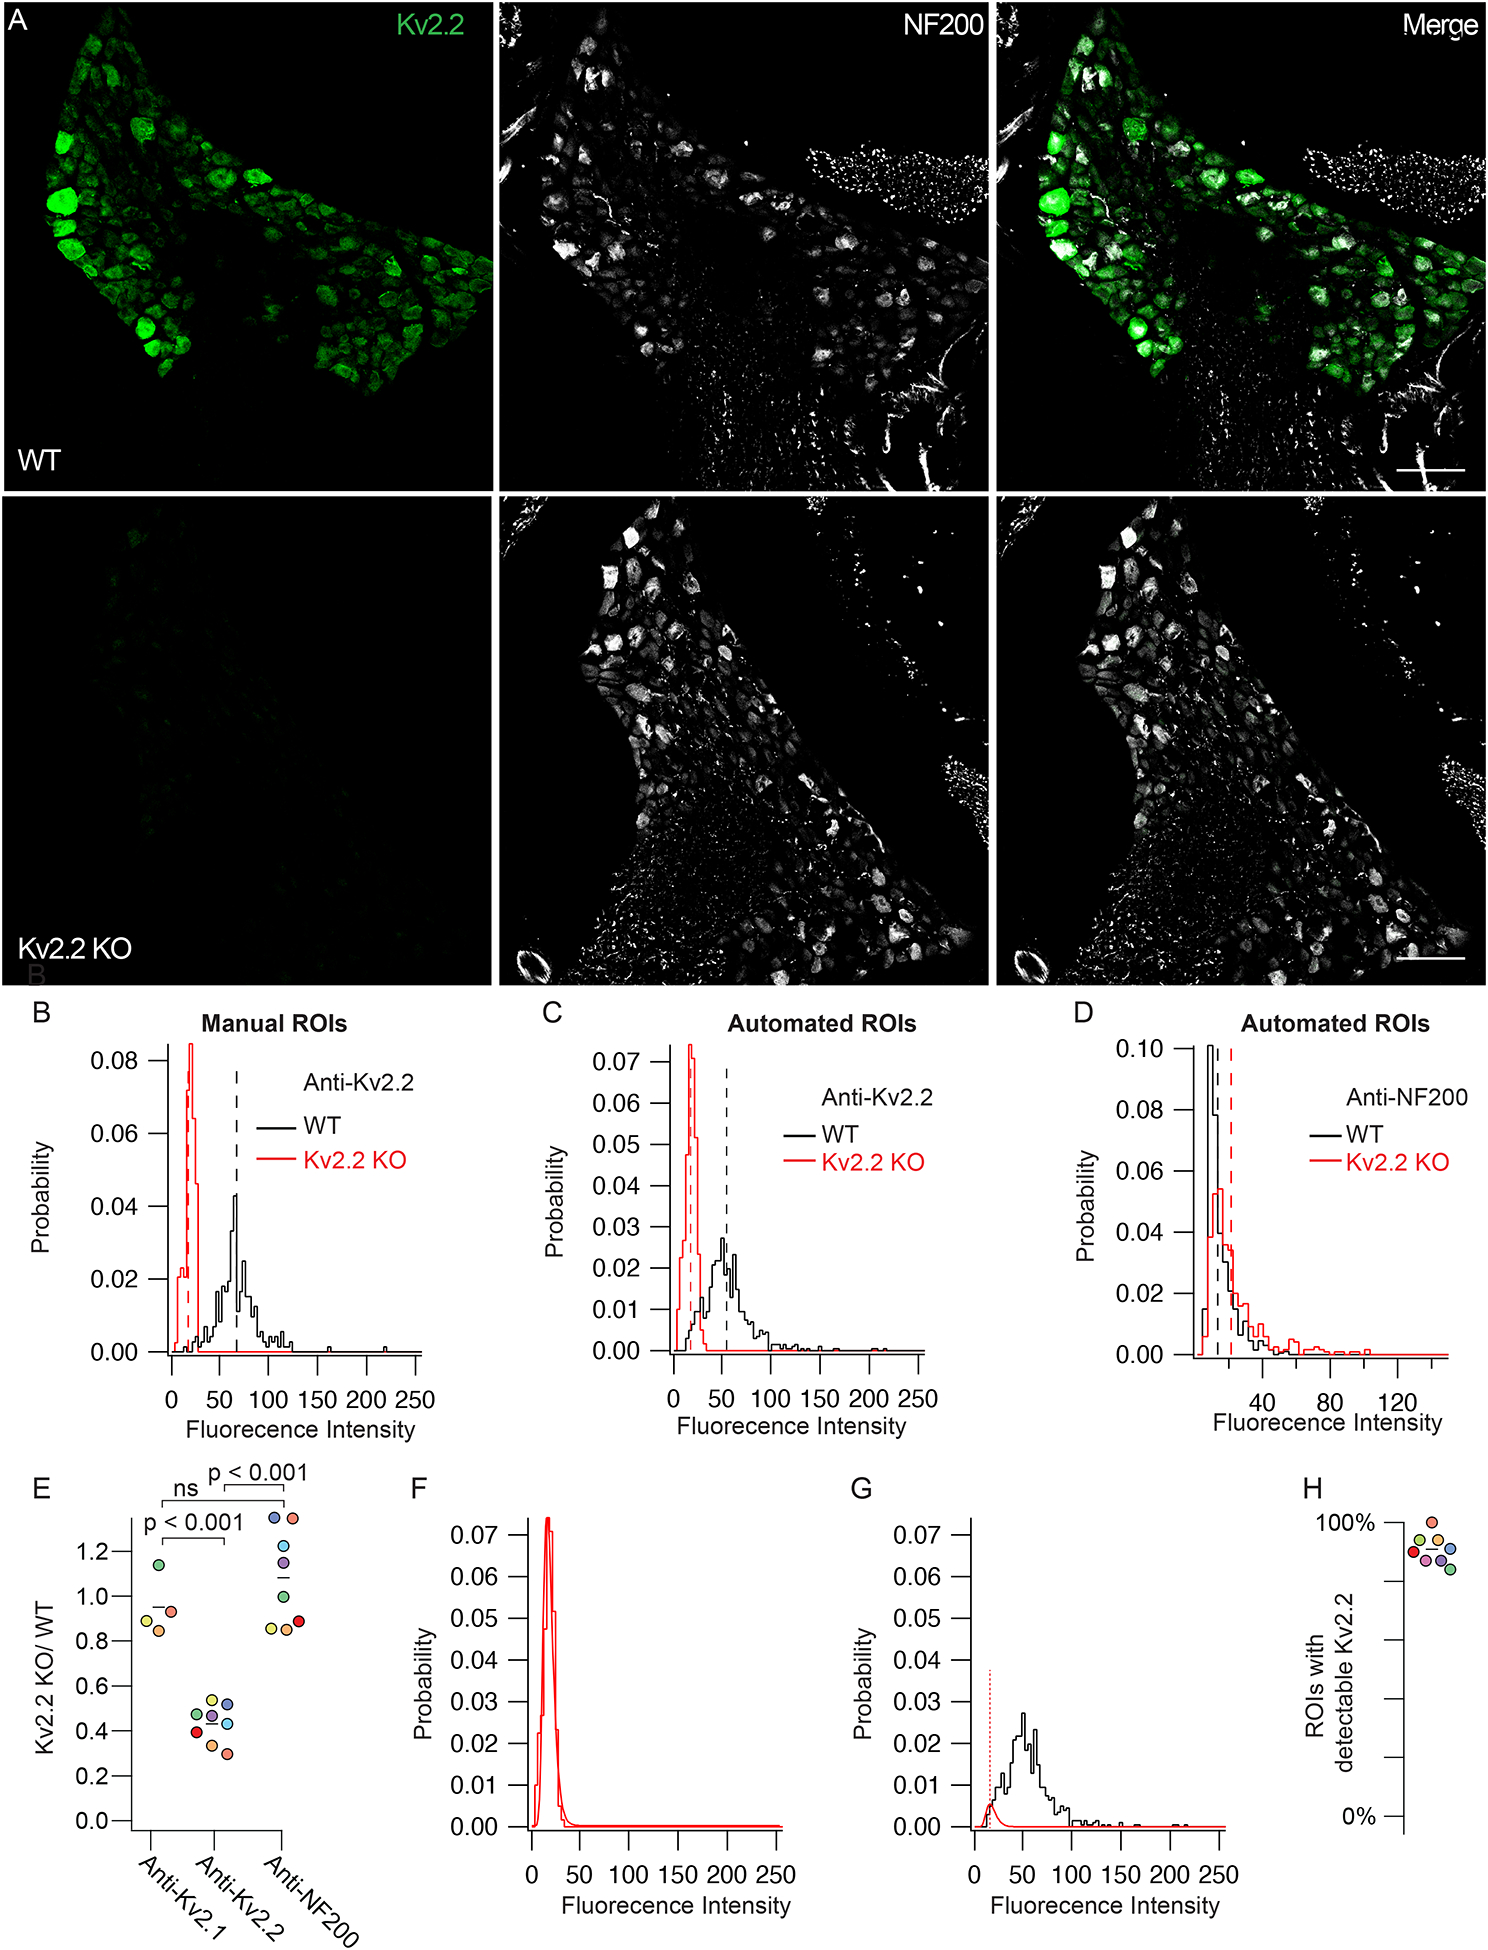
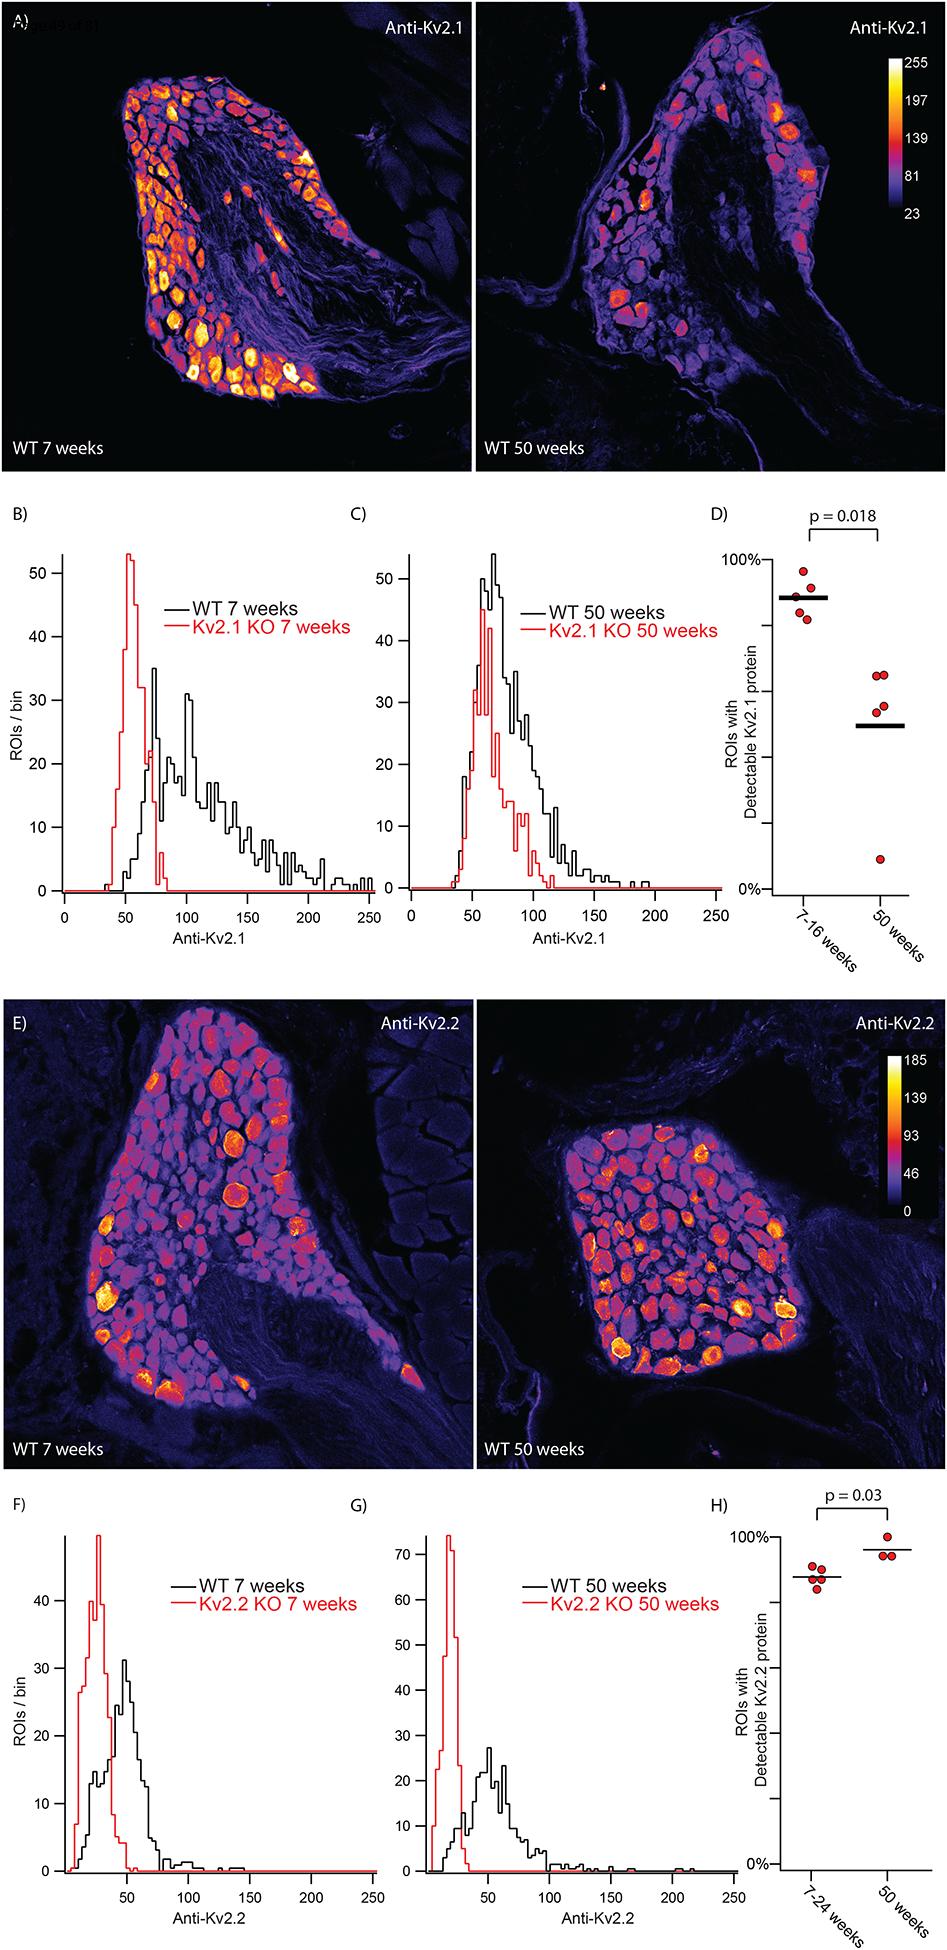
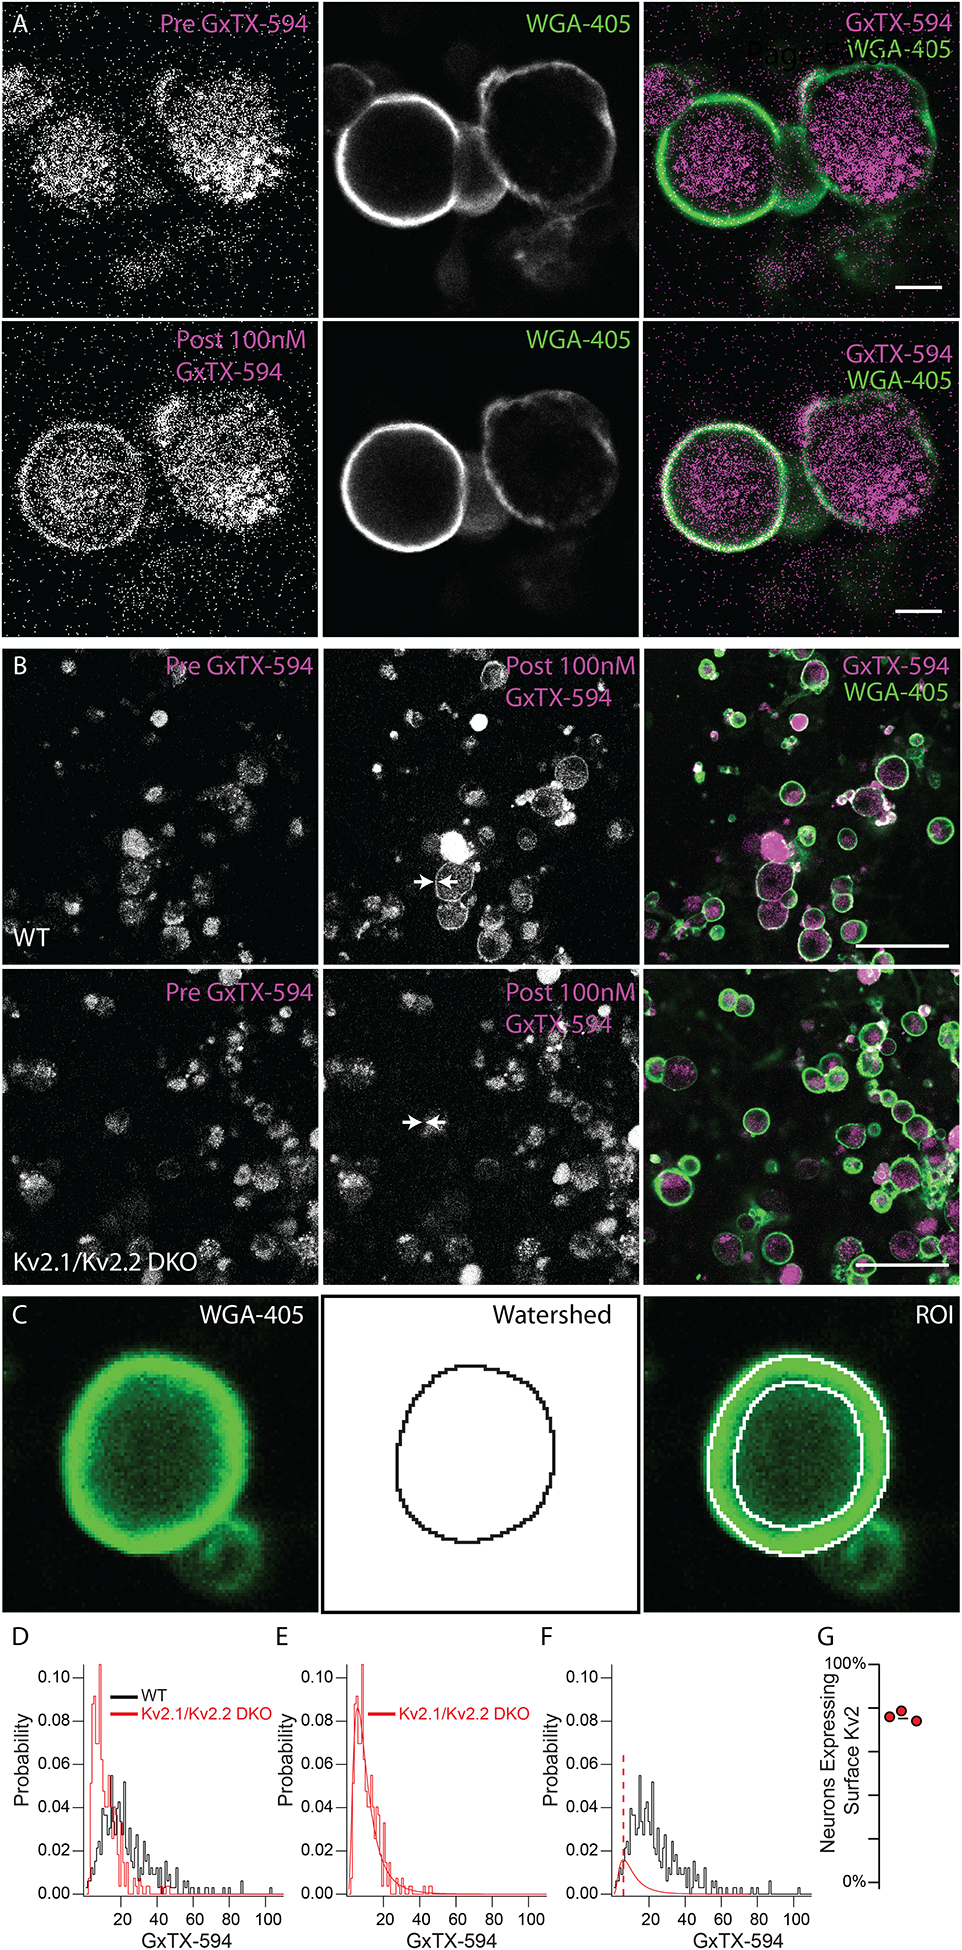
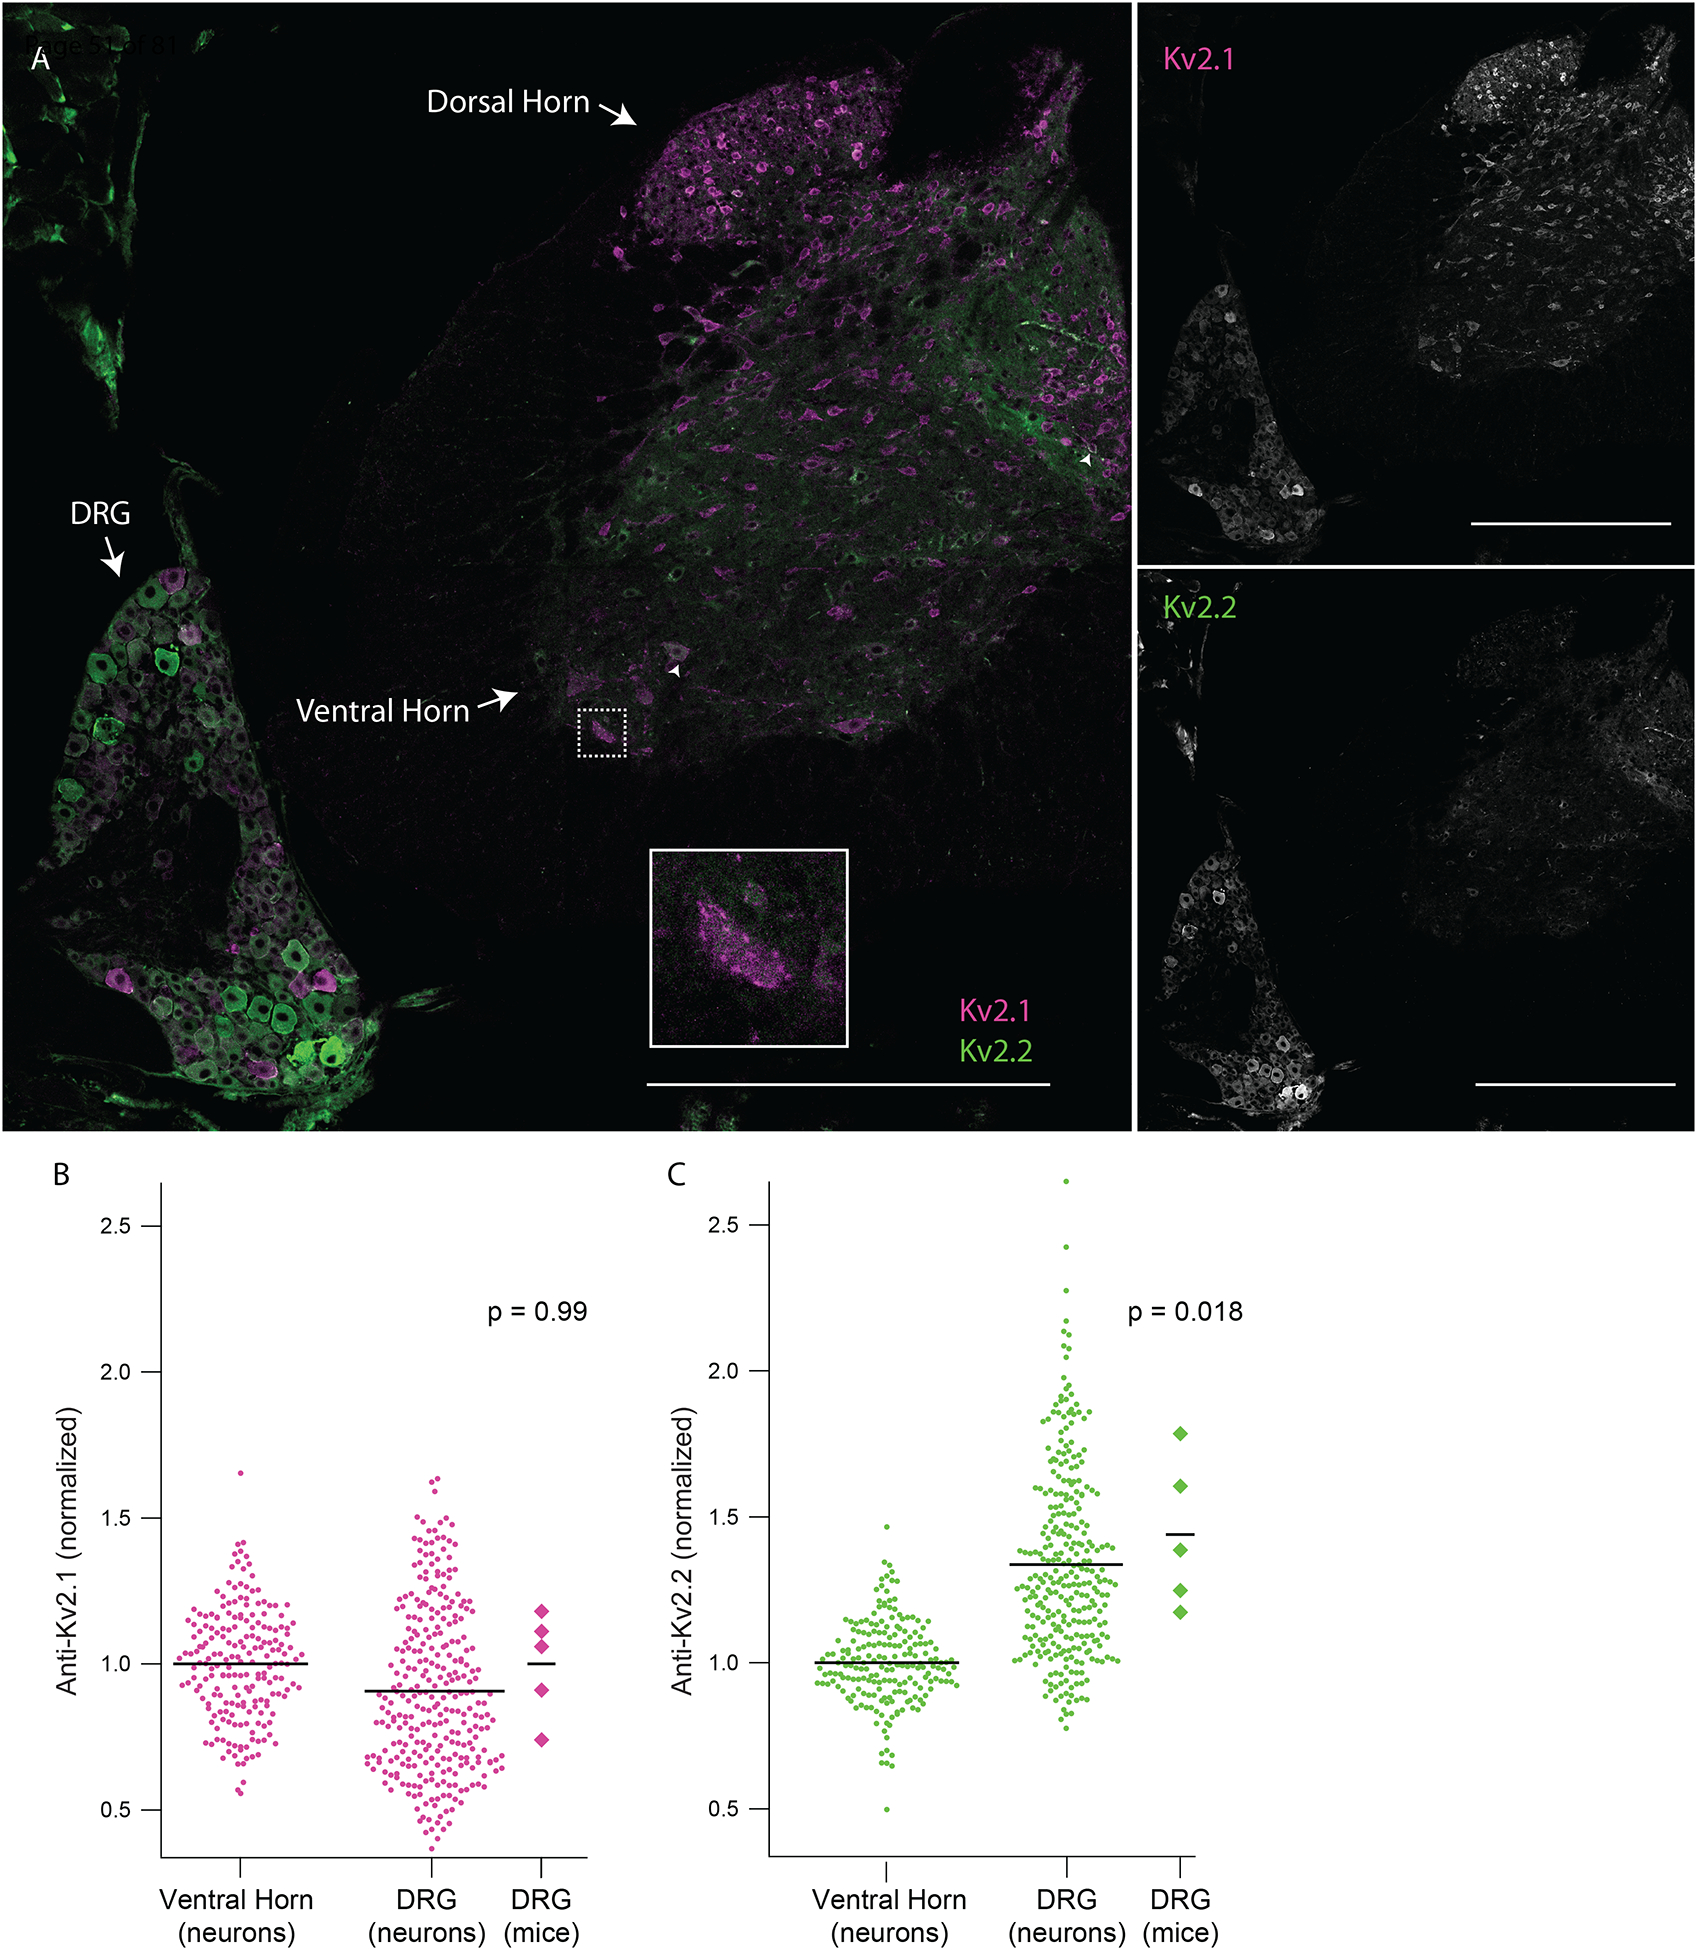
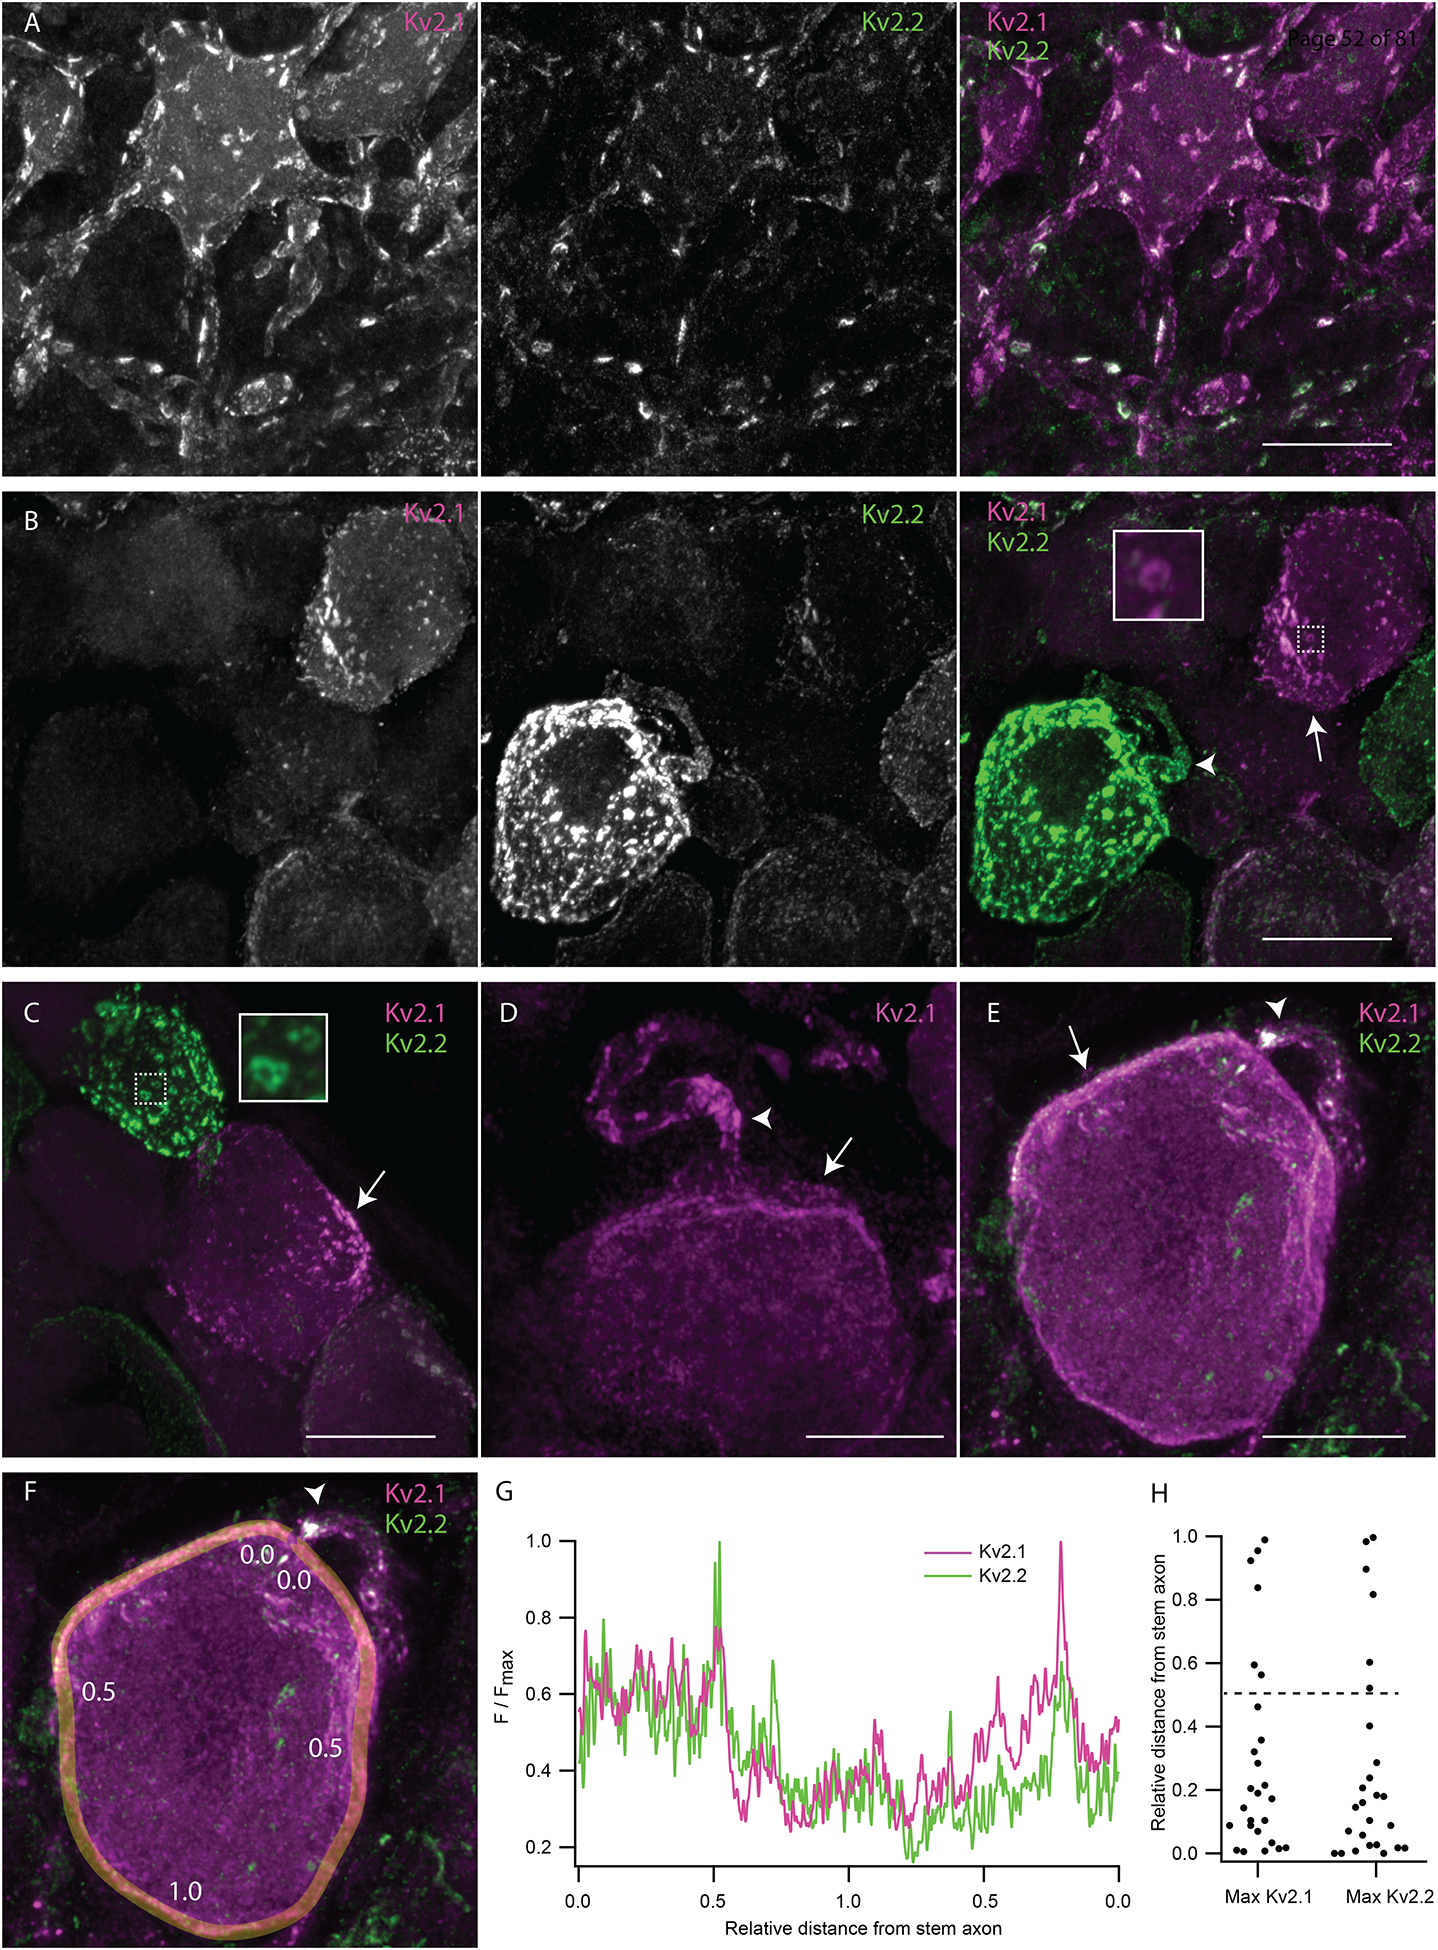
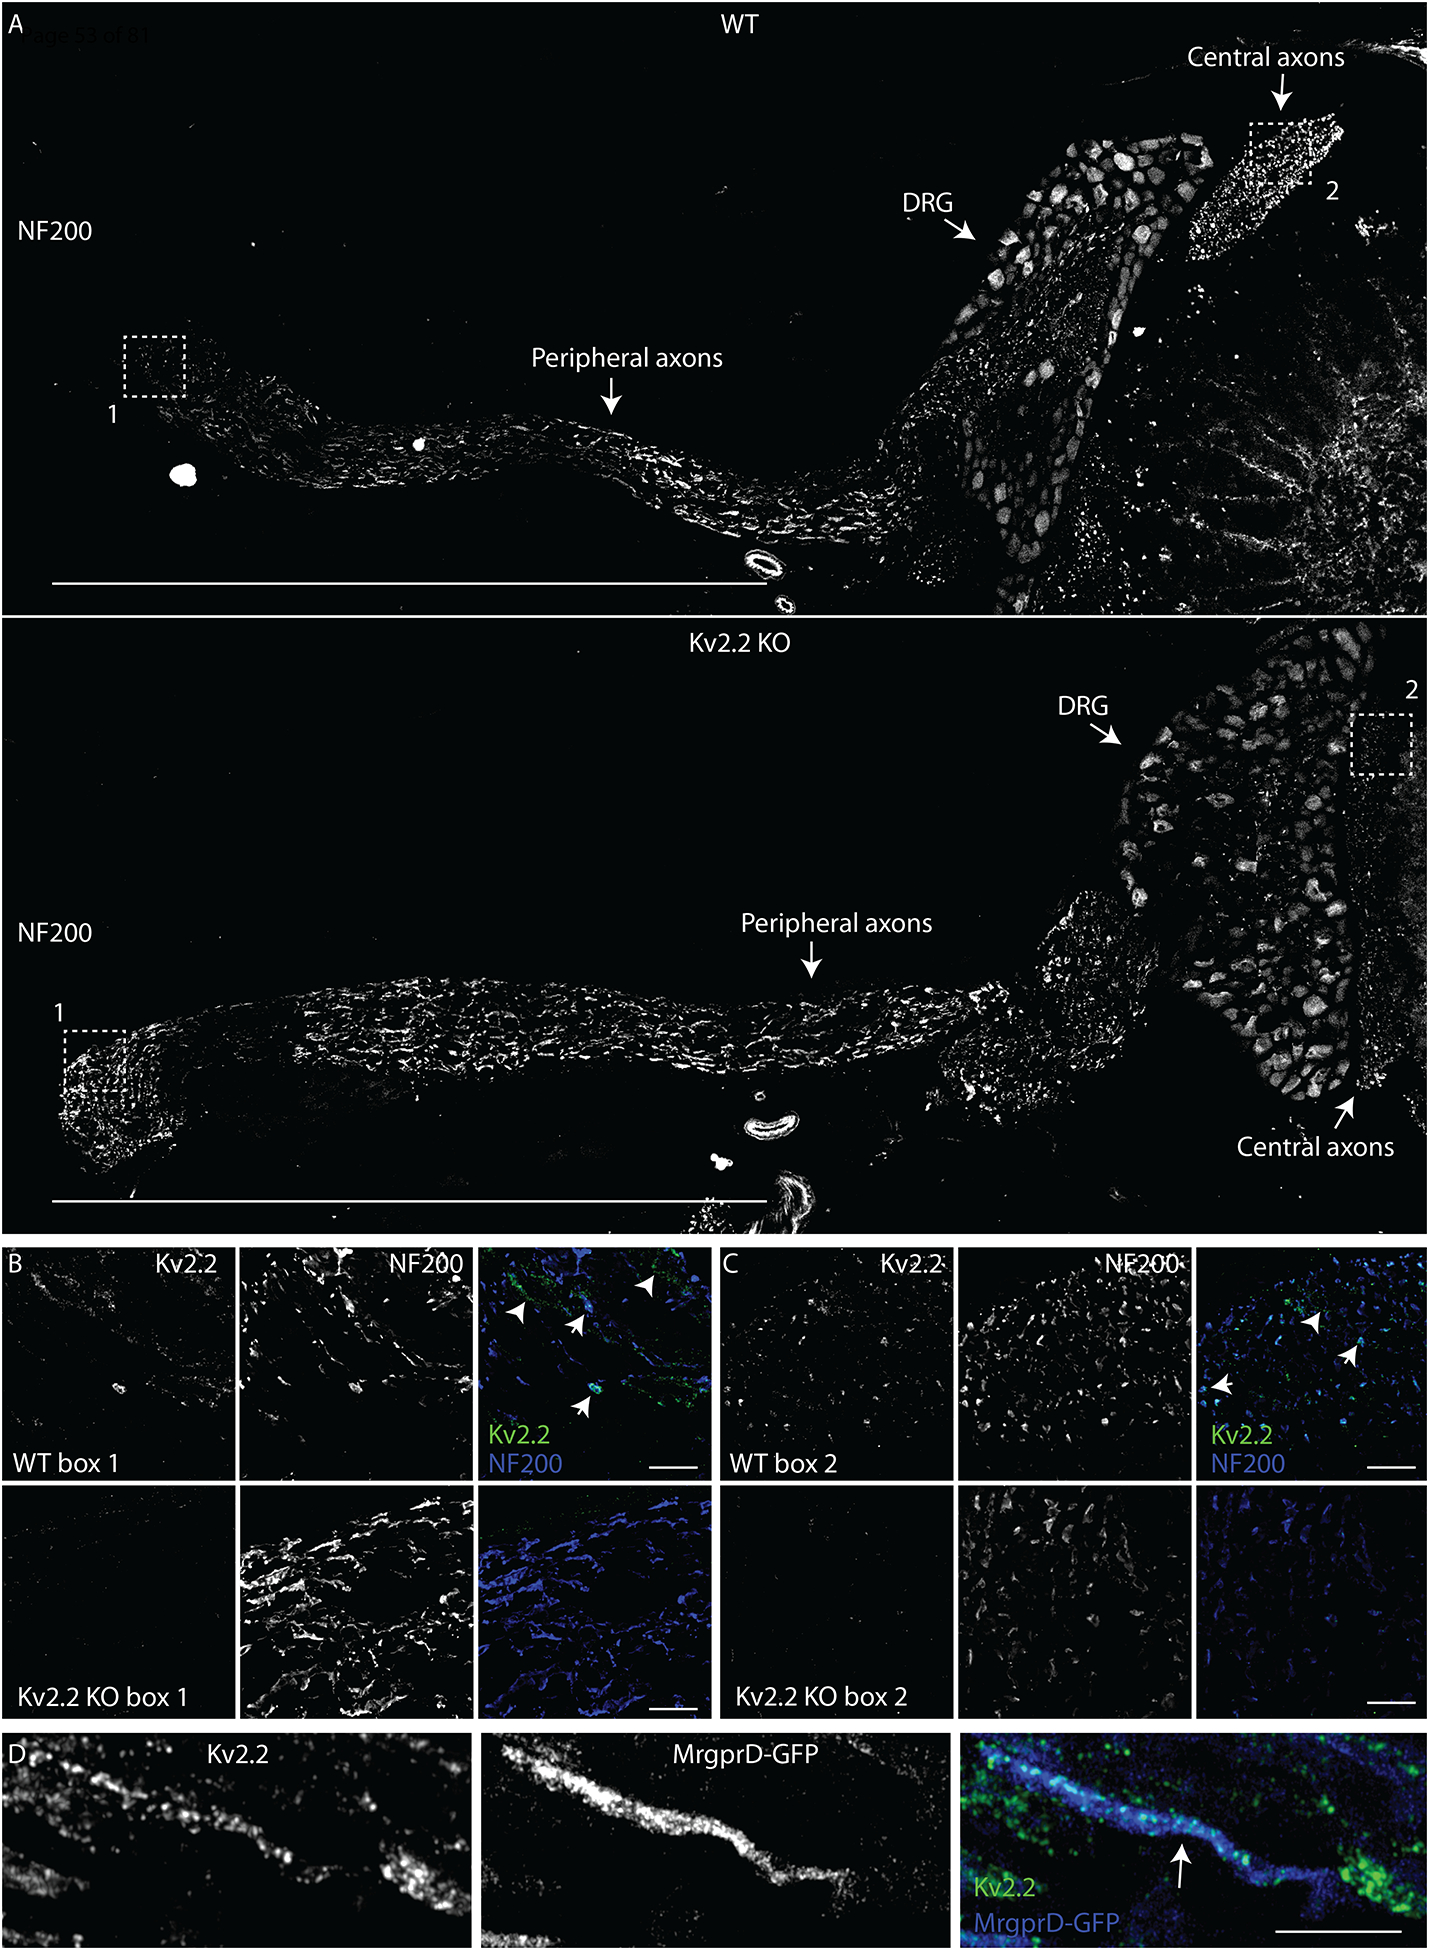
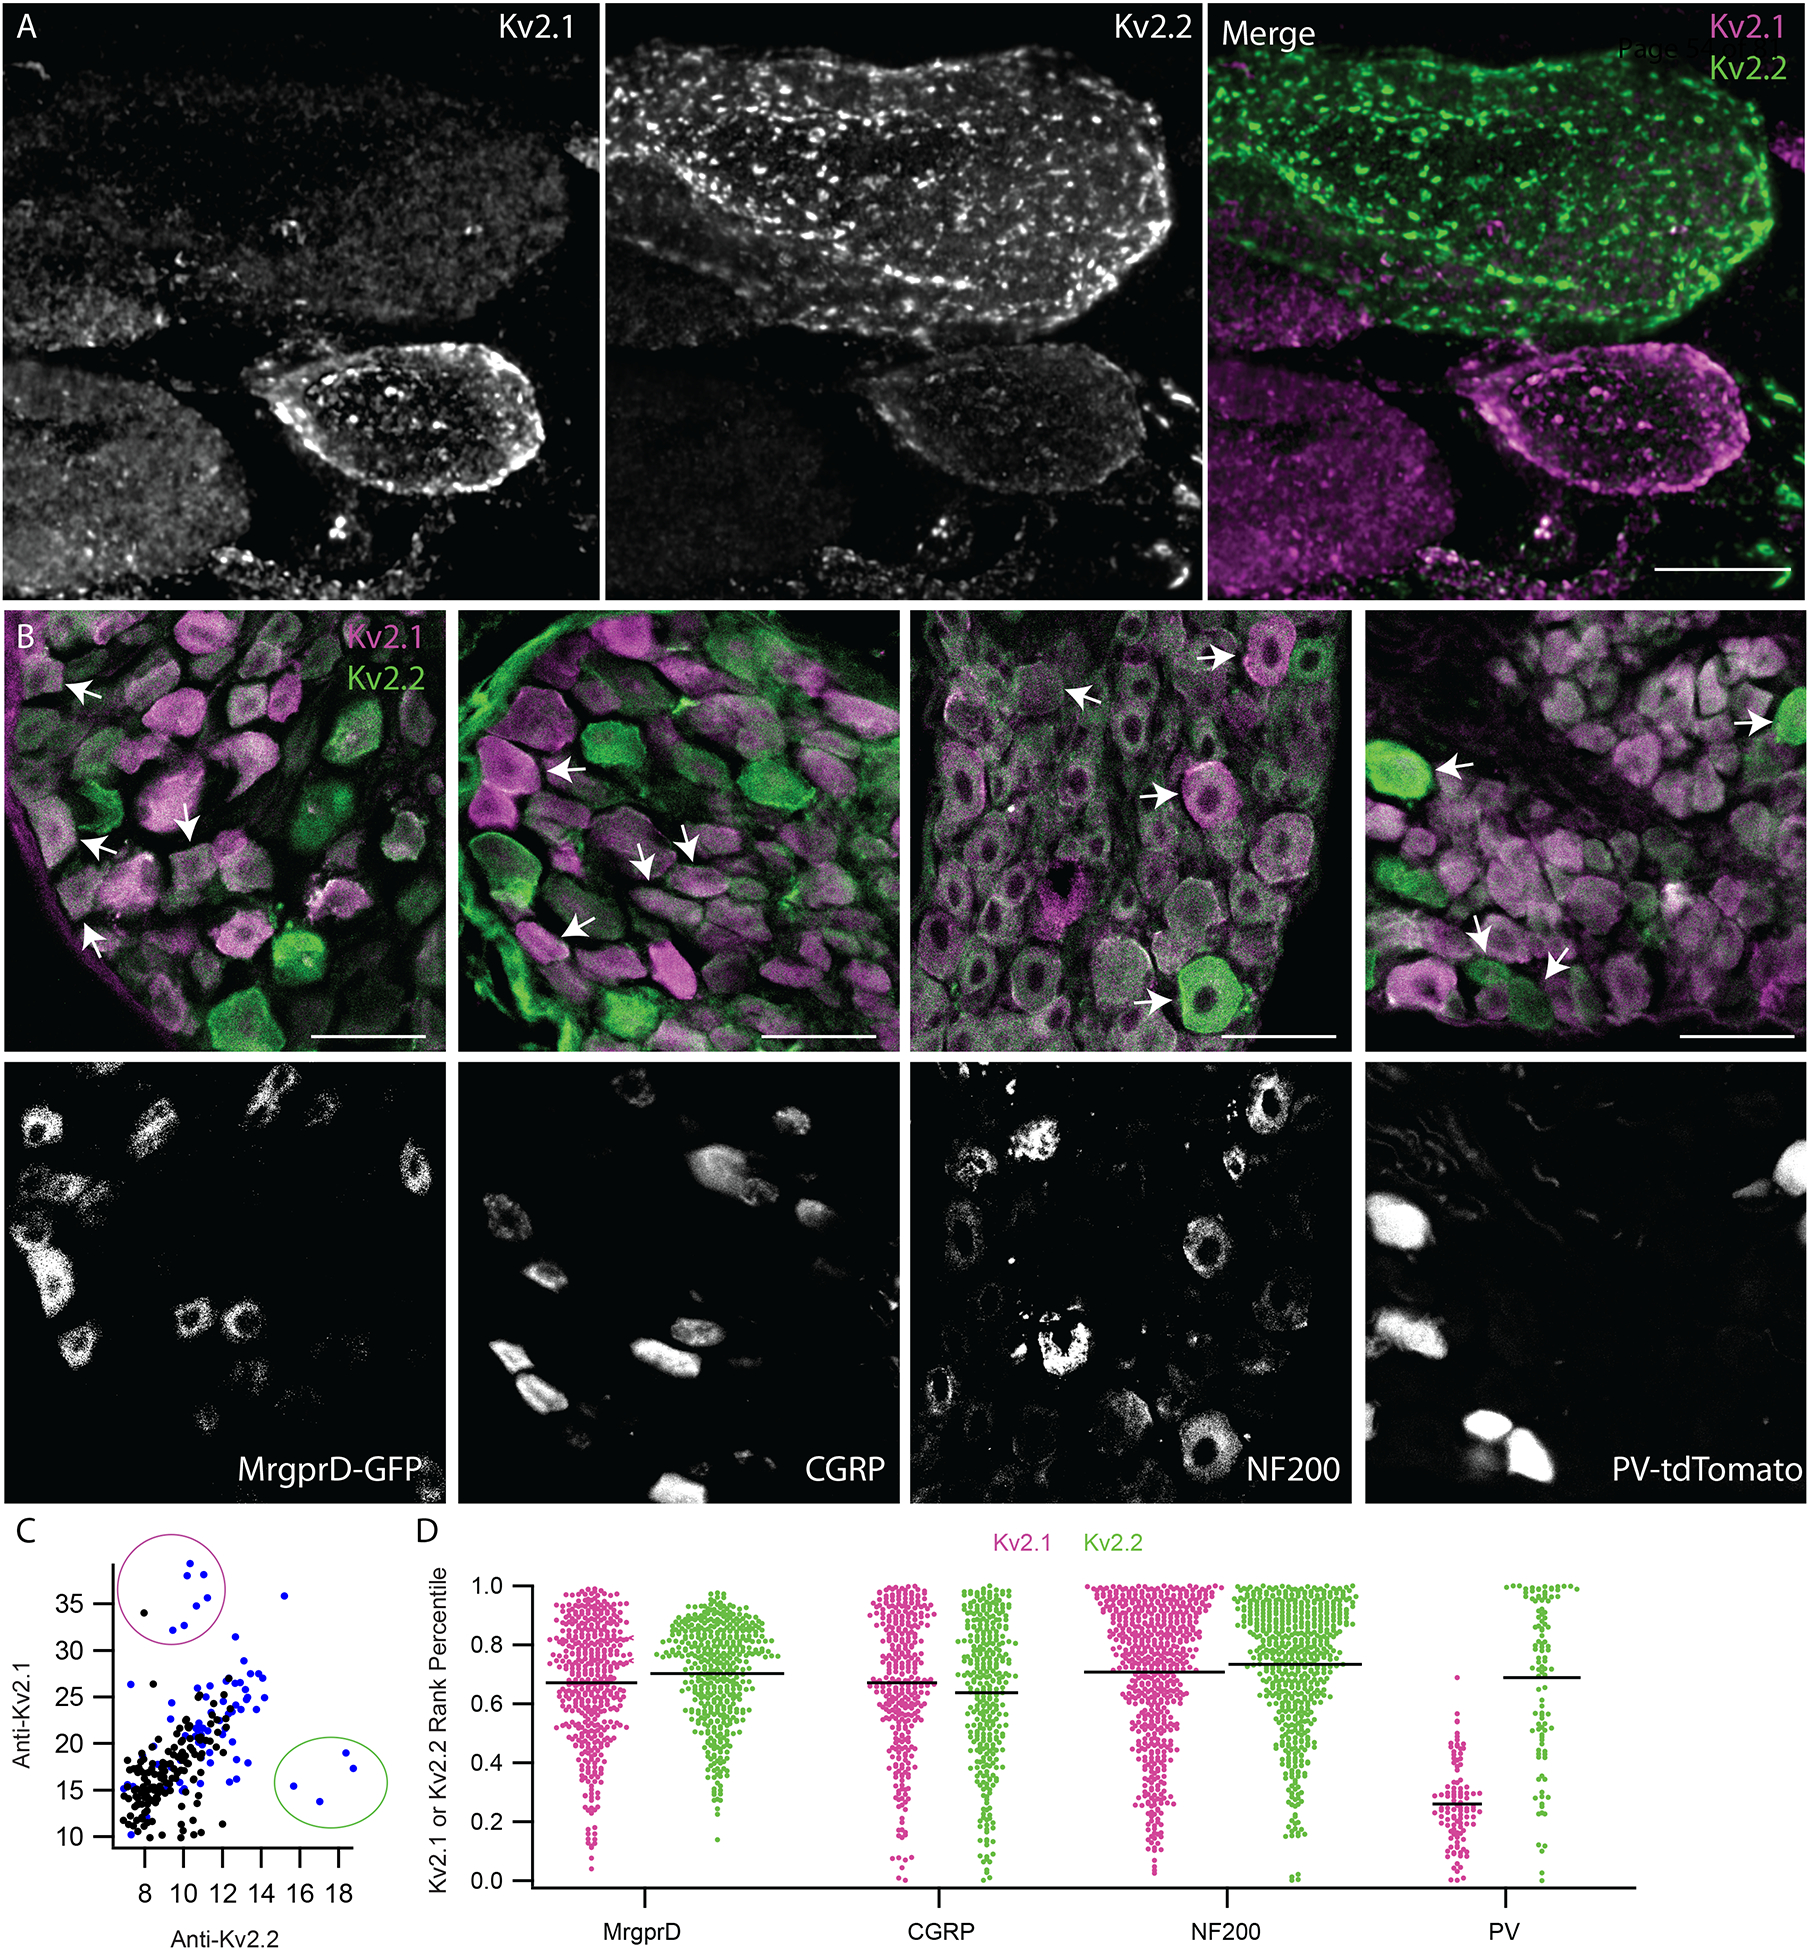
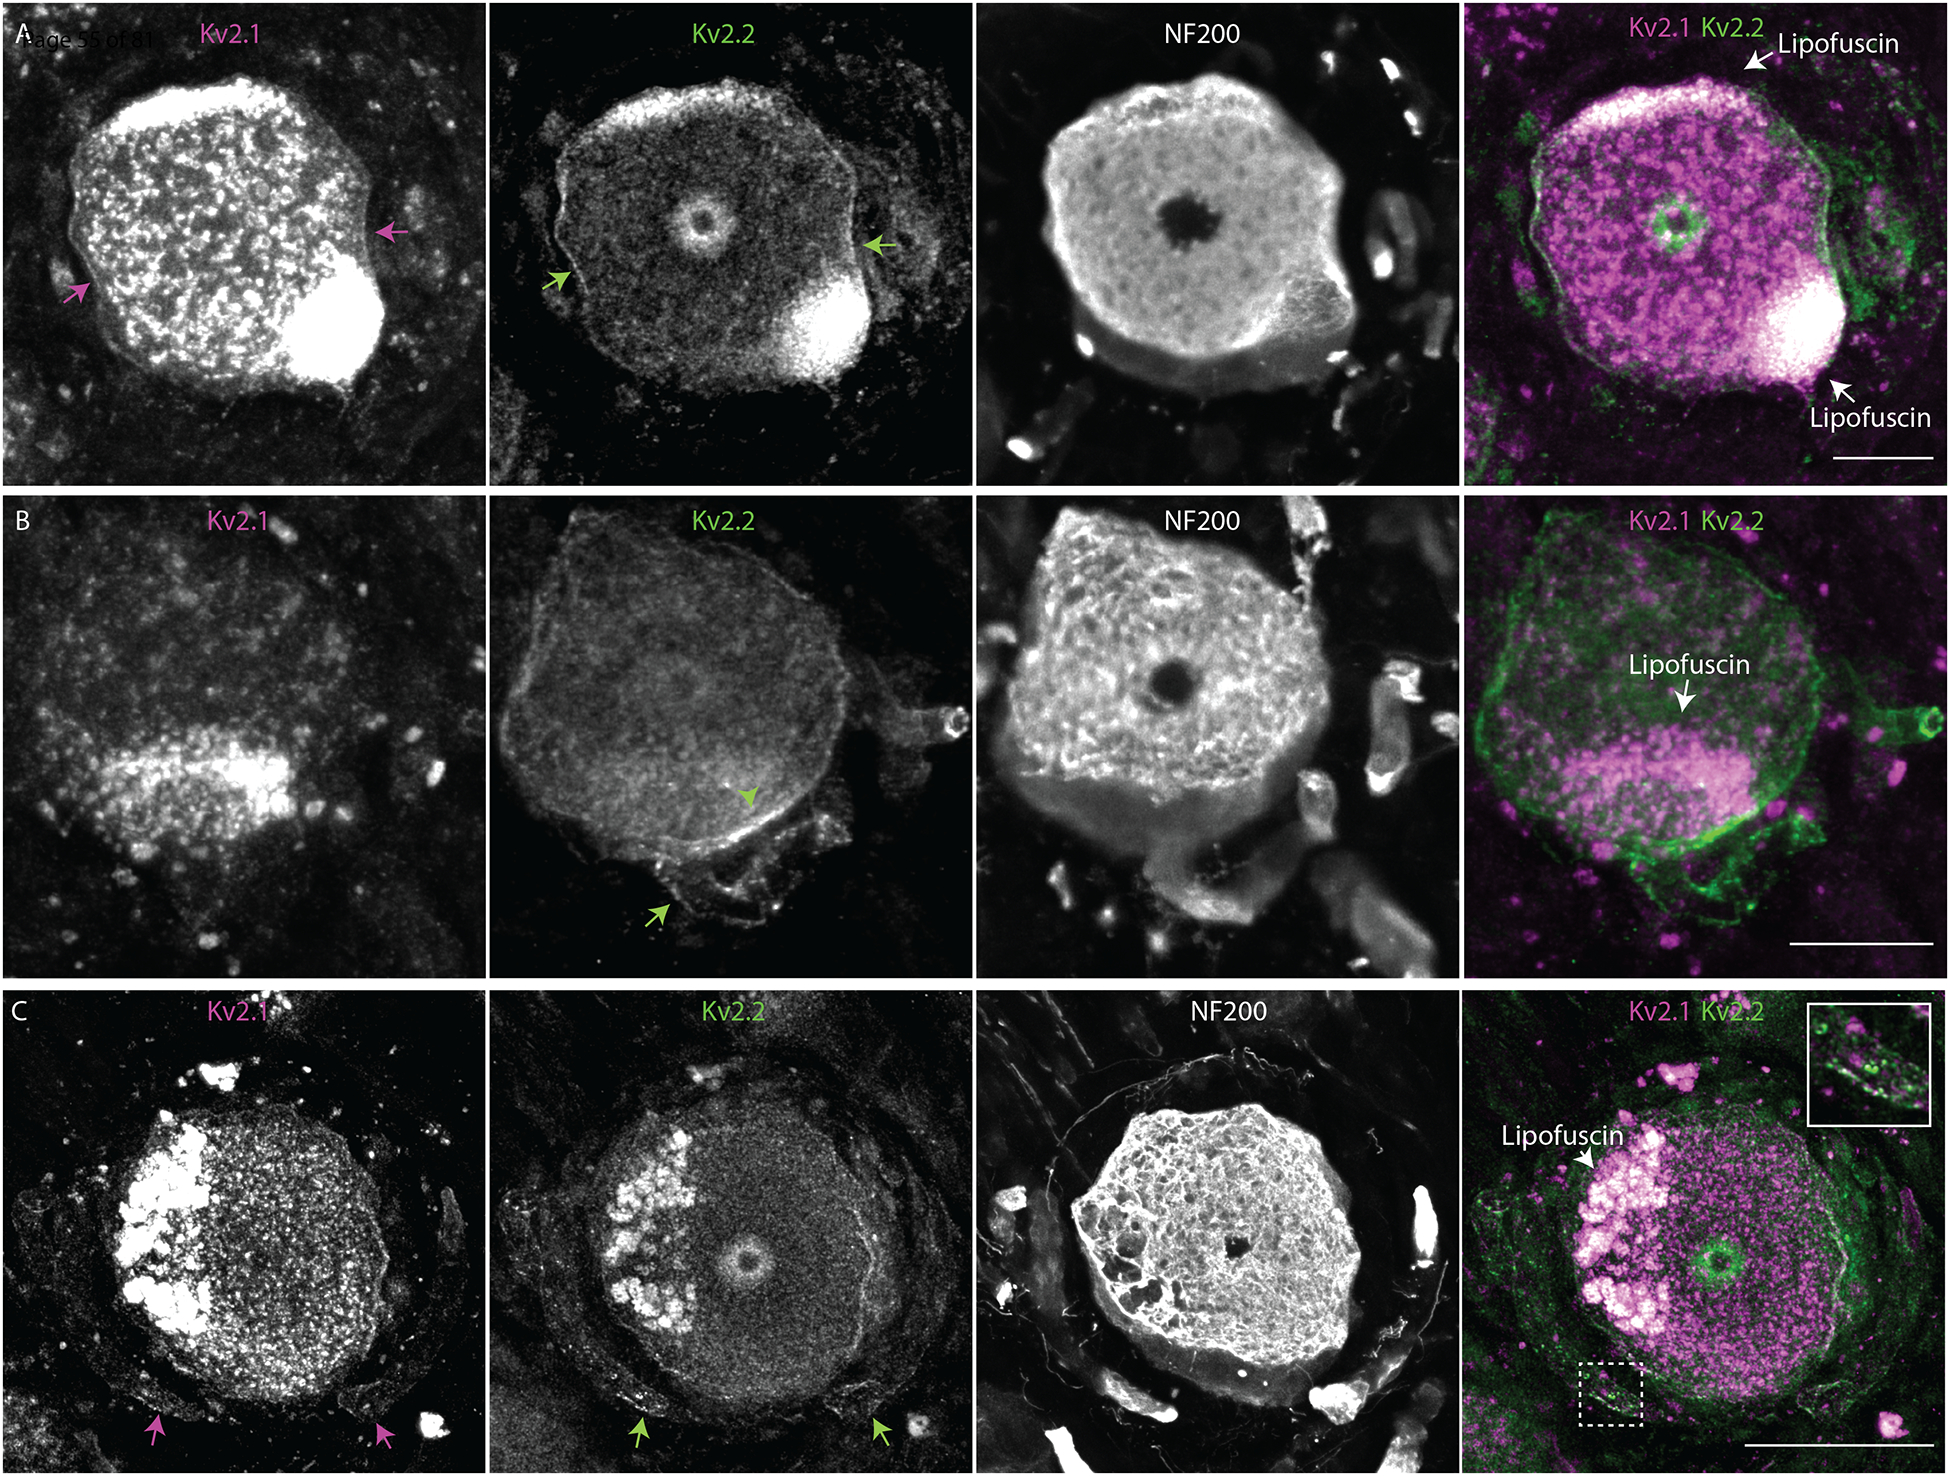
The distinct organization of Kv2 voltage-gated potassium channels on and near the cell body of brain neurons enables their regulation of action potentials and specialized membrane contact sites. Somatosensory neurons have a pseudounipolar morphology and transmit action potentials from peripheral nerve endings through axons that bifurcate to the spinal cord and the cell body within ganglia including the dorsal root ganglia (DRG). Kv2 channels regulate action potentials in somatosensory neurons, yet little is known about where Kv2 channels are located. Here, we define the cellular and subcellular localization of the Kv2 paralogs, Kv2.1 and Kv2.2, in DRG somatosensory neurons with a panel of antibodies, cell markers, and genetically modified mice. We find that relative to spinal cord neurons, DRG neurons have similar levels of detectable Kv2.1 and higher levels of Kv2.2. In older mice, detectable Kv2.2 remains similar, while detectable Kv2.1 decreases. Both Kv2 subtypes adopt clustered subcellular patterns that are distinct from central neurons. Most DRG neurons co-express Kv2.1 and Kv2.2, although neuron subpopulations show preferential expression of Kv2.1 or Kv2.2. We find that Kv2 protein expression and subcellular localization are similar between mouse and human DRG neurons. We conclude that the organization of both Kv2 channels is consistent with physiological roles in the somata and stem axons of DRG neurons. The general prevalence of Kv2.2 in DRG as compared to central neurons and the enrichment of Kv2.2 relative to detectable Kv2.1 in older mice, proprioceptors, and axons suggest more widespread roles for Kv2.2 in DRG neurons.

Keywords: Kv2.1; Kv2.2; dorsal root ganglion; somatosensory neurons; voltage-gated ion channels.


Conflict of interest statement

Conflict of interest statement: The authors declare no competing conflicts of interest.

Figures

Figure 1
Figure 1
Kv2.1 and Kv2.2 protein are enriched at the outer edge of DRG neuron somas relative to Nav1.8. Lumbar DRG section from an 11 week old male mouse labeled with antibodies which target Kv2.1, Kv2.2 or Nav1.8. A, Anti-Kv2.1 (magenta) and anti-Kv2.2 (green) immunofluorescence in a lumbar DRG section. Scale bar is 100 μm. B, Anti-Kv2.1, anti-Kv2.2 and anti-Nav1.8 immunofluorescence from box shown in A. Arrows indicate prominent localization of anti-Kv2 immunofluorescence at the edge of DRG neuron somas. In merge image anti-Kv2.1, anti-Kv2.2 and anti-Nav1.8 immunofluorescence is magenta, green and blue respectively. Scale bar is 20 μm. C, Representative ROIs that encompass the outer edge of DRG neurons (arrow 1) and the region just inside the outer edge (arrow 2). D, Ratio of anti-Kv2.1, anti-Kv2.2 or anti-Nav1.8 immunofluorescence from outer and inner ROIs for individual neurons from image in A. Bars represent mean. One-way ANOVA p < 0.001. p values in figure represent post hoc Tukey’s test. N = 1 mouse, n = 124 neurons. Detailed information on mouse used can be found in table 1.
Figure 2
Figure 2
Kv2.1 protein is detectable in mouse DRG neurons. A, WT (top) and Kv2.1 KO (bottom) DRG sections taken from 7 week old female mice from the 13th thoracic DRG immunolabeled for Kv2.1 (magenta) and BIII tubulin (white). Images were taken with identical imaging settings and are set to the same brightness and contrast. Scale bars are 100 μm. B, Distribution of fluorescence intensity from manual analysis of WT (black) and Kv2.1 KO (red) neurons. Dotted lines represent mean. Data represent fluorescence intensity of 254 WT profiles from 10 DRG sections from 1 mouse or 375 Kv2.1 KO profiles from 5 DRG sections from 1 mouse. Images shown in A represent one section from WT and Kv2.1 KO mice used in this data set. C, Distribution of fluorescence intensity from automated analysis of the same data set shown in B. Dotted lines represent mean. Data represent fluorescence intensity of 476 WT or 576 Kv2.1 KO profiles selected by automated analysis method. D, Distribution of BIII tubulin fluorescence intensity from the same WT (black) and Kv2.1 KO (red) profiles shown in C. Dotted lines represent mean. E, Mean fluorescence intensity of Kv2.1 KO neurons normalized to WT neurons labeled with anti-Kv2.1, anti-Kv2.2 and anti-BIII tubulin antibodies. Each point represents one Kv2.1 KO mouse normalized to one age and sex matched WT mouse which was stained simultaneously and imaged with identical microscopy settings. The color of each point represents the same mouse and purple points represent data from the mouse whose DRG immunofluorescence data are shown in A, B, C and D. one-way ANOVA p < 0.001. p values in figure represent post hoc Tukey’s test. F, Percentage of ROIs with anti-Kv2.1 immunofluorescence above the mean immunofluorescence of 5 mice (1 female and 4 male). Point colors correspond to the WT mice analyzed in E. All mice were compared to age and sex matched Kv2.1 KO mice. N = 5 WT and 5 Kv2.1 KO mice. G, Kv2.1 KO data shown in B fit with a log normal distribution (red fit). H, WT data shown in B fit with the Kv2.1 KO distribution (red fit) where width and mean were constrained to the Kv2.1 KO distribution and amplitude was unconstrained (equation 1). Red dotted line represents the mean of the Kv2.1 KO distribution. Only WT data to the left of red dotted line was used for the fit. I, Percentage of ROIs with detectable Kv2.1 protein of 5 mice (1 female and 4 males). Point colors correspond to the WT mice analyzed in E. All mice were compared to age and sex matched Kv2.1 KO mice. N = 5 WT and 5 Kv2.1 KO mice. Detailed information on each mouse used can be found in table 1.
Figure 3
Figure 3
Kv2.2 protein is detectable in mouse DRG neurons. A, WT (top) and Kv2.2 KO (bottom) DRG sections from the 13th thoracic DRG in 7 week old male mice immunolabeled for Kv2.2 (green) and NF200 (white). Identical imaging and display settings. Scale bars are 100 μm. B, Distribution of fluorescence intensities from manual analysis of WT (black) and Kv2.2 KO (red) profiles. Dotted lines represent mean. Data represents fluorescence intensities from 241 WT profiles from 11 DRG sections and 1 mouse or 130 Kv2.2 KO profiles from 6 DRG sections and 1 mouse. Images shown in A represent one section from WT and Kv2.1 KO mice used in this data set. C, Distribution of fluorescence intensity from automated analysis of the same data set shown in B. Dotted lines represent mean. Data represent fluorescence intensity of 673 WT or 400 Kv2.2 KO profiles selected by automated analysis method. D, Distribution of anti-NF200 immunofluorescence intensity from the same WT (black) and Kv2.2 KO (red) neurons shown in B. Dotted lines represent mean. E, Mean fluorescence intensity of Kv2.2 KO ROIs normalized to WT neurons labeled with anti-Kv2.1, anti-Kv2.2 and anti-NF200 antibodies. Each point represents one Kv2.2 KO mouse normalized to one age and sex matched WT mouse which was stained simultaneously and imaged with identical microscopy settings. The color of each point represents the same mouse and purple points represent data from the male mouse whose DRG immunofluorescence data are shown in A, B and C. Missing points in anti-Kv2.1 column are because some sections were not labeled with anti-Kv2.1 antibodies. one-way ANOVA p < 0.001. p values in figure represent Tukey’s post hoc test. F, Kv2.2 KO data shown in B fit with a log normal distribution (red fit). G, WT data shown in B fit with the Kv2.2 KO distribution (red fit) where width and mean were constrained to the Kv2.2 KO distribution and amplitude was unconstrained (equation 1). Red dotted line represents the mean of the Kv2.2 KO distribution. Only WT data to the left of red dotted line was used for the fit. H, Percentage of ROIs with detectable Kv2.2 protein of 8 mice (7 males and 1 female). Point colors correspond to the WT mice analyzed in D. All mice were compared to age and sex matched Kv2.2 KO mice. N = 8 WT and 8 Kv2.2 KO mice. Detailed information on each mouse used can be found in table 1.
Figure 4
Figure 4
Detectable Kv2.1 protein decreases in older mice while detectable Kv2.2 does not. A, DRG sections from the 13th thoracic DRG in 7 week (left) and 50 week (right) old mice immunolabeled for Kv2.1. Vertical bar on right is pseudo coloring key for pixel intensity. Identical imaging and display settings. Scale bars are 100 μm. B, Distribution of fluorescence intensities from 7 week old WT (black) and 7 week old Kv2.1 KO (red) ROIs generated by automated method. 609 WT ROIs from 1 mouse. 367 Kv2.1 KO ROIs from 1 mouse. C, Distribution of fluorescence intensities from 50 week old WT (black) and 50 week old Kv2.1 KO (red) ROIs. 793 WT ROIs from 1 mouse. 378 Kv2.1 KO ROIs from 1 mouse. D, Percentage of ROIs with detectable Kv2.1 protein in 7–16 week old and 50 week old mice. Data from 7–16 week old mice is the same data in Figure 2. N = 4 mice 7 weeks old and 1 mouse 16 weeks old and N = 5 mice 50 weeks old. Detailed information on each mouse used can be found in table 1. E, DRG sections from the 13th thoracic DRG in 7 week (left) and 50 week (right) old mice immunolabeled for Kv2.2. Vertical bar on right is pseudo coloring key for pixel intensity. Identical imaging and display settings. Scale bars are 100 μm. F, Distribution of fluorescence intensities from 7 week old WT (black) and 7 week old Kv2.2 KO (red) ROIs generated by automated method. 746 WT ROIs from 1 mouse. 717 Kv2.2 KO ROIs from 1 mouse. Data from same mice shown in E. G, Distribution of fluorescence intensities from 50 week old WT (black) and 50 week old Kv2.2 KO (red) ROIs generated by automated method. 671 WT ROIs from 1 mouse. 398 Kv2.2 KO ROIs from 1 mouse. Data from same mice shown in E. H, Percentage of ROIs with detectable Kv2.2 protein in 7–24 week old and 50 week old mice. Data is the same data from Figure 3 where mice were separated into a young group (7–24 weeks) and an old group (50 weeks). N = 3 mice 7 weeks old, 1 mouse 24 weeks old and 1 mouse 25 weeks old. N = 3 mice 50 weeks old. Detailed information on each mouse used can be found in table 1.
Figure 5
Figure 5
Kv2 channels are expressed at the surface membrane of DRG neurons. A, Fluorescence of live dissociated DRG neurons excited at 594 nm before (top left) and after (bottom left) application of 100 nM GxTX-594. Fluorescence from membrane marker WGA-405 before (top middle) and after application of 100 nM GxTX-594 (bottom middle). Merge image shows 594 excitation fluorescence (magenta) and 405 excitation fluorescence (green). Scale bar 20 μm. B, Dissociated DRG neurons from WT (top) and Kv2.1/Kv2.2 DKO (bottom) mice before and after the application of GxTX-594, left panel and middle panel respectively. Arrows in middle panel indicate location of surface membrane based on WGA-405 fluorescence. Right images are merge of 594 excitation fluorescence (magenta) and 405 excitation fluorescence (green) after application of 100 nM GxTX-594. Scale bars 100 μm. C, Example of WGA-405 fluorescence (left) used in watershed segmentation (middle) to generate annulus ROI (right) used to analyze fluorescence intensity at the membrane. D, Distribution of fluorescence intensity from WT (black) and Kv2.1/Kv2.2 DKO (red) neurons. Data represents the fluorescence intensity of 326 WT neurons from 1 mouse or 271 Kv2.1/Kv2.2 DKO neurons from 1 mouse. DRG from all levels of the spinal cord were pooled. E, Kv2.1/Kv2.2 DKO data shown in D fit with a log normal distribution (red fit). F, WT data shown in D fit with the Kv2.1/Kv2.2 DKO distribution (red fit) where width and mean were constrained to the Kv2.1/Kv2.2 DKO distribution and amplitude was unconstrained (equation 1). Red dotted line represents the mean of the Kv2.1/Kv2.2 DKO distribution. Only WT data to the left of red dotted line was used for the fit. G, Percentage of neurons with detectable surface Kv2 protein, from an experiment where one WT mouse was compared to one DKO mouse and an identical experiment where two WT mice were compared to one DKO mouse (N=3 WT mice N=2 Kv2.1/Kv2.2 DKO mice). N = 3 WT mice and N = 2 DKO mice. Detailed information on each mouse used can be found in table 1.
Figure 6
Figure 6
DRG neurons have enriched Kv2.2 protein compared to neurons in the spinal cord. A, Anti-Kv2.1 (magenta) and anti-Kv2.2 (green) immunofluorescence in a spinal cord section from the 2nd lumbar vertebra (left). Anti-Kv2.1 immunofluorescence (right top) and anti-Kv2.2 immunofluorescence (right bottom). Arrows show neurons in the spinal cord with punctate anti-Kv2.1 immunofluorescence. Arrow heads show neurons in the spinal cord with anti-Kv2.2 immunofluorescence. Scale bars are 500 μm. B, Anti-Kv2.1 immunofluorescence from individual neuron profiles (circles) from multiple mice in the DRG and ventral horn normalized to the average fluorescence intensity of neuron profiles in the ventral horn. Diamonds to the right of data represent the average intensity of individual mice. Significant differences from 1 were calculated for individual mice using Students t-test. N = 5 mice, n = 295 in DRG and n = 200 in ventral horn. Detailed information on each mouse used can be found in table 1. C, Identical analysis as in panel B but with anti-Kv2.2 immunofluorescence.
Figure 7
Figure 7
Kv2 channels form clusters on DRG neuron somas and stem axons that are distinct from Kv2 channel clusters on ventral horn neurons. A, Z-projection of anti-Kv2.1 and anti-Kv2.2 immunofluorescence in a ventral horn neuron from the 1st lumbar vertebra of a 7 week old male mouse. B, Z-projection of anti-Kv2.1 and anti-Kv2.2 immunofluorescence in DRG neurons from the same mouse and section of the spinal column as neuron shown in A. Inset is enlargement of the Kv2.1 donut cluster in dotted box. C, Z-projection of anti-Kv2.1 and anti-Kv2.2 immunofluorescence in DRG neurons from the same mouse as A and B. Inset is enlargement of the Kv2.2 donut cluster in dotted box. D, Z-projection of anti-Kv2.1 immunofluorescence in DRG neuron from the 13th thoracic DRG of a 24 week old male mouse. E, Z-projection of anti-Kv2.1 and anti-Kv2.2 immunofluorescence in DRG neuron from same mouse in D. F, Exemplar ROI for analyzing localization of Kv2 channel density relative to stem axon. Same image as E. ROI line width is 1.24 μm. Numbers along line indicate approximate distance from stem axon normalized to the midpoint of the line. G, Anti-Kv2.1 (magenta) and anti-Kv2.2 (green) immunofluorescence intensity along the ROI shown in F. Distance along the line was normalized such that the stem axon is 0 and the midpoint of the line is 1. H, Analysis of the relative distance from the stem axon of the max anti-Kv2.1 or anti-Kv2.2 immunofluorescence. Dotted line represents the middle of neurons relative to the stem axon. In all images arrows indicate asymmetrical clusters of Kv2 channels while arrow heads indicate the apparent stem axons. Display settings are not identical between images. Scale bars are 20 μm.
Figure 8
Figure 8
Kv2.2 channels are expressed in peripheral axons of DRG neurons. A, WT (top) and Kv2.2 KO (bottom) sections containing the DRG, peripheral and central axons from the 1st lumbar DRG in age and sex matched 7 week old mice immunolabeled for NF200 (white). Scale bar is 1 mm. B, High magnification z-projection of anti-Kv2.2 and anti-NF200 immunofluorescence from box 1 in A of WT and Kv2.2 KO mice. Arrows indicate myelinated axons which show prominent anti-Kv2.2 immunofluorescence. Scale bars are 20 μm. C, High magnification z-projection of anti-Kv2.2 and anti-NF200 immunofluorescence from box 2 in A of WT and Kv2.2 KO mice. Arrows indicate myelinated axons which show prominent anti-Kv2.2 immunofluorescence. Scale bars are 20 μm. D, High magnification z-projection of anti-Kv2.2 immunofluorescence and MrgprD-GFP fluorescence in the peripheral axons of the 12th thoracic DRG of a 13 week old MrgprD-GFP mouse. Arrow indicates anti-Kv2.2 immunofluorescence on a GFP+ axon. Scale bar is 10 μm.
Figure 9
Figure 9
Anti-Kv2 immunofluorescence intensities are non-uniform across DRG neuron subtypes. A, Exemplar z-projection of enrichment of anti-Kv2.1 (magenta) or anti-Kv2.2 (green) immunofluorescence in neighboring neurons. DRG section is from a 10 week old male mouse. Scale bar is 10 μm. B, Top images show anti-Kv2.1 (magenta) and anti-Kv2.2 (green) immunofluorescence in DRG sections where subpopulation specific markers were used to identify, from left to right, non-peptidergic nociceptors, peptidergic nociceptors, myelinated neurons and proprioceptors. Fluorescence from specific markers is shown in bottom panels. Arrows indicate four exemplar neurons that have clear positivity for each subpopulation identified by fluorescence in lower panels. CGRP and NF200 subpopulations were identified using anti-CGRP and anti-NF200 antibodies while MrgprD-GFP and PV-tdTomato subpopulations were from transgenic mouse lines. Scale bars are 50 μm. C, Scatter plot of anti-Kv2.1 and anti-Kv2.2 immunofluorescence of individual neuron profiles. Each point represents one profile. Magenta circle highlights the subpopulation of profiles that have high anti-Kv2.1 but low anti-Kv2.2 immunofluorescence while the green circle highlights the subpopulation of profiles that have high anti-Kv2.2 but low anti-Kv2.1 immunofluorescence. Blue points represent myelinated DRG neuron profiles identified by NF200 immunofluorescence. D, Ranked anti-Kv2.1 immunofluorescence (magenta points) or ranked anti-Kv2.2 immunofluorescence (green points) of individual profiles from subpopulations shown in B. Only profiles that were positive for each marker are shown. Each point represents one profile. MrgprD population N = 4 mice, CGRP population N = 3 mice, NF200 population N = 3 mice and PV population N = 2 mice. Detailed information on each mouse used can be found in table 1.
Figure 10
Figure 10
Kv2 channel expression and localization in human DRG neurons is similar to mice. A, Immunofluorescence from human DRG neurons labeled with anti-Kv2.1 and anti-Kv2.2 antibodies. Autofluorescence attributed to lipofuscin is labeled in right panel while apparent Kv2.1 and Kv2.2 protein are labeled in left and middle panel respectively. Scale bar is 50 μm. B, Z-projection of anti-Kv2.2 (left) and anti-NF200 immunofluorescence (middle) of human DRG neuron somata. Green arrow head indicates asymmetric distribution of Kv2.2 clusters on neuron soma, green arrow indicates the apparent stem axon. Scale bar is 20 μm. C, Z-projection of anti-Kv2.1 (upper left), anti-Kv2.2 (upper right) and anti-NF200 (lower left) immunofluorescence of a human DRG neuron. Magenta and green arrows indicate Kv2.1 and Kv2.2 respectively on the apparent stem axon. Inset shows expansion of dotted line boxes which highlights Kv2.1 and Kv2.2 clusters on the apparent stem axon. Autofluorescence attributed to lipofuscin is labeled in lower right panel. Scale bar is 50 μm. All images are from donor #1. Detailed information on each donor can be found in the Human Tissue Collection section of the methods.

Update of

Similar articles

Cited by

References

    1. Bishop HI, Cobb MM, Kirmiz M, Parajuli LK, Mandikian D, Philp AM, … Trimmer JS (2018). Kv2 ion channels determine the expression and localization of the associated AMIGO-1 cell adhesion molecule in adult brain neurons. Front Mol Neurosci, 11, 1. doi:10.3389/fnmol.2018.00001 - DOI - PMC - PubMed
    1. Bishop HI, Guan D, Bocksteins E, Parajuli LK, Murray KD, Cobb MM, … Trimmer JS (2015). Distinct cell- and layer-specific expression patterns and independent regulation of Kv2 channel subtypes in cortical pyramidal neurons. J Neurosci, 35(44), 14922–14942. doi:10.1523/jneurosci.1897-15.2015 - DOI - PMC - PubMed
    1. Blaine JT, & Ribera AB (1998). Heteromultimeric potassium channels formed by members of the Kv2 subfamily. J Neurosci, 18(23), 9585–9593. doi:10.1523/jneurosci.18-23-09585.1998 - DOI - PMC - PubMed
    1. Bocksteins E (2016). Kv5, Kv6, Kv8, and Kv9 subunits: No simple silent bystanders. J Gen Physiol, 147(2), 105–125. doi:10.1085/jgp.201511507 - DOI - PMC - PubMed
    1. Bocksteins E, Raes AL, Van de Vijver G, Bruyns T, Van Bogaert PP, & Snyders DJ (2009). Kv2.1 and silent Kv subunits underlie the delayed rectifier K+ current in cultured small mouse DRG neurons. Am J Physiol Cell Physiol, 296(6), C1271–1278. doi:10.1152/ajpcell.00088.2009 - DOI - PMC - PubMed

Publication types

LinkOut - more resources