. 2024 Jan 23;13(3):202.
doi: 10.3390/cells13030202.

Synergistic Protection of Retinal Ganglion Cells (RGCs) by SARM1 Inactivation with CNTF in a Rodent Model of Nonarteritic Anterior Ischemic Optic Neuropathy

Affiliations

Synergistic Protection of Retinal Ganglion Cells (RGCs) by SARM1 Inactivation with CNTF in a Rodent Model of Nonarteritic Anterior Ischemic Optic Neuropathy

Yan Guo et al. Cells. .

Abstract

We evaluated whether inhibiting sterile alpha and (Toll/interleukin receptor (TIR)) motif-containing 1 (SARM1) activity protects retinal ganglion cells (RGCs) following ischemic axonopathy (rodent nonarteritic anterior ischemic optic neuropathy: rNAION) by itself and combined with ciliary neurotrophic factor (CNTF). Genetically modified SARM1(-) rats were rNAION-induced in one eye and compared against equivalently induced wild-type animals of the same background. Optic nerve (ON) diameters were quantified using optical coherence tomography (SD-OCT). RGCs were quantified 30 d post-induction using retinal stereology for Brn3a(+) nuclei. ON sections were analyzed by TEM and immunohistochemistry. SARM1(-)(-) and WT animals were then bilaterally sequentially rNAION-induced. One eye received intravitreal vehicle injection following induction; the contralateral side received CNTF and was analyzed 30 d post-induction. Inhibiting SARM1 activity suppressed axonal collapse following ischemic axonopathy. SARM1(-) animals significantly reduced RGC loss, compared with WT animals (49.4 ± 6.8% RGC loss in SARM1(-) vs. 63.6 ± 3.2% sem RGC loss in WT; Mann-Whitney one-tailed U-test, (p = 0.049)). IVT-CNTF treatment vs. IVT-vehicle in SARM1(-) animals further reduced RGC loss by 24% at 30 d post-induction, but CNTF did not, by itself, improve long-term RGC survival in WT animals compared with vehicle (Mann-Whitney one-tailed t-test; p = 0.033). While inhibiting SARM1 activity is itself neuroprotective, combining SARM1 inhibition and CNTF treatment generated a long-term, synergistic neuroprotective effect in ischemic neuropathy. Combinatorial treatments for NAION utilizing independent neuroprotective mechanisms may thus provide a greater effect than individual treatment modalities.

Keywords: axonopathy; ciliary neurotrophic factor; ischemia; neuroprotection; nonarteritic anterior ischemic optic neuropathy (NAION); optic nerve; retinal ganglion cells; rodent; sterile alpha and (toll/interleukin receptor (TIR)) motif-containing 1 (SARM1); synergism.


Conflict of interest statement

The authors declare no conflicts of interest.

Figures

Figure 1
Figure 1
Comparison of RGC axonal structure 5 d post-induction at different distances from the optic nerve periphery. (AD) WT ON. (EH) SARM1 knockout. (A,E) Peripheral region. In intact axons and myelination, the axoplasm is granular and myelin is compact. (B,F) Mid-peripheral region. WT (B) intact axons are mingled with axons with degenerating myelin (double arrows) and axoplasm with a loss of granularity and density. Axoplasm in the SARM1(−)(−) ON axons is intact, but some axons have myelin swelling (arrowheads). (C,G) Central region-1. (C) All WT axons are degenerating, and there are dense inclusions in some of the degenerating axons (arrowhead). In contrast, some affected SARM1(−) axons show axoplasmic fragmentation (asterisks), and there is preservation of some small axons (double arrowheads). (D,H) Central region-2. (D) Degenerating WT axons show radiolucent areas (double arrows) and widespread myelin dissolution, while SARM1(−)(−) ONs (H) show myelin fragmentation rather than dissolution and relatively intact axoplasm. Scale bar in (E) 500 nm.
Figure 2
Figure 2
SARM1 loss inhibits early ON axonal and myelin degeneration. 20X magnification: (A,D) 40X magnification: (B,C,E,F). WT: (AC) Effects of rNAION on WT ON at 5 d post-induction. (A) Low power (20X). There is an uneven distribution of MBP (green) and SMI312/axonal neurofilaments (red), with a central loss of MBP signal, but with preservation of MBP in some of the peripheral areas (arrowheads). (B) Peripheral area. Preservation of myelinated axons in the far periphery. There is a progressive loss of intact axons in the more central region (indicated by arrow). (C) Central area (40X). Complete MBP loss, with accumulation of large clumps of SMI312 signal and loss of normal axonal distribution. (DF) Effects of rNAION on SARM1(−) ON at 5 d post-induction. (D) Low power (20X). There is a relatively equal distribution of both MBP and SMI312 signals throughout the nerve. The dark area is a cutting artifact. (E) Peripheral region (40X). Preservation of both myelin and axonal neurofilaments, similar to that seen in the WT periphery. The arrow indicates the direction from the periphery to the center. (F) Central area (40X). There is a relative loss of SMI312 and MBP signal throughout the region, with scattered individual preserved myelinated axons (arrowheads). The MBP signal is reduced throughout the region but is still present, compared with the WT center (compare (F) with (C)). Scalebars in (A) 75 μm. Scale bar in (C) 10 μm.
Figure 3
Figure 3
Eliminating SARM1 activity improves RGC survival in ischemic axonopathy. SD-WT animals (black bar) and SARM1 (−)(−) animals (white bar) were rNAION-induced. (A) Comparison of mean ONH diameters between uninduced and induced WT and SARM1(−)(−) animals. ONH diameters were determined by SD-OCT. ONH diameters from induced animals were determined 2 d post-rNAION. Naïve ONH diameters were obtained from the contralateral (uninduced) eye of each animal. Naïve ONHs from SARM1(−)(−) animals were reduced in size, compared with WT animals. This was statistically significant (p < 0.05; Mann–Whitney two-tailed U-test). Two days post-induction, rNAION results in statistically significant ONH edema-induced expansion, compared with uninduced ONH of either SARM1(−)(−) vs. WT animals (p < 0.005, Mann–Whitney two-tailed test). But when the difference between naïve diameters is taken into consideration, the relative difference in ONH edema between rNAION-induced WT and SARM1(−)(−) eyes is nonsignificant (Mann–Whitney two-tailed test, p = 0.136). (B) Comparison of percent RGC loss in WT vs. SARM1(−)(−) animals. RGC counts were obtained from threshold individuals 30 d post-induction. WT animals show a mean of 63.6 ± 3.2% sem loss, while SARM1(−)(−) animals show a mean of 49.4 ± 6.8% (sem) RGC loss. This difference is statistically significant, p < 0.05; Mann–Whitney one-tailed U-test, p = 0.049. (* p < 0.05; ** p < 0.001).
Figure 4
Figure 4
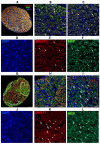
Differences in axonal distribution and myelination in WT and SARM1(−) ONs 30 d post-rNAION induction, following IVT vehicle administration. (AF) WT animal. (GL) SARM1(−) animal. (A,G) are 20X (low power) confocal micrographs of mid-distal ON cross-sections. All other sections are 40X (high power) micrographs. (B) (WT) and (H) (SARM1(−)) are confocal micrographs of the peripheral region. (C) (WT) and (I) (SARM1(−)) are confocal micrographs of the central ON region. (DF) (WT) are the individual channels of (C,JL) and (SARM1(−)) are the individual channels of (I). The arrows in (C,I) are replicated through the individual channels. All individual channels are shown at the identical confocal settings, to show relative differences of structure. WT ONs exhibit fewer intact axons in the periphery and central regions (arrows), while the SARM1(−)(−) ONs show more intact axons, both as isolated and small patches of intact axons. There are more intact (SMI312-neurofilament) axons from the SARM1(−) ON. SARM1(−) ONs also show better myelin preservation in both peripheral and central regions; this is best seen in the individual (MBP) confocal channel from the central region ((L); SARM1(−); compare with (F); WT). SMI312 signal is in red, while myelin basic protein (MBP) is in green. DAPI signal in blue. Scale bars: (A,D) 75 μm. (H) 25 μm.
Figure 5
Figure 5
CNTF provides additional RGC-neuroprotective effects in SARM1(−) animals after bilateral rNAION-induction. Both eyes of each animal were rNAION-induced 1 week apart and intravitreally injected sequentially with 2 μL of either vehicle (PBS) or CNTF (25 ng/μL). Surviving RGCs 30 d post-induction from each pair of eyes were quantified and expressed as a protection ratio (CNTF-RGCs/Vehicle-RGCs). (A) Mean protection ratios: WT-SD rats (white bar: ratio = 0.94 ± 0.27 sem). SARM1(−) rats (black bar: 1.24 ± 0.20 sem). This difference is statistically significant (p = 0.033; Mann–Whitney one-tailed U-test). (BE) RGC survival patterns of equivalently induced animals under different conditions. The dashed lines delineate the regions of maximum RGC loss. (B,C) WT animal. (B) Vehicle treated eye. (C) CNTF-treated eye. There is reduced cell density in the CNTF-treated eye, compared with the vehicle-treated eye. (D,E) SARM1(−) animal. (D) Vehicle-treated eye. (E) CNTF-treated eye. The CNTF-treated eye has an increased number of Brn3a(+) nuclei, compared with the vehicle-treated eye. (*; p < 0.05).
Figure 6
Figure 6
Effects of CNTF after rNAION induction. Axonal (SMI312) and myelin (MBP) patterns. (AC) WT+ CNTF ON (RGC stereological count (261). (DF) SARM1(−)+ CNTF ON (RGC stereological count 742). (A) Low power (20X)/WT. The two areas of maximal intact axons are outlined in white. (B) Peripheral affected region. Intact myelinated axons (arrows) are scattered through an area with considerable axonal loss. (C) Central region. Few intact axons remain; they are scattered throughout the field. (D) Low power/SARM1(−). Many intact axons are present throughout the nerve. While some areas of reduced myelination are present, a strong axonal signal remains. (E) SARM1(−) ON peripheral region with an area of axon loss next to a region of intact axons (dashed line). There are still considerable numbers of intact axons (arrows) even in the regions of axonal loss, and the axonal signal is strong. (F) SARM1(−) ON central region. Many intact axons are present even in areas of greatest loss, with smaller fields of severe axonal loss (outlined), suggesting increased axonal resistance to ischemia. SMI312: red signal. MBP: green signal. DAPI: blue signal. Scale bars: (A,D) 75 μm. (E) 25 μm.

Similar articles

References

    1. Kerr N.M., Chew S.S., Danesh-Meyer H.V. Non-arteritic anterior ischaemic optic neuropathy: A review and update. J. Clin. Neurosci. 2009;16:994–1000. doi: 10.1016/j.jocn.2009.04.002. - DOI - PubMed
    1. Miller N.R., Arnold A.C. Current concepts in the diagnosis, pathogenesis and management of nonarteritic anterior ischaemic optic neuropathy. Eye. 2014;29:65–79. doi: 10.1038/eye.2014.144. - DOI - PMC - PubMed
    1. Chan C.K., Cheng A.C., Leung C.K., Cheung C.Y., Yung A.Y., Gong B., Lam D.S. Quantitative assessment of optic nerve head morphology and retinal nerve fibre layer in non-arteritic anterior ischaemic optic neuropathy with optical coherence tomography and confocal scanning laser ophthalmoloscopy. Br. J. Ophthalmol. 2009;93:731–735. doi: 10.1136/bjo.2008.143297. - DOI - PubMed
    1. Arnold A.C. Pathogenesis of nonarteritic anterior ischemic optic neuropathy. J. Neuroophthalmol. 2003;23:157–163. doi: 10.1097/00041327-200306000-00012. - DOI - PubMed
    1. Behbehani R., Mathews M.K., Sergott R.C., Savino P.J. Nonarteritic anterior ischemic optic neuropathy in patients with sleep apnea while being treated with continuous positive airway pressure. Am. J. Ophthalmol. 2005;139:518–521. doi: 10.1016/j.ajo.2004.11.004. - DOI - PubMed

Publication types

Substances

LinkOut - more resources