. 2024 Feb 8;14(1):3236.
doi: 10.1038/s41598-024-53542-x.

Graft-derived neurons and bystander effects are maintained for six months after human iPSC-derived NESC transplantation in mice's cerebella

Affiliations

Graft-derived neurons and bystander effects are maintained for six months after human iPSC-derived NESC transplantation in mice's cerebella

Liliana S Mendonça et al. Sci Rep. .

Abstract

Machado-Joseph disease (MJD) is a neurodegenerative disorder characterized by widespread neuronal death affecting the cerebellum. Cell therapy can trigger neuronal replacement and neuroprotection through bystander effects providing a therapeutic option for neurodegenerative diseases. Here, human control (CNT) and MJD iPSC-derived neuroepithelial stem cells (NESC) were established and tested for their therapeutic potential. Cells' neuroectodermal phenotype was demonstrated. Brain organoids obtained from the Control NESC showed higher mRNA levels of genes related to stem cells' bystander effects, such as BDNF, NEUROD1, and NOTCH1, as compared with organoids produced from MJD NESC, suggesting that Control NESC have a higher therapeutic potential. Graft-derived glia and neurons, such as cells positive for markers of cerebellar neurons, were detected six months after NESC transplantation in mice cerebella. The graft-derived neurons established excitatory and inhibitory synapses in the host cerebella, although CNT neurons exhibited higher excitatory synapse numbers compared with MJD neurons. Cell grafts, mainly CNT NESC, sustained the bystander effects through modulation of inflammatory interleukins (IL1B and IL10), neurotrophic factors (NGF), and neurogenesis-related proteins (Msi1 and NeuroD1), for six months in the mice cerebella. Altogether this study demonstrates the long-lasting therapeutic potential of human iPSC-derived NESC in the cerebellum.


Conflict of interest statement

The authors declare no competing interests.

Figures
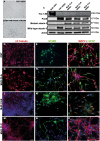
Figure 1
Figure 1
Human iPSC-derived NESC are multipotent and differentiate into neurons and glia. Control (CNT NESC, CNT) and MJD (MJD CLA, MJD CLB, and MJD CLC NESC) iPSC-derived NESC were established from Control and MJD fibroblasts, respectively, through cell reprogramming. Representative widefield microscopy image of (A) CNT NESC and their (B) derived neural cultures after 3 weeks of differentiation. (C) Representative image of western blot analysis showing no pluripotency marker Tra-1–60 in NESC, while the multipotency neuroectodermal marker Pax6 is present in these cells. Data also show the expression of mutant ataxin-3 and wild-type ataxin-3 in the MJD NESC (n = 3 independent experiments). (D-O) Immunofluorescence images of CNT and MJD NESC upon 3 weeks of differentiation exhibiting neurons shown by β3 Tubulin and MAP2 (red) and glia shown by S100B and GFAP (green). DAPI: blue, representative images of 3 independent experiments, scale bars: 50 μm.
Figure 2
Figure 2
Evaluation of synapses, neurite length, and neuronal firing in Control and MJD neurons. Control, MJD CLA, MJD CLB, and MJD CLC iPSC-derived NESC (CNT, MJD CLA, MJD CLB, and MJD CLC, respectively) were differentiated into neural cultures for 3 weeks. Representative immunofluorescence images showing (A) inhibitory postsynaptic terminals, defined as gephyrin-positive (green) puncta on (B, merge) β3 Tubulin-positive (red) neurite. (C) Number of inhibitory postsynaptic terminals per neurite length normalized for CNT NESC (n = 3–4 independent experiments, analyzed neurons: CNT n = 40, MJD CLA n = 22, MJD CLB n = 41, MJD CLC n = 22). Representative immunofluorescence images of excitatory synapses, defined as instances of (D) VGluT1 (green) and (E) PSD95 (red) puncta (F) colocalization on MAP2-positive neurite. (G) Number of excitatory synapses per neurite length normalized for CNT NESC (n = 3–4 independent experiments, analyzed neurons: CNT n = 23, NESC CLA n = 21, MJD CLB n = 33, MJD CLC n = 29). (A, B and D-F) scale bars: 10 μm. (H) Representative immunofluorescence image of MAP2-positive (red) neurite of CNT NESC. (I) Total neurites length per neuron normalized for CNT NESC (n = 2–5 independent experiments, analyzed neurites: CNT n = 128, MJD CLA n = 197, MJD CLB n = 107, MJD CLC n = 101). Scale bar: 20 μm, DAPI: blue. (J-L) Neuronal firing evaluation through the variation of intracellular calcium concentration in neurons by single-cell calcium imaging. Representative images of the calcium fluorescence indicator (Fluo-4, green) in neurons (J) before and (K) after potassium (K+) stimulus. (L) Percentage of cells responding to potassium (neurons) and histamine (neural progenitors) stimulus (n = 4 independent experiments, analyzed neurons: CNT n = 271, MJD CLA n = 271, MJD CLB n = 59, MJD CLC n = 138); (J, K) scale bars: 50 μm. Data are expressed as mean ± SEM, *p < 0.05, **p < 0.01, and ****p < 0.0001, One-way ANOVA followed by Tukey’s post-test.
Figure 3
Figure 3
Evaluation of size, metabolic activity, neuronal firing, and expression of neurotrophic factors and neural progenitors proliferation markers in brain organoids established from human iPSC-derived NESC. Human brain organoids were established from the Control, MJD CLB, and MJD CLC iPSC-derived NESC (CNT ORG, MJD CLB ORG, and MJD CLC ORG, respectively) and cultured for 25 (t25) and 40 (t40) days. Representative widefield pictures of (A) CNT, (B) MJD CLB, and (C) MJD CLC organoids with 25 days, scale bars: 100 μm (n = 18–36 organoids/condition from 3 independent experiments). (D) Organoids’ area normalized for CNT ORG. (E) Cell metabolic activity evaluation through resazurin reduction assay, normalized for CNT ORG, n = 5 independent experiments. (F) Representative pictures showing the fluorescence calcium probe (Fluo-4, green) in single-cell calcium imaging analysis of CNT ORG and MJD CLB before and after potassium (K+) stimulus, showing organoids’ response to potassium at day 40 (CNT ORG n = 4, MJD CLB ORG n = 5 independent experiments). (G) Percentage of cells responding to potassium in CNT and MJD CLB ORG and response amplitude normalized for CNT ORG. Data showed a higher neuronal response in CNT ORG; n = 4–5/group. (H–S) Representative immunofluorescence images of CNT ORG and MJD CLB ORG with 40 days analyzed for (H and I) Nestin (red), (J and K) GFAP (green), (L-O) MAP2 (red), (P and Q) PCP4 (green), and (R and S) mutant ataxin-3 inclusions (red); lower insert in (S) is an image detail showing mutant ataxin-3 inclusions; n = 3 independent experiments. (T-X) and (AC-AF) mRNA levels evaluation of CNT and MJD CLB iPSC-derived NESC (t0) and organoids with 25 (t25) and 40 (t40) days by RT-qPCR. T) PAX6, U) TUBB3, V) MAP2, (W) GFAP, and X) NEFL mRNA levels normalized for t0 CNT (for CNT ORG) and t0 MJD (for MJD ORG); n = 4–5 independent experiments. (Y-AB) Representative immunofluorescence pictures showing (Y and Z) Msi1 (green) and (AA and AB) NeuroD1 (red) protein expression in CNT ORG and MJD CLB ORG; n = 3 independent experiments. (AC) BDNF, (AD) NEUROD1, (AE) NOTCH1, and (AF) MSI1 mRNA levels, normalized for t0 CNT, showing higher mRNA levels in CNT ORG; n = 4–5 independent experiments. Scale bars: 50 μm, DAPI: blue; Data are expressed as mean ± SEM, *p < 0.05, **p < 0.01, ***p < 0.001, and ****p < 0.0001, (G) unpaired t-test with Welch's correction, and (D, E, T-X, and AC-AF) One-way ANOVA followed by Tukey’s post-test.
Figure 4
Figure 4
Neuronal differentiation of Control and MJD iPSC-derived NESC in the cerebellum of adult mice. Representative immunofluorescence confocal microscopy images of MAP2 labeling in mice cerebellar sections two months after cell transplantation. (A-C) Control (CNT NESC), (D-F) MJD CLA (MJD CLA NESC), (G-I) MJD CLB (MJD CLB NESC), and (J-L) MJD CLC (MJD CLC NESC) iPSC-derived NESC expressing GFP (green) survived for 2 months and differentiated into MAP2-positive (red) neurons showed by the colocalization between GFP and MAP2. DAPI: blue, n = 3 mice/group, Scale bars: 100 μm.
Figure 5
Figure 5
Human glia and neurons detected in mice cerebella six months after Control and MJD iPSC-derived NESC transplantation. (A-D and H-J) Control and (E–G and K-M) MJD CLA iPSC-derived NESC expressing GFP (green) were detected in the cerebellum six months after transplantation. (A) Representative fluorescence image illustrating the limited migration of the grafted cells (green) in the adult cerebellum. Representative immunofluorescence confocal microscopy images of (B-G) GFAP (red) and (H-M) MAP2 (red) labeling. Images show that six months after cell transplantation, Control (CNT) and MJD CLA iPSC-derived NESC grafts have GFAP-positive glial cells and MAP2-positive neurons showed by the colocalization between GFP and GFAP and MAP2, respectively. DAPI: blue, n = 3 mice/group, scale bars: (A) 200 μm, (B-M) 100 μm.
Figure 6
Figure 6
Evaluation of microglia recruitment, astrogliosis, cell overproliferation, and cell death in iPSC-derived NESC grafts. (A-H) Two and (I-W) six months after the cerebellar transplantation of Control and MJD iPSC-derived NESC expressing GFP (green), mice cerebellar sections were evaluated for safety parameters. (A-H) Representative fluorescence microscopy images of Iba1 (red) immunolabeling in mice cerebella transplanted with (A and B) CNT NESC, (C and D) MJD CLA NESC, (E and F) MJD CLB NESC, and (G and H) MJD CLC NESC, n = 3 mice/group. Representative fluorescence microscopy pictures of (I) Iba1 and (J) GFAP (red) immunolabeling in mice cerebella transplanted with CNT NESC. Mice transplanted with CNT NESC and MJD NESC, and control mice injected with HBSS, were evaluated for Iba1 levels in cerebellar lobules (K) 6–8 and (L) 10 and for GFAP levels in cerebellar lobules (M) 4–5, (N) 6–8, and (O) 10. (K–O) Iba1 and GFAP relative levels were quantified through cerebellar lobules medium fluorescence intensity normalized for the HBSS-injected NOD.SCID mice (HBSS); n = 3 mice/group. Data are expressed as mean ± SEM, *p < 0.05 and **p < 0.01, One-way ANOVA followed by Tukey’s post-test. Representative fluorescence confocal microscopy pictures of (P-S) cleaved Caspase-3 (red) and (T-W) Ki67 (red) immunolabeling in the cell grafts (green). Scale bars: 100 μm, n = 3 mice/group.
Figure 7
Figure 7
Human iPSC-derived NESC differentiate into neurons expressing Purkinje cell markers and the new neurons establish inhibitory and excitatory synapses in mice cerebella. CNT (CNT NESC) and MJD CLA (MJD NESC) iPSC-derived NESC expressing GFP (green) transplantation, mice cerebella were evaluated for cerebellar neurons differentiation and synapses establishment. Representative immunofluorescence confocal microscopy images showing that the grafted cells differentiated into (A) PCP4- and (B-D) Calbindin-positive (red) cells, markers of Purkinje cells, and in (E–G, J and K) Parvalbumin- and (H and I) GABA-positive (red) cells, showed by the colocalization between GFP (green) and the cell markers (red). D) Representative immunofluorescence confocal microscopy image of human nuclei antigen (HuNu) colocalization with Calbindin. Cerebellar sections analyzed A, C-U) six and B) two months after cell transplantation. Scale bars: (A-C) 50 μm, (D) 20 μm, and (E-K) 10 μm. The lateral panels in (A) and (C) exhibit individual color channels of the cells indicated by the white arrows in the graft, scale bars: 20 μm. White arrows show cells positive for the cell markers. (L, N, Q, and S) Representative immunofluorescence confocal microscopy images showing (L and N) colocalization of puncta positive for presynaptic Synaptophysin (red) and postsynaptic Gephyrin (green) displaying inhibitory synapses in neurites (GFP, white) derived from (L) CNT NESC and (N) MJD NESC transplanted in cerebella. Scale bars: 5 μm, upper small inserts: 1 μm. M and O) 3D representations of Z-stack confocal images, using Imaris software, of presynaptic Synaptophysin (red) and postsynaptic Gephyrin (green) immunolabeling showing inhibitory synapses in neurites (GFP, white) derived from CNT and MJD NESC grafted cells, respectively. Scale bars: (M) 2 μm, O) 0.5 μm; the upper small inserts show a higher magnification of the synapses indicated by the white arrows. (P) Inhibitory synapses number per neurite length normalized for CNT NESC; CNT NESC n = 22 neurites from 3 grafted mice, MJD CLA NESC n = 14 neurites from 3 grafted mice. (Q and S) Colocalization of puncta positive for presynaptic VGluT1 (green) and postsynaptic PSD95 (red) showing excitatory synapses in neurites (GFP, white) derived from (Q) CNT NESC and (S) MJD NESC transplanted in cerebella. Scale bars: 5 μm, upper small inserts: 1 μm; the upper small inserts show a higher magnification of the synapses indicated by the white arrows. (R and T) 3D representations of Z-stack confocal images, using Imaris software, of presynaptic VGluT1 (green) and postsynaptic PSD95 (red) immunolabeling showing excitatory synapses in neurites (GFP, white) derived from CNT and MJD NESC grafted cells, respectively; scale bars: 0.5 μm. U) Excitatory synapses number per neurite length normalized for CNT NESC; CNT NESC n = 17 neurites from 3 grafted mice, MJD CLA NESC n = 14 neurites from 3 grafted mice. DAPI: blue, Data are expressed as mean ± SEM, *p < 0.05, Unpaired t-test with Welch's correction.
Figure 8
Figure 8
Human iPSC-derived NESC grafts maintained the bystander effects in mice cerebella for six months. (A-AI) Six months after Control (CNT NESC) and MJD CLA (MJD NESC) iPSC-derived NESC transplantation in the cerebellum of adult NOD.SCID mice, the cerebellar levels of the neurotrophic factor NGF, anti- (IL10) and pro- (IL1B) inflammatory interleukins, and neurogenesis-related proteins (Msi1 and NeuroD1) were measured. Representative immunofluorescence microscopy images of (A-C) NGF, (H-J) IL10, (O-Q) IL1B, (V-X) Msi1, and (AC-AE) NeuroD1 labeling in the cerebellum of mice injected with (A, H, O, V, and AC) HBSS and transplanted with (B, I, P, W, and AD) CNT NESC and (C, J, Q, X, AE) MJD NESC. Scale bars: 500 μm. Levels of (D-G) NGF, (K-N) IL10, (R-U) IL1B, (Y-AB) Msi1, and (AF-AI) NeuroD1 in cerebellar lobules 4 and 5 (Lobules 4–5), 6 to 8 (Lobules 6–8), 9 (Lobule 9), and 10 (Lobule 10) measured through cerebellar lobules medium fluorescence intensity normalized for the HBSS group. Data revealed increased NGF, IL10, Msi1, and NeuroD1 levels in mice cerebella transplanted with CNT NESC and increased NGF, IL1B, and Msi1 levels in mice cerebella transplanted with MJD NESC; n = 3–5 mice/group. Data are expressed as mean ± SEM, *p < 0.05 and **p < 0.01, One-way ANOVA followed by Tukey’s post-test.

Similar articles

References

    1. Coutinho P, Andrade C. Autosomal dominant system degeneration in Portuguese families of the Azores Islands. A new genetic disorder involving cerebellar, pyramidal, extrapyramidal and spinal cord motor functions. Neurology. 1978;28:703–709. doi: 10.1212/wnl.28.7.703. - DOI - PubMed
    1. Matos CA, de Macedo-Ribeiro S, Carvalho AL. Polyglutamine diseases: The special case of ataxin-3 and Machado-Joseph disease. Prog. Neurobiol. 2011;95:26–48. doi: 10.1016/j.pneurobio.2011.06.007. - DOI - PubMed
    1. Paulson HL, et al. Intranuclear inclusions of expanded polyglutamine protein in spinocerebellar ataxia type 3. Neuron. 1997;19:333–344. doi: 10.1016/S0896-6273(00)80943-5. - DOI - PubMed
    1. Lopes TM, et al. Widespread neuronal damage and cognitive dysfunction in spinocerebellar ataxia type 3. J. Neurol. 2013;260:2370–2379. doi: 10.1007/s00415-013-6998-8. - DOI - PubMed
    1. Mendonca, L. S., Nobrega, C., Hirai, H., Kaspar, B. K. & Pereira de Almeida, L. Transplantation of cerebellar neural stem cells improves motor coordination and neuropathology in Machado-Joseph disease mice. Brain a journal of neurology138, 320–335, doi:10.1093/brain/awu352 (2015). - PubMed