. 2024 Feb 8;9(5):e172848.
doi: 10.1172/jci.insight.172848.

PREX1 improves homeostatic proliferation to maintain a naive CD4+ T cell compartment in older age

Affiliations

PREX1 improves homeostatic proliferation to maintain a naive CD4+ T cell compartment in older age

Huimin Zhang et al. JCI Insight. .

Abstract

The human adult immune system maintains normal T cell counts and compensates for T cell loss throughout life, mainly through peripheral homeostatic proliferation after the ability of the thymus to generate new T cells has rapidly declined at adolescence. This process is mainly driven by STAT5-activating cytokines, most importantly IL-7, and is very effective in maintaining a large naive CD4+ T cell compartment into older age. Here, we describe that naive CD4+ T cells undergo adaptations to optimize IL-7 responses by upregulating the guanine-nucleotide exchange factor PREX1 in older age. PREX1 promotes nuclear translocation of phosphorylated STAT5, thereby supporting homeostatic proliferation in response to IL-7. Through the same mechanism, increased expression of PREX1 also biases naive cells to differentiate into effector T cells. These findings are consistent with the concept that primarily beneficial adaptations during aging, i.e., improved homeostasis, account for unfavorable functions of the aged immune system, in this case biased differentiation.

Keywords: Adaptive immunity; Aging; Immunology; T cells.


Figures
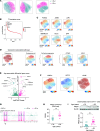
Figure 1
Figure 1. Naive CD4+ T cells from older adults have a quiescence exit gene signature.
(A) UMAPs generated from scATAC-seq data, scRNA-seq data, and combined data sets of peripheral naive CD4+ T cells from 2 young individuals (cyan) and 2 older individuals (magenta). (B) Ranking of ChromVar transcription factor (TF) deviation scores from scATAC-seq data. TFs ranking at the top are indicated. (C) TF deviation scores projected on UMAP space of integrated scRNA-seq/scATAC-seq data. (D) Quiescence-associated pathways or gene scores were projected onto integrated UMAPs. Pathway definition followed the gene grouping criteria described in Cheung and Rando (25). (E) Volcano plot of gene scores from scATAC-seq data comparing cells from young and older adults. Cyan color indicates genes with more accessible regulatory sites in cells from young adults and magenta in those from older adults. Bolded circles highlight some of the top differential genes. (F) Gene score of indicated genes projected on the integrated UMAP space. (G) Genome tracks of the PREX1 promoter region. Magenta shades highlight those peaks more open in older adults. (H) PREX1 transcript levels from bulk RNA-seq. RPKM, reads per kilobase per million mapped reads. Data presented as mean ± SEM. Significance was assessed by 2-tailed, paired Student’s t test. (I) PREX1 immunoblot of naive CD4+ T cells from 5 young and 5 older adults (upper panel). Summary of PREX1 protein expression in naive CD4+ T cells from 10 young and 10 older adults (bottom panel). Data presented as mean ± SEM. Significance was assessed by 2-tailed, unpaired Student’s t test. **P < 0.01.
Figure 2
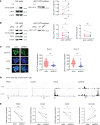
Figure 2. PREX1 upregulates cell cycle gene programs through facilitating STAT5 nuclear translocation.
(A) RAC1-GTP and STAT5 phosphorylation of naive CD4+ T cells from 4 older adults cultured in the presence or absence of IL-7 (5 ng/mL) for 15 minutes. Representative of 2 experiments. Statistical comparison was done by 1-tailed, paired Student’s t test. *P < 0.05. (B) Naive CD4+ T cells from 7 older adults were transfected with either control or PREX1 siRNA and assayed for STAT5 phosphorylation and RAC1-GTP. Statistical comparison was done by 1-tailed, paired Student’s t test. *P < 0.05. (C) Immunofluorescence microscopy images of p-STAT5 (green), nuclei (blue), and merged staining (left panel). Scale bars: 20 μm. Cells from 2 donors were assayed. Data depicted as violin plots showing median and quartiles. Statistical comparison was done for each donor by 2-tailed, unpaired Student’s t test. **P < 0.01. (D) STAT5 ChIP-seq (32) genome tracks of PREX1 and indicated cell cycle genes after IL-2 stimulation. (E) Relative gene expression of PREX1 and cell cycle genes after PREX1 silencing of naive CD4+ T cells from 3 older adults and after 12 days of incubation with IL-7 (5 ng/mL). Statistical comparison was done by 1-tailed, unpaired Student’s t test. *P < 0.05. **P < 0.01.
Figure 3
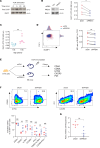
Figure 3. PREX1 accelerates homeostatic proliferation of naive CD4+ T cells.
Naive CD4+ T cells from older adults were transfected with control or PREX1 siRNA, incubated with IL-7 (5 ng/mL) for 14–20 days, and assayed for (A) apoptosis (n = 3), (B) CellTrace Violet (CTV) dilution (n = 4), and (C) Ki-67 expression (n = 6). Statistical analysis was done by 2-tailed, paired Student’s t test. *P < 0.05, **P < 0.01. (D) Ki-67 expression in naive CD4+ T cells directly ex vivo from 12 young and 10 older adults. Statistical analysis was done by 2-tailed, unpaired Student’s t test. *P < 0.05. (E) Schematics of in vivo studies. Human naive CD4+ T cells from 8 older adults, transfected with siCtrl or siPREX1, were injected into NSG mice. One week after injection, spleens were harvested. (F and G) Frequencies of (F) apoptotic (n = 8) and (G) Ki-67–expressing (n = 8) human CD4+ T cells were determined. Statistical analysis was done by 2-tailed, paired Student’s t test. *P < 0.05. (H) Mouse CD4+ T cells were transfected with either control or mouse Prex1 siRNA and assayed for PREX1 expression. (I) Schematics of in vivo studies. CD45.1+CD4+ T cells transfected with siCtrl or siPREX1 were stained with CFSE or CTV and injected into irradiated B6 CD45.2 mice. One week after injection, spleens were harvested. (JL) Frequencies of (J) divided cells (n = 7), (K) Ki-67–expressing CD4+ T cells (n = 7), and (L) CD62L-expressing CD4+ T cells (n = 7). Statistical analysis was done by 2-tailed, paired Student’s t test. **P < 0.01, ***P < 0.001.
Figure 4
Figure 4. PREX1 facilitates effector T cell differentiation.
Naive CD4+ T cells were activated with anti-CD3/anti-CD28 antibody–coated polystyrene beads. (A) RAC1-GTP was measured at indicated times of activation. (B) RAC1-GTP was measured at 5 minutes of activation in control- or PREX1 siRNA–transfected cells from 4 older adults. Statistical analysis was done by 1-tailed, paired Student’s t test. *P < 0.05. (C) RAC1-GTP was measured after 5 minutes of activation in naive CD4+ T cells from 7 young and 7 older adults. Statistical analysis was done by 2-tailed, unpaired Student’s t test. **P < 0.01. (D) Naive CD4+ T cells from 6 older adults were activated for 5 days after control or PREX1 silencing. BLIMP1 and TCF1 expression was measured by flow cytometry. Statistical analysis was done by 2-tailed, paired Student’s t test. **P < 0.01. (E) Schematics of in vivo studies. OT-II naive CD4+ T cells transduced with shCtrl or shPREX1 were injected into B6 mice. Eight days after injection, spleens were harvested and CD4+ T cells were enriched and stained for indicated markers. (F) Frequencies of GFP+CD4+ T cells transduced with shCtrl (red) or shPREX1 (blue) expressing indicated markers (bottom). Five mice per group. (G) Ratio of CD44+CD62L effector memory (EM) to CD44+CD62L+ central memory (CM) T cells. Five mice per group. Statistical analysis of F and G was done by 2-tailed, unpaired Student’s t test. **P < 0.01.

Similar articles

References

    1. López-Otín C, et al. The hallmarks of aging. Cell. 2013;153(6):1194–1217. doi: 10.1016/j.cell.2013.05.039. - DOI - PMC - PubMed
    1. Goronzy JJ, Weyand CM. Mechanisms underlying T cell ageing. Nat Rev Immunol. 2019;19(9):573–583. doi: 10.1038/s41577-019-0180-1. - DOI - PMC - PubMed
    1. Mittelbrunn M, Kroemer G. Hallmarks of T cell aging. Nat Immunol. 2021;22(6):687–698. doi: 10.1038/s41590-021-00927-z. - DOI - PubMed
    1. Zhang H, et al. Hallmarks of the aging T-cell system. FEBS J. 2021;288(24):7123–7142. doi: 10.1111/febs.15770. - DOI - PMC - PubMed
    1. Sturmlechner I, et al. T cell fate decisions during memory cell generation with aging. Semin Immunol. 2023;69:101800. doi: 10.1016/j.smim.2023.101800. - DOI - PMC - PubMed