. 2024 Feb 5;19(1):14.
doi: 10.1186/s13024-023-00691-8.

Microglial ferroptotic stress causes non-cell autonomous neuronal death

Affiliations

Microglial ferroptotic stress causes non-cell autonomous neuronal death

Jeffrey R Liddell et al. Mol Neurodegener. .

Abstract

Background: Ferroptosis is a form of regulated cell death characterised by lipid peroxidation as the terminal endpoint and a requirement for iron. Although it protects against cancer and infection, ferroptosis is also implicated in causing neuronal death in degenerative diseases of the central nervous system (CNS). The precise role for ferroptosis in causing neuronal death is yet to be fully resolved.

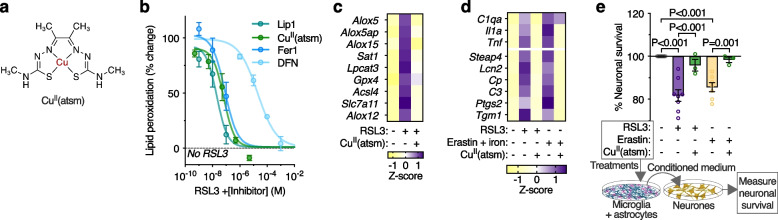
Methods: To elucidate the role of ferroptosis in neuronal death we utilised co-culture and conditioned medium transfer experiments involving microglia, astrocytes and neurones. We ratified clinical significance of our cell culture findings via assessment of human CNS tissue from cases of the fatal, paralysing neurodegenerative condition of amyotrophic lateral sclerosis (ALS). We utilised the SOD1G37R mouse model of ALS and a CNS-permeant ferroptosis inhibitor to verify pharmacological significance in vivo.

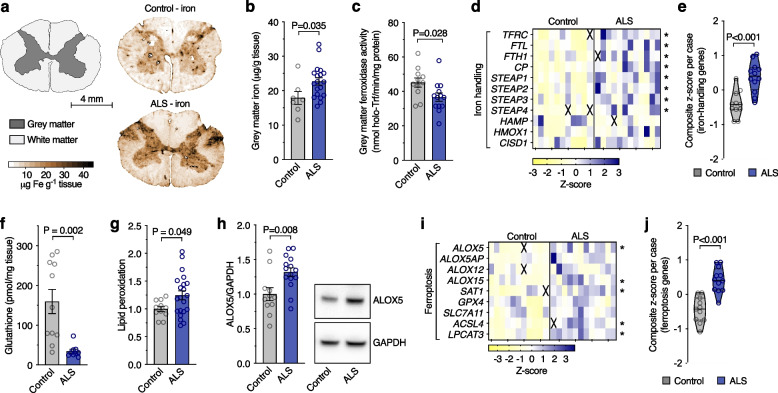
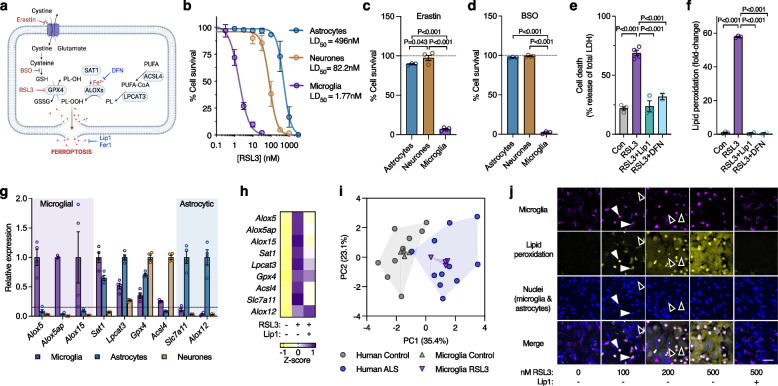
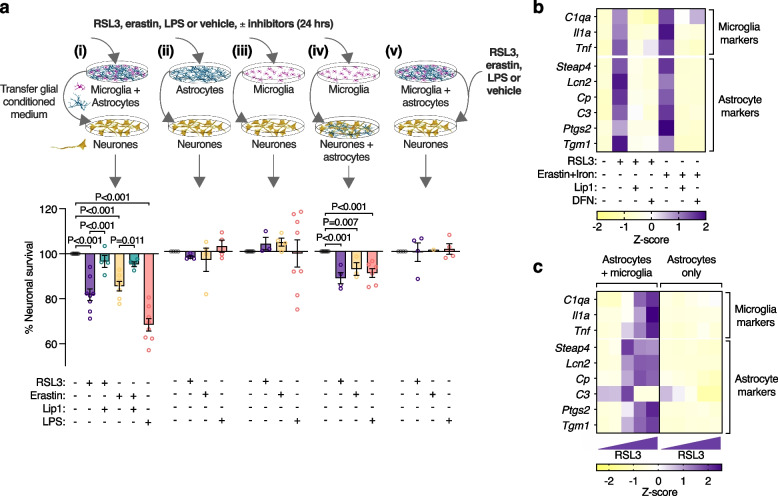
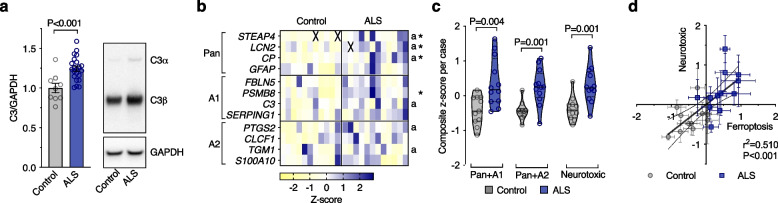
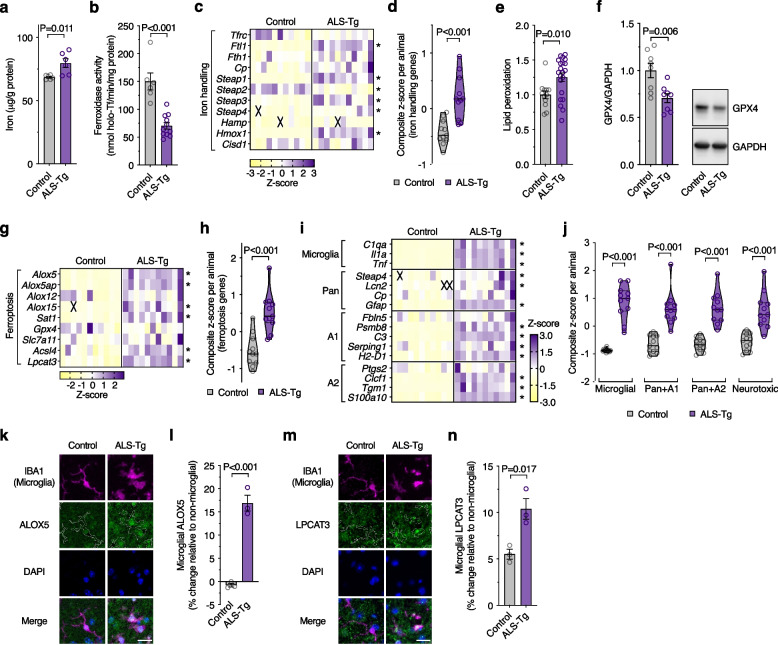
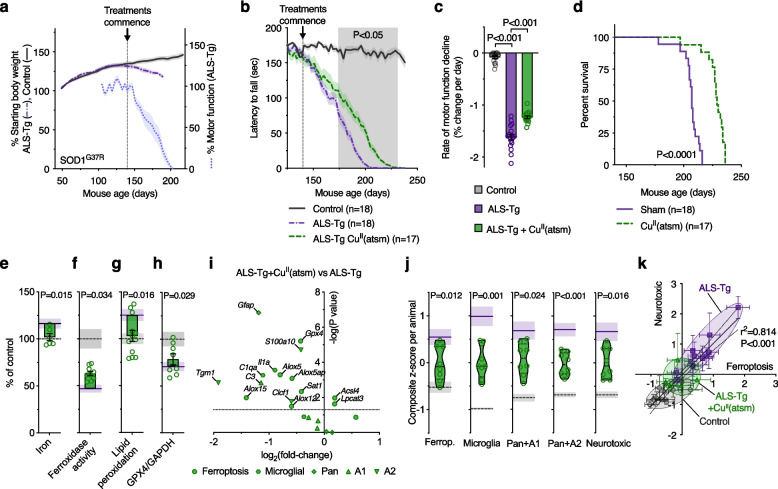
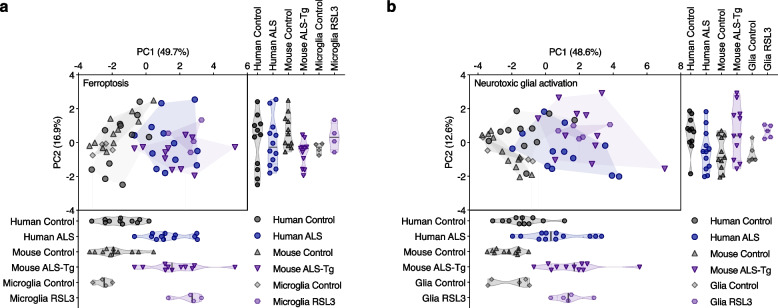
Results: We found that sublethal ferroptotic stress selectively affecting microglia triggers an inflammatory cascade that results in non-cell autonomous neuronal death. Central to this cascade is the conversion of astrocytes to a neurotoxic state. We show that spinal cord tissue from human cases of ALS exhibits a signature of ferroptosis that encompasses atomic, molecular and biochemical features. Further, we show the molecular correlation between ferroptosis and neurotoxic astrocytes evident in human ALS-affected spinal cord is recapitulated in the SOD1G37R mouse model where treatment with a CNS-permeant ferroptosis inhibitor, CuII(atsm), ameliorated these markers and was neuroprotective.

Conclusions: By showing that microglia responding to sublethal ferroptotic stress culminates in non-cell autonomous neuronal death, our results implicate microglial ferroptotic stress as a rectifiable cause of neuronal death in neurodegenerative disease. As ferroptosis is currently primarily regarded as an intrinsic cell death phenomenon, these results introduce an entirely new pathophysiological role for ferroptosis in disease.

Keywords: Amyotrophic lateral sclerosis (ALS); Drug discovery; Ferroptosis; Glia; Glial activation; Iron; Microglia; Neurodegeneration; Neurotoxic astrocytes; Therapy.


Conflict of interest statement

Collaborative Medicinal Development LLC has licensed intellectual property related to this subject from the University of Melbourne where the inventors include ARW and PSD. AIB is a shareholder in Alterity Ltd, Cogstate Ltd, Brighton Biotech LLC, Grunbiotics Pty Ltd, Eucalyptus Pty Ltd, and Mesoblast Ltd. He is a paid consultant for Collaborative Medicinal Development LLC and has a profit share interest in Collaborative Medicinal Development Pty Ltd. PJC and JSB are unpaid consultants for Collaborative Medicinal Development LLC.

Figures

Fig. 1
Fig. 1
Markers of ferroptosis in human, ALS-affected spinal cord. a, b Quantitative in situ mapping of iron in transverse sections of human spinal cord reveals an overall increase in iron in the ALS-affected grey matter. c Ferroxidase activity in human, ALS-affected spinal cord. d, e Transcripts associated with iron handling in human, ALS-affected spinal cord tissue. f-h Biochemical markers of ferroptosis (glutathione, lipid peroxidation, and ALOX5 protein levels) in human, ALS-affected spinal cord. i, j Transcripts associated with ferroptosis in human, ALS-affected spinal cord tissue. Data in g and h are expressed relative to controls. Data points (b, c, e-h, j) represent individual control or ALS cases. Values in transcript heatmaps (d, i) represent z-scores for individual control and ALS cases. Violin plots in e, j represent overall transcript signature for features indicated, derived from heatmap data shown in d, i, respectively. Crosses in heatmaps represent excluded samples. P values show significant differences where indicated. Error margins in bar graphs are S.E.M. Solid lines in violin plots represent median, dotted lines represent 25th/75th percentiles, truncated at min-max values
Fig. 2
Fig. 2
Microglia have heightened sensitivity to ferroptosis. a Ferroptosis is canonically induced by erastin and RSL3, which inhibit the glutamate-cystine antiporter and GPX4, respectively. Ferroptosis is canonically inhibited by lipid radical scavengers liproxstatin-1 (Lip1) and ferrostatin-1 (Fer1). Ferroptosis is also exacerbated by inhibition of glutathione (GSH) synthesis by buthionine sulphoximine (BSO) or by iron (Fe2+), and can be non-specifically inhibited by iron chelators such as deferiprone (DFN). b-d Survival (MTT reduction) of cultured microglia, astrocytes and neurones exposed to the ferroptosis inducers RSL3, erastin or BSO (n = 3–12 for b). e, f Cytotoxicity (LDH release) and lipid peroxidation in cultured microglia exposed to RSL3 (2 µM) and protection by the inhibitors liproxstatin-1 (Lip1) and deferiprone (DFN). Lipid peroxidation in f measured using oxidised:reduced of the ratiometric fluorophore C11-BODIPY. g Transcripts associated with ferroptosis in isolated primary murine cultures of microglia, astrocytes and neurones, depicted relative to highest expression. h Effect of RSL3 (25 nM; 8 h) on transcripts associated with ferroptosis in cultured microglia, and protection by Lip1 (n = 2–4). i Principal component analysis of ferroptosis genes in response to RSL3 treatment in cultured microglia or ALS in human spinal cord. j Lipid peroxidation in response to RSL3 and protection with Lip1 in mixed glial cultures (microglia and astrocytes) detected using oxidised:reduced C11-BODIPY (yellow) showing lipid peroxidation is restricted to microglia (magenta, detected with Dylight 649-labelled isolectin, indicated with white arrowheads) relative to the preponderant astrocytes (black arrowheads). Images derived from Supplementary Video 1. Scale bar (j) = 50 µm. P values in c-f indicate significant differences. Error margins in b-g are S.E.M. Data points in c-g represent independent cultures. Individual heatmap values in h represent mean. Symbols in i represent individual control or ALS cases, or independent microglial cultures. Proportion of variance explained by each principal component in i is denoted on axes. Data in i derived from fold expression change shown in Supplementary Figs. 3b and 5b
Fig. 3
Fig. 3
Ferroptotic stress induces neurotoxic glial activation. a Conditioned medium from mixed glial cultures (i) treated with RSL3, erastin or LPS is toxic to cultured neurones (MTT reduction). Toxicity is alleviated by liproxstatin-1 (Lip1). Conditioned medium from identically treated isolated astrocyte (ii) or microglia (iii) cultures is not neurotoxic, whereas conditioned medium from isolated microglia is neurotoxic to neurones cultured with astrocytes (iv). Adding RSL3, erastin or LPS directly onto neurones is not toxic (v). Isolated microglia cultures treated with 1 nM RSL3. All other cultures treated with 100 nM RSL3. Error margins are S.E.M. P values indicate significant differences. Procedure for exposing neurones to glial conditioned medium is depicted in Supplementary Fig. 6a. Glial conditioned medium is concentrated using 30 kDa MWCO filters. Data points in a represent independent cultures. b Effect of RSL3 (200 nM) or erastin plus iron (as ferric ammonium citrate)-induced ferroptotic stress on expression of genes associated with activation of microglia and astrocytes in mixed glial cultures, and protection by Lip1 or deferiprone (DFN). c RSL3 (100–400 nM) induced expression of glial activation genes in mixed glial cultures (astrocytes & microglia) but not astrocytes alone. Individual heatmap values (b, c) represent mean (n = 3–6)
Fig. 4
Fig. 4
Markers of glial activation and ferroptosis are correlated in human, ALS affected spinal cord. a Protein levels of neurotoxic astrocyte marker C3 expressed relative to controls. b, c Transcripts associated with glial activation, highlighting selected markers designated for pan, A1 and A2 activation. Genes associated with neurotoxicity in vitro (shown in Supplementary Fig. 7) are indicated by ‘a’. Violin plots in c represent overall transcript signature for features indicated, derived from heatmap data shown in b, including genes associated with neurotoxicity in vitro (Neurotoxic). d Correlation between overall transcript signatures for ferroptosis and glial activation associated with neurotoxicity. Symbols represent composite z-scores for ferroptosis (from Fig. 1j) and glial activation associated with neurotoxicity (from c) for corresponding individual cases. P values show significant differences where indicated (a, c) or significance of correlation (d). Data points in a, c, d represent individual control or ALS cases. Values in transcript heatmap (c) represent z-scores for individual control and ALS cases. Crosses represent excluded samples. Error margins are S.E.M. per mean (a) or per case (d), or 95% confidence interval of linear regression (dashed lines) in d. Solid lines in violin plots represent median, dotted lines represent 25th/75th percentiles, truncated at min-max values
Fig. 5
Fig. 5
ALS model mice recapitulate features of ferroptosis and neurotoxic glia evident in human ALS-affected spinal cord. a-d Markers associated with iron are perturbed in spinal cord of transgenic SOD1G37R ALS model mice (ALS-Tg) compared to non-transgenic littermates (Control), including elevated iron, diminished ferroxidase activity and altered expression of iron handling genes. e-h Spinal cord tissue from transgenic SOD1G37R ALS model mice display features of ferroptosis, including elevated lipid peroxidation, diminished GPX4 protein level, and altered transcripts for ferroptosis related genes. i, j Relative expression changes for genes associated with neurotoxic glial activation in spinal cord of SOD1G37R and control mice. Violin plots in j represent overall transcript signature for features indicated, derived from heatmap data shown in i, including genes associated with neurotoxicity in vitro (Neurotoxic; shown in Supplementary Fig. 7). k Representative immunofluorescence for microglial marker IBA1 (magenta), ferroptosis-related protein ALOX5 (green) and nuclear marker DAPI (blue) in spinal cord ventral horn of SOD1G37R and control mice. l Microglial ALOX5 quantitated from k. m Representative immunofluorescence for IBA1 (magenta), ferroptosis-related protein LPCAT3 (green) and DAPI (blue) in spinal cord ventral horn of SOD1G37R and control mice. n Microglial LPCAT3 quantitated from m. Data in e and f are expressed relative to controls. P values show significant differences where indicated. Data points (a, b, d-f, h, j, l, n) represent individual SOD1G37R or control animals. Error margins in a, b, e, f, l, n are S.E.M. Values in transcript heatmaps (c, g, i) represent z-scores for individual SOD1G37R or control animals, and crosses represent excluded samples. Violin plots in d, h, j represent overall transcript signature derived from heatmap data shown in c, g, i, respectively, where solid lines represent median, dotted lines represent 25th/75th percentiles, truncated at min-max values. Outline of IBA1-positive microglia are overlaid with ALOX5 and LPCAT3 in k and m, respectively. Scale bar (k, m) = 20 µm
Fig. 6
Fig. 6
The metallocomplex CuII(atsm) protects against glial ferroptosis and neurotoxic glial activation in vitro. a Chemical structure of CuII(atsm). b CuII(atsm) prevents RSL3-induced (2 µM) lipid peroxidation in mixed primary cultures of murine microglia and astrocytes, with efficacy similar to the ferroptosis inhibitors liproxstatin-1 (Lip1) and ferrostatin-1 (Fer1). Lipid peroxidation measured as oxidised:reduced C11-BODIPY (n = 2–4). c CuII(atsm) mitigates RSL3-induced (25 nM; 8 h) expression of genes associated with ferroptosis in microglial cultures (n = 3–4). d CuII(atsm) mitigates ferroptotic stress-induced expression of genes associated with activation of microglia and astrocytes in mixed glial cultures (n = 3–6; RSL3 200 nM; iron as ferric ammonium citrate). e CuII(atsm) inhibits RSL3- (100 nM) and erastin-induced generation of neurotoxic glial conditioned medium, resulting in neuroprotection (MTT reduction). Data points in e represent independent cultures. P values (e) indicate significant differences where indicated. Error margins in b, e are S.E.M. Symbols (b) or individual heatmap values (c, d) represent mean
Fig. 7
Fig. 7
Treatment with CuII(atsm) is protective and mitigates markers of ferroptosis and glial activation in ALS model mice. a Stage of phenotype progression in transgenic SOD1G37R ALS model mice (ALS-Tg) at which treatment with CuII(atsm) commenced for the present study. Percentage starting body weight for SOD1G37R mice is expressed relative to body weight per animal at 50 days old. Percentage motor function (rotarod assay) is expressed relative to average performance per animal over the period 125–139 days (n = 14–21 animals). b Effect of CuII(atsm) at 30 mg/kg body weight twice daily on motor function of SOD1G37R mice. c Rate of motor function decline in SOD1G37R mice derived from data in b. d CuII(atsm), administered orally commencing at the post symptom-onset age of 140 days, extends survival of the SOD1G37R mouse model of ALS. e-h Therapeutic outcomes for CuII(atsm) in the SOD1G37R mice are associated with improved biochemical markers of ferroptosis, including decreased iron levels, increased ferroxidase activity, decreased lipid peroxidation and increased GPX4 protein in extracted spinal cord tissue. Lipid peroxidation in g measured as oxidised:reduced C11-BODIPY. i Volcano plot of transcript analyses for genes associated with ferroptosis and neurotoxic glial activation in SOD1G37R mouse spinal cord tissue treated with CuII(atsm) compared to SOD1G37R mice without CuII(atsm) treatment. j Overall transcript signature for ferroptosis and neurotoxic glial genes are mitigated by CuII(atsm) treatment, including genes associated with neurotoxicity in vitro (Neurotoxic), derived from i and Fig. 5g-j. k Correlation between overall transcript signatures for ferroptosis and neurotoxic glia (from j and Fig. 5h, j). Symbols represent individual animals. In e-h, j, data points represent individual SOD1G37R mice treated with CuII(atsm); purple solid lines and grey dashed lines and represent mean of SOD1G37R without CuII(atsm) treatment and control non-transgenic littermates, respectively. Error margins are S.E.M. in line plots (a, b), bar graphs (c, e-h), violin plots (j) and overall transcript signatures of individual animals (k), or 95% confidence interval of linear regression (dashed lines) in correlation plot (k). Solid lines in violin plots (j) represent median, dotted lines represent 25th/75th percentiles, truncated at min-max values. P values indicate significant differences between groups (c, d), significance of correlation (k), or significant difference between SOD1G37R mice treated with or without CuII(atsm) (shaded area, b; e-h, j)
Fig. 8
Fig. 8
Principal component analysis of gene expression changes in human ALS-affected spinal cord compared to SOD1G37R mice and cultured glia. Principal component analysis of genes associated with (a) ferroptosis and (b) neurotoxic glial activation in human ALS-affected spinal cord, SOD1G37R mice, and glial cultures treated with the ferroptosis inducer RSL3. Individual values for PC1 and PC2 are projected below and to the right of the PCA plots, respectively. Symbols represent individual control and ALS cases, individual animals or independent glial cultures. Proportion of variance explained by each principal component is denoted on axes. Data are derived from z-scores of expression changes shown in Supplementary Figs. 3b, c, 7a, 9c, d and 12a

Similar articles

Cited by

References

    1. Khakh BS, Deneen B. The emerging nature of astrocyte diversity. Annu Rev Neurosci. 2019;42:187–207. - PubMed
    1. Vainchtein ID, Molofsky AV. Astrocytes and microglia: in sickness and in health. Trends Neurosci. 2020;43(3):144–54. - PMC - PubMed
    1. Salter MW, Stevens B. Microglia emerge as central players in brain disease. Nat Med. 2017;23(9):1018–1027. - PubMed
    1. Phatnani H, Maniatis T. Astrocytes in neurodegenerative disease. Cold Spring Harb Perspect Biol. 2015;7(6):a020628. - PMC - PubMed
    1. Kiernan MC, Vucic S, Cheah BC, Turner MR, Eisen A, Hardiman O, et al. Amyotrophic lateral sclerosis. Lancet. 2011;377(9769):942–955. - PubMed

Substances