. 2024 Jul;31(7):1114-1123.
doi: 10.1038/s41594-023-01201-6. Epub 2024 Feb 5.

Multi-modal cryo-EM reveals trimers of protein A10 to form the palisade layer in poxvirus cores

Affiliations

Multi-modal cryo-EM reveals trimers of protein A10 to form the palisade layer in poxvirus cores

Julia Datler et al. Nat Struct Mol Biol. 2024 Jul.

Abstract

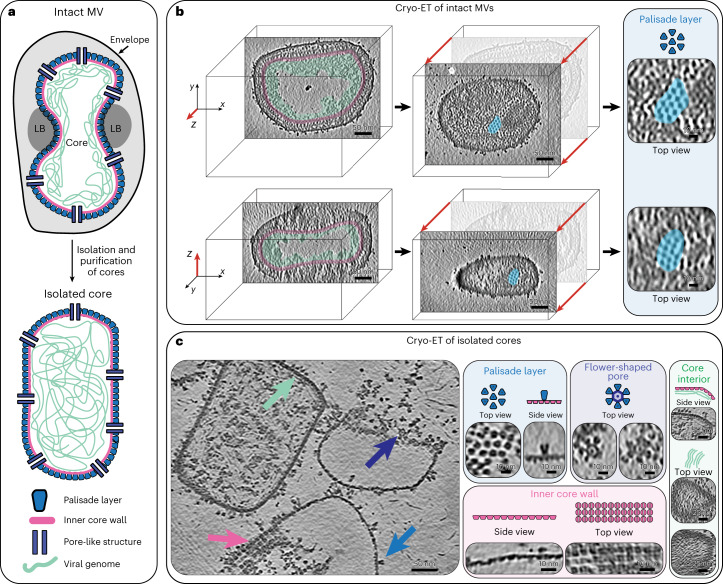
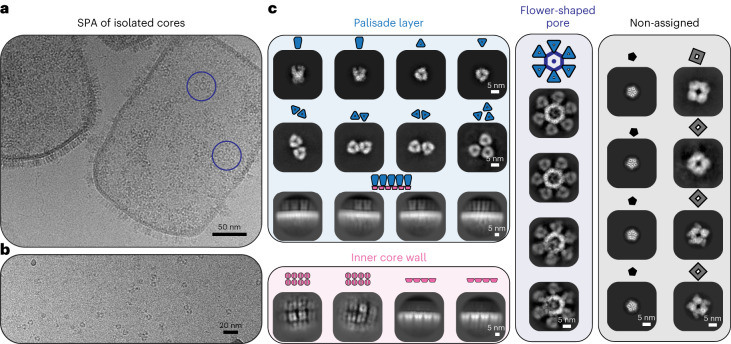
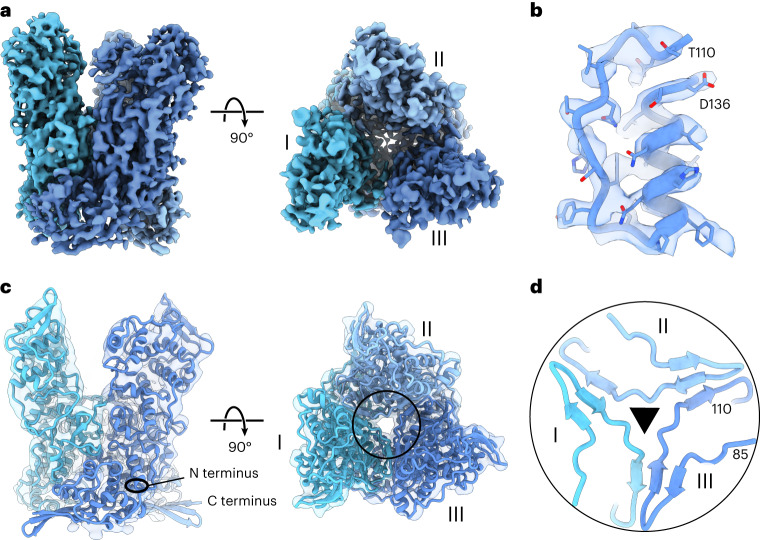
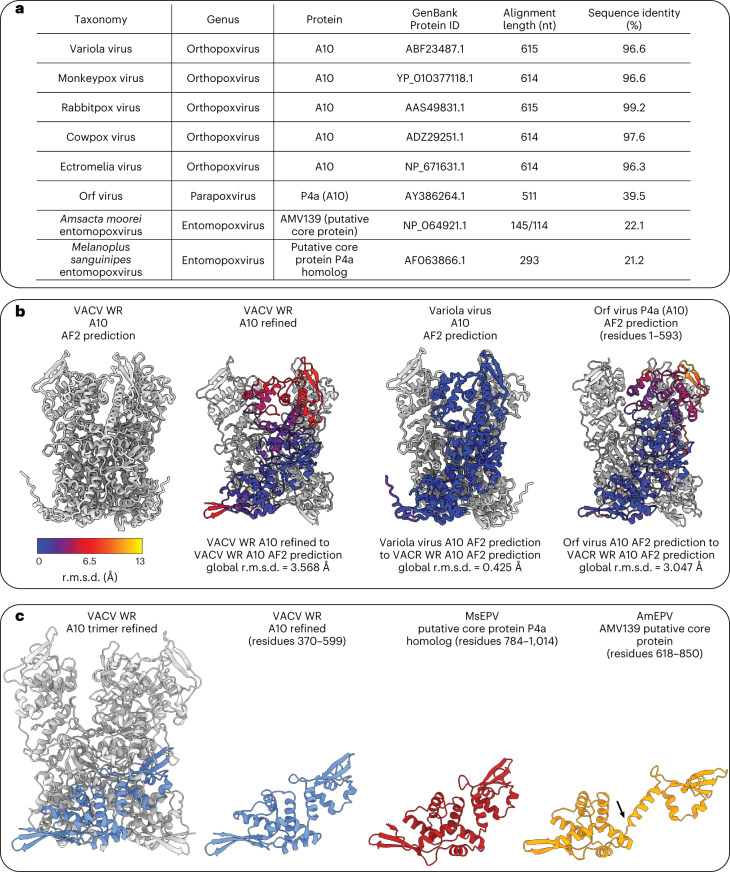
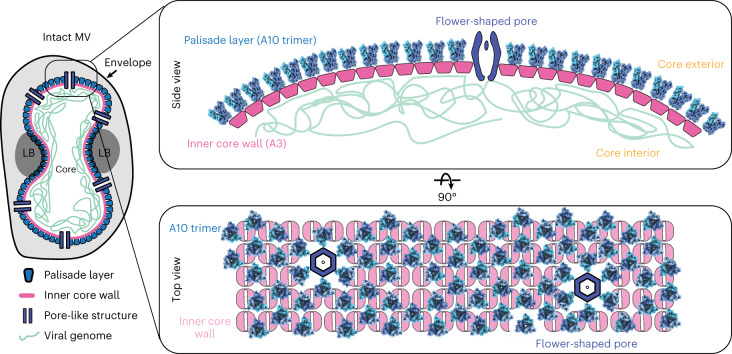
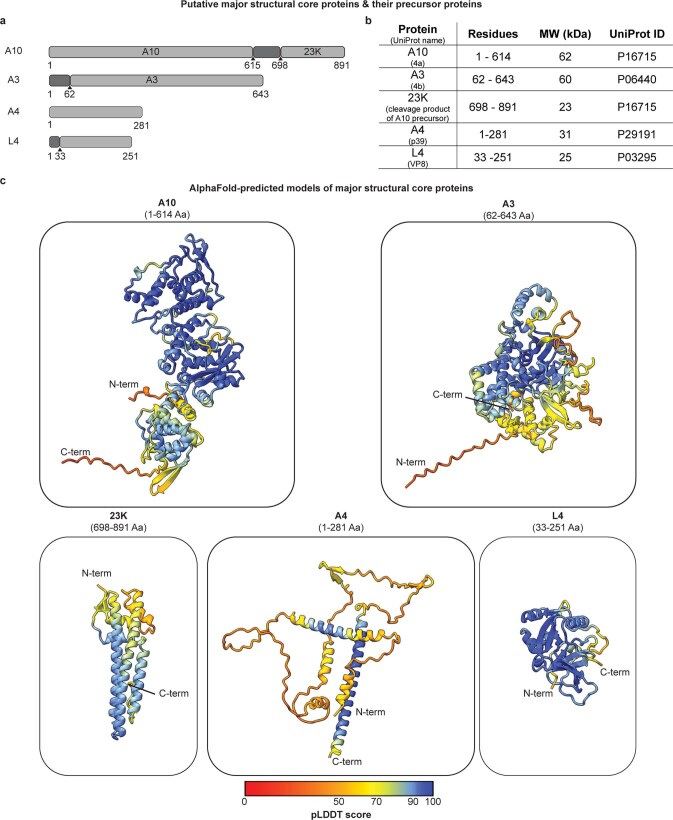
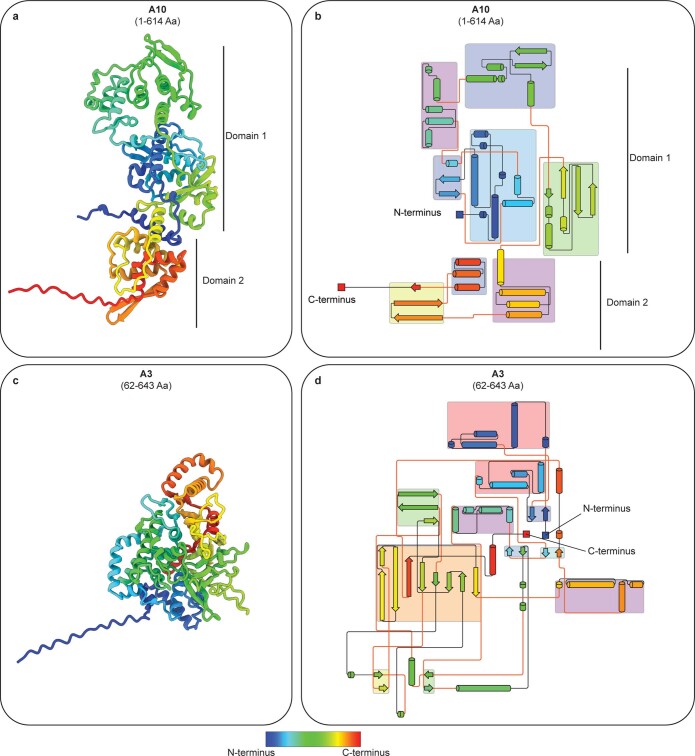
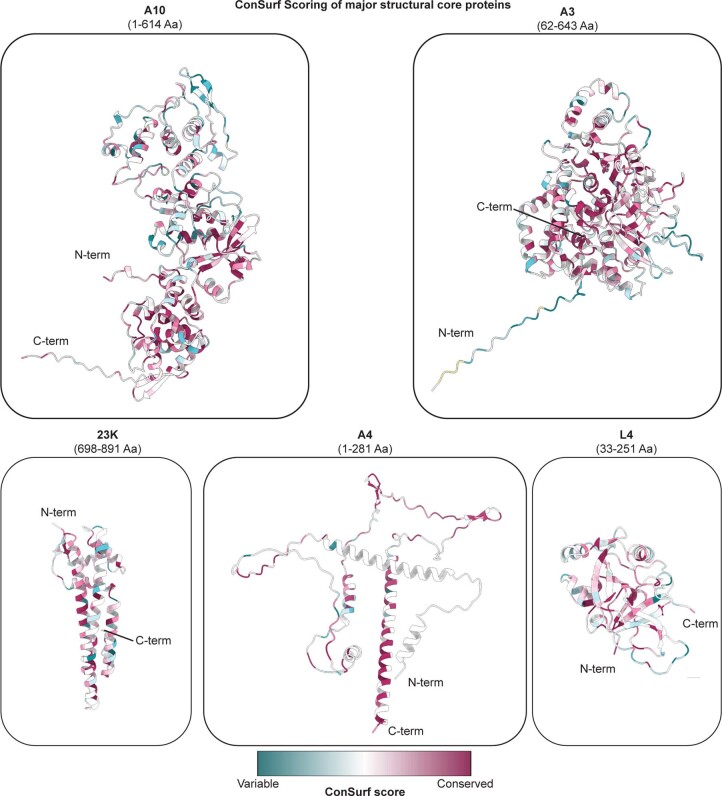
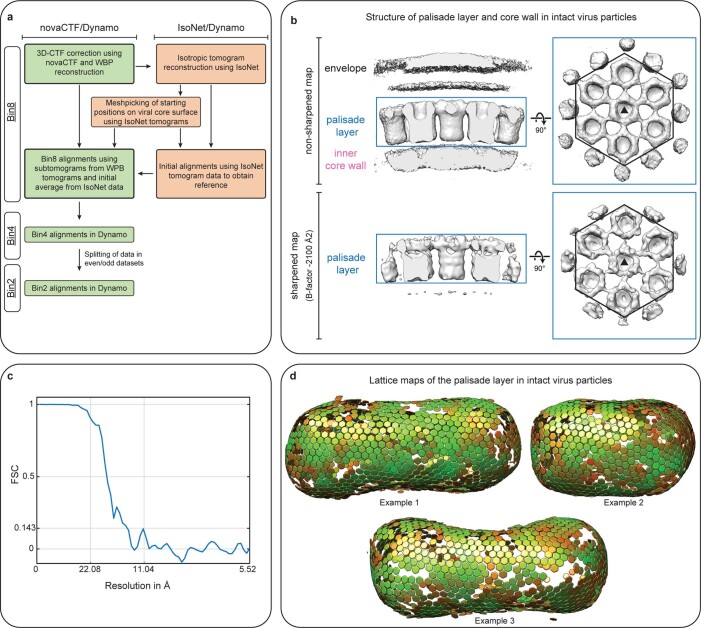
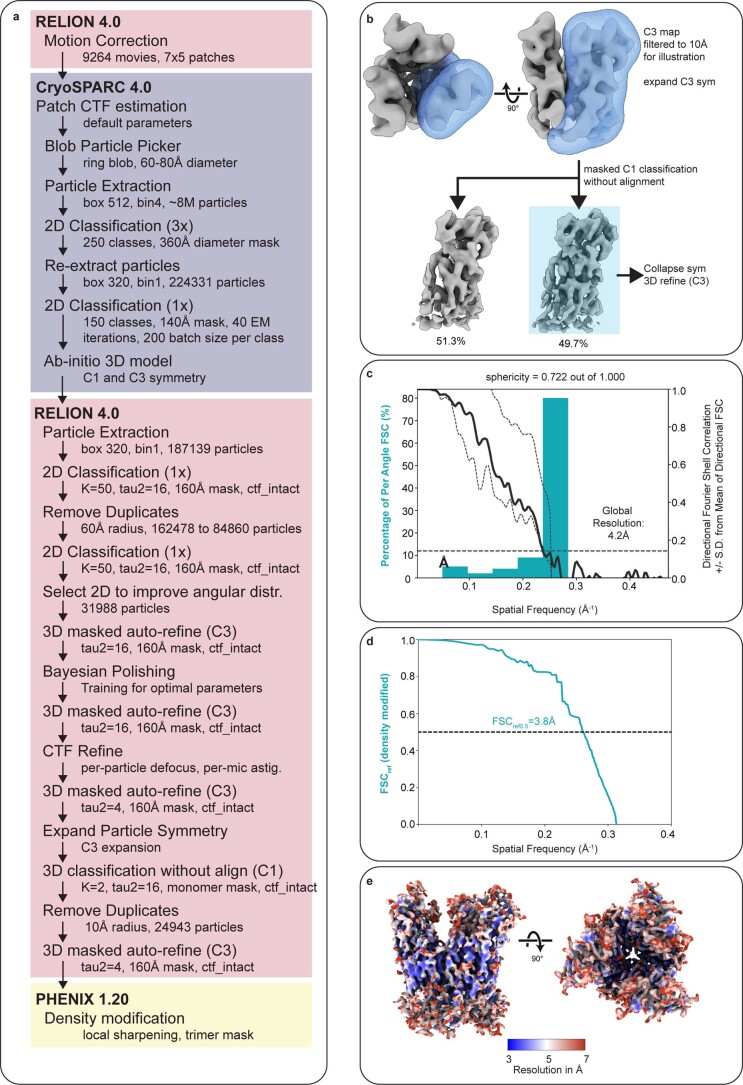
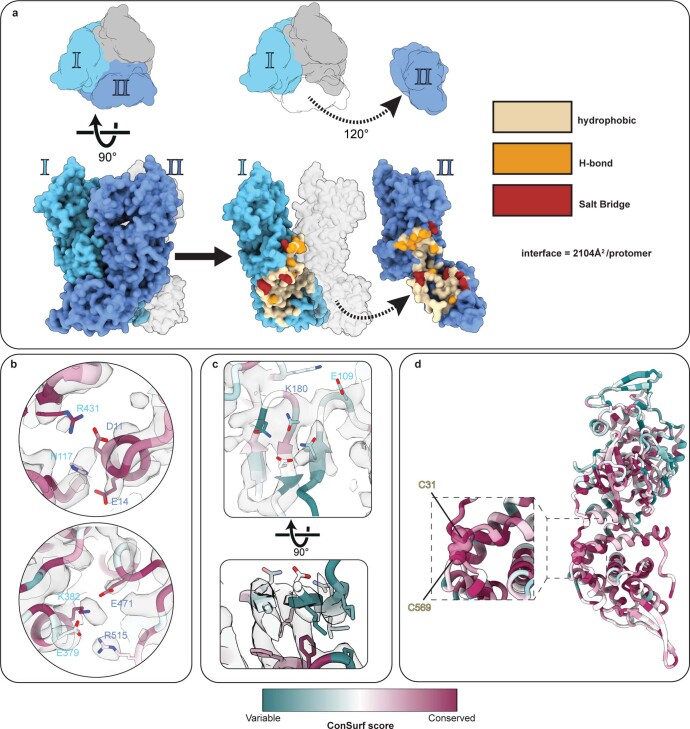
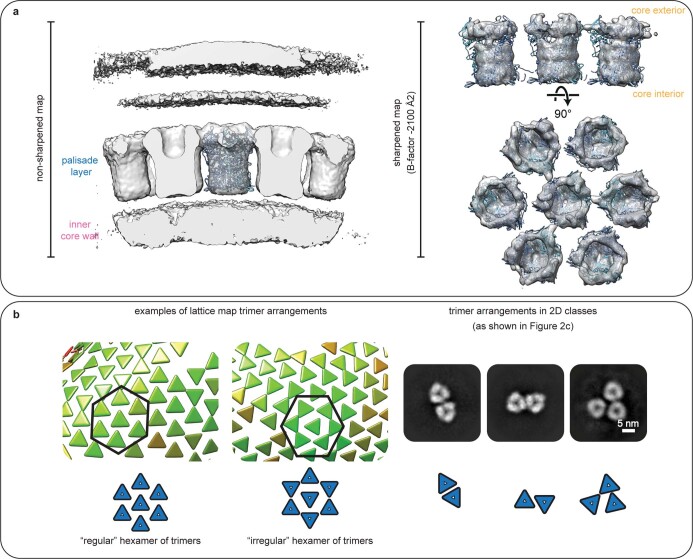
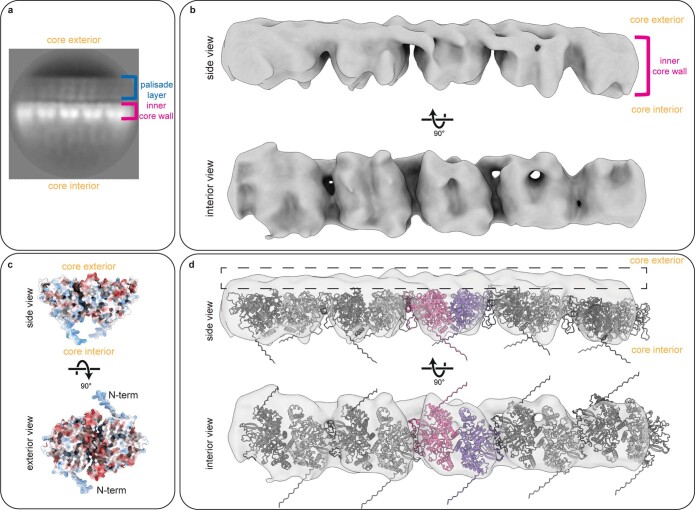
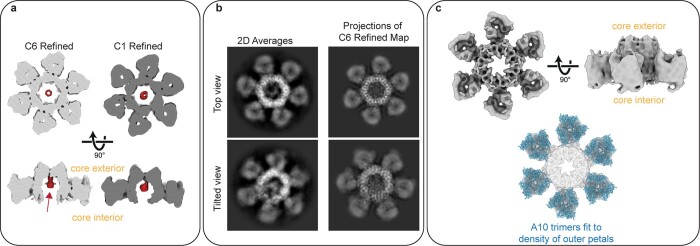
Poxviruses are among the largest double-stranded DNA viruses, with members such as variola virus, monkeypox virus and the vaccination strain vaccinia virus (VACV). Knowledge about the structural proteins that form the viral core has remained sparse. While major core proteins have been annotated via indirect experimental evidence, their structures have remained elusive and they could not be assigned to individual core features. Hence, which proteins constitute which layers of the core, such as the palisade layer and the inner core wall, has remained enigmatic. Here we show, using a multi-modal cryo-electron microscopy (cryo-EM) approach in combination with AlphaFold molecular modeling, that trimers formed by the cleavage product of VACV protein A10 are the key component of the palisade layer. This allows us to place previously obtained descriptions of protein interactions within the core wall into perspective and to provide a detailed model of poxvirus core architecture. Importantly, we show that interactions within A10 trimers are likely generalizable over members of orthopox- and parapoxviruses.


Conflict of interest statement

The authors have no competing interests.

Figures

Fig. 1
Fig. 1. Cryo-ET of VACV mature virions and isolated cores.
a, Schematic of intact MV (top) and an isolated MV core (bottom), showing previously described structural entities, such as the palisade layer, inner core wall, pore-like structure and viral genome. Lateral bodies (LB) bind to the concave-shaped core in intact viruses, but are often lost during core isolation. This color coding for the palisade layer (blue), the inner core wall (pink), the pore-like structure (purple) and the genome (green) is kept consistent throughout subsequent figures. b, Computational slices (1.1 nm thickness) through a missing wedge-corrected tomogram (using IsoNet) of an intact MV particle (this slice is representative of 15 tomograms), clearly showing core morphology and structural features such as the hexameric arrangement of the palisade layer (highlighted in blue), the inner core wall (pink) and the condensed genome (green). The virus is shown from two viewing directions, looking at the xy and xz planes (see axes on left) on top and bottom, respectively. The center panel shows the palisade layer in grazing slices, with a magnified view of this region shown on the right. c, Computational slice (1.1 nm thickness) through an IsoNet-corrected tomogram of isolated MV cores (left) (this slice is representative of four tomograms). Structural features are clearly observable in tomograms of isolated cores (annotated with arrows, same color scheme as a) and are shown on the right.
Fig. 2
Fig. 2. The structural treasure chest of isolated VACV cores.
a,b, Representative micrographs (of 9,264 in total) for the SPA acquisition, showing isolated cores (a) and soluble core proteins (b), such as trimers. The micrographs shown are from the same data acquisition. The flower-shaped pore, also observed in cryo-ET of isolated cores (Fig. 1c), is enclosed in purple circles. c, Gallery of 2D classes obtained from processing cryo-SPA datasets showing different multimeric assemblies observed as part of the core or as soluble components. Comparison of these 2D classes with our cryo-ET data allows a clear contextualization of their origin with respect to the palisade layer, the inner core wall or the flower-shaped pore. Classes for which no features could be observed in our cryo-ET data are labeled as non-assigned. The assembly and symmetry state of the classes is also annotated with small schematic depictions.
Fig. 3
Fig. 3. Single-particle cryo-EM structure of the A10 trimer.
a, C3-symmetric density-modified cryo-EM reconstruction of the A10 trimer at 3.8 Å resolution. Each subunit of the trimer (I to III) is depicted in a different shade of blue. b, The core region in the A10 trimer cryo-EM map is highlighted, where side chain density permits verification of the primary protein sequence. c, Refined model fit into cryo-EM density for the A10 trimer. The circle shows the zoomed-in region of interest in d. The transparent EM density has been low-pass filtered to 10 Å resolution to facilitate interpretation. The N terminus and C terminus of one of the A10 monomers are annotated. d, Central trimer contacts from c, showing residues 85–110, which engage in hetero-oligomer beta-sheet interactions with neighboring monomers. The residue numbers of the N terminus and C terminus of the displayed protein region are annotated.
Fig. 4
Fig. 4. Comparison of vaccinia virus Western Reserve A10 trimers to other members of the poxvirus family.
a, Sequence identity of A10 protein of different viruses of the poxvirus family, compared with VACV WR. b, Comparison of the initial VACV WR A10 AlphaFold (AF2) prediction with the refined VACV WR A10 structure (also shown in Figure 3), and AF2 predictions of variola virus A10 and the parapoxvirus orf virus P4a (A10) residues 1–593. This comparison shows the strong similarity between the protein folds between these virus species. It further shows that the biggest difference between the predicted and refined VACV WR A10 model is at the top of the trimer, facing the outside of the core. The color code displays root mean square deviation (r.m.s.d.) variations, with lower values indicating that the structure is more similar. c, Comparison of the refined VACV A10 model with parts of the predicted putative core protein models of MsEPV and AmEPV. Analysis reveals that, despite an overall more different fold, MsEPV residues 784–1014 and AmEPV residues 618–850 adopt a highly similar fold compared with VACV A10 residues 370–599. In the AmEPV AF2 prediction, a slightly different angle in a connecting loop between two halves of the fold (annotated with an arrow) leads to a different orientation.
Fig. 5
Fig. 5. Structural model of the VACV core wall.
Schematic summary of the updated model of the palisade layer and inner core wall. Protein A10 forms the palisade layer, which is positioned above an inner core wall with strikingly different symmetry. A4 is most likely decorating the outside of the palisade layer. The inner core wall is presumably formed by A3, with a potential role of L4 as a DNA-binding protein, tethering the viral genome to the core wall. The core is pierced by flower-shaped pores, which appear unevenly distributed on the surface of the core.
Extended Data Fig. 1
Extended Data Fig. 1. Major structural proteins annotated to be in the VACV core wall.
a) Schematic representation of VACV WR proteins reported to constitute the core wall and palisade layer. Cleavage sites within precursor proteins are annotated by arrows and the resulting cleavage proteins are listed within the schematic representation. b) List of the structural core proteins discussed in this manuscript (in their cleaved form when applicable), with information on their residue length, molecular weight (kiloDalton) and UniProtID. c) AlphaFold-predicted models of A10, A3, 23K, A4 and L4. The modeled residues are indicated in brackets. The coloring of the model reflects the pLDDT confidence score (red = low confidence, blue = high confidence). The N- and C-termini of the proteins are annotated.
Extended Data Fig. 2
Extended Data Fig. 2. Protein topology of A10 and A3.
Illustration of protein topology and arrangement for A10 (panel a-b) and A3 (panel c-d). The coloring of the models and topology diagrams is according to residue positioning from the N-terminus (blue) to the C-terminus (red). a) Cartoon ribbon representation of the Alphafold-predicted model of A10, colored from N-terminus to C-terminus. The two sub-domains (SD1 and SD2) of the A10 fold are annotated. b) Protein topology diagram of A10, showing the positioning of protein regions, such as specific secondary structures with respect to each other. Beta-strands and alpha-helices are shown as arrows and cylinders, respectively. Their length is proportional to their number of residues. Colored boxes represent motifs which are positioned nearby relative to one another and therefore are likely to form a structural group. c) Cartoon ribbon representation of the Alphafold-predicted A3 colored from N-terminus to C-terminus. d) Protein topology diagram of A3, in the same depiction style as in (B). The topology diagrams shown in (b) and (d) were generated using Pro-Origami. The diagram in (b) was manually adapted to further improve visualization of the complex protein architecture. Orange line colors in (b) are used to highlight connections between structural groups. Orange lines in (d) are used to improve visualization but do not necessarily indicate connection between structural groups.
Extended Data Fig. 3
Extended Data Fig. 3. Sequence conservation analysis of structural core proteins.
AlphaFold-predicted models of A10, A3, 23K, A4 and L4, shown in the same orientation as in Extended Data Fig. 1c and colored according to their ConSurf score, highlighting the predicted conservation of individual residues. The modeled residues are indicated in brackets.
Extended Data Fig. 4
Extended Data Fig. 4. Subtomogram averaging of the VACV core wall in intact MV.
a) Subtomogram averaging workflow of the core in intact MV using novaCTF, Isonet and Dynamo. See Materials and Methods for more details. b) Non-sharpened map (top) and sharpened EM-density map (bottom) of the subtomogram average of the palisade layer and inner core wall in intact virus particles. The map is shown in a side view (left) and as seen from outside of the virus (right), where the envelope layer is removed to allow a clear view of the palisade layer. The triangle symbol annotates the central trimer and the hexagon annotates the hexamer of trimers. c) Fourier Shell correlation (FSC) between independent half datasets of the map shown in B. The measured resolution at the 0.143 criterion is 13.1Å. d) Examples of viral core lattices after final subtomogram averaging alignments. The aligned subtomogram positions are shown as hexagons to allow a facilitated interpretation of the results. Please note that each hexagon position actually represents the trimeric center of a hexamer of trimers. The color of the hexagons denotes the cross-correlation coefficient (CCC) of the alignment ranging from red (low CCC) to green (high CCC).
Extended Data Fig. 5
Extended Data Fig. 5. SPA processing workflow of the A10 trimer.
a) Summary of processing steps used in the SPA workflow. b) 3D classification scheme used for the removal of particles containing low-quality asymmetric units within the A10 trimer. The blue mask shown was used for classification, the blue box designates which particles were selected for final refinement. c) 3D FSC calculations of the masked RELION half maps. Cyan histogram depicts the fraction of particles that reach the corresponding resolution, and the black curves show global FSC +/− SD of FSCs calculated with extensive angular sampling. Global resolution indicated is at FSC 0.143 cutoff. d) FSCref calculation for the Phenix density modified map with a cutoff value of 0.5 for estimated resolution. e) Local resolution of the A10 trimer cryo-EM density map.
Extended Data Fig. 6
Extended Data Fig. 6. Inter- and intramolecular interactions of the A10 trimer.
a) Diagrammatic illustration of key inter-chain contacts at the oligomerization interface between two monomers (labeled I and II). The diagram shows monomer II pulling away from the trimer to reveal underlying contacts, shown in yellow (hydrophobic), orange (H-bond), and red (salt bridges). b-d) Details of the inter- and intramolecular interactions. Residues are colored according to their conservation as determined via ConSurf (see also Extended Data Fig. 3). The residue labels are colored according to the color of the chain they are in (as in panel a). b) Salt bridge contacts from panel A with residue numbers indicated. c) Top, a salt bridge and hydrogen bond network at the inter-subunit beta-sheet formed at the core of the trimer. Bottom, hydrophobic packing on the underside of the beta-sheet. Electron microscopy density is shown for all images in (b-c). d) Potentially interacting cysteines (residues indicated). The orientation of the monomer is identical to panel a.
Extended Data Fig. 7
Extended Data Fig. 7. STA results suggest variable trimer interactions within the palisade layer.
a) Rigid body fit of the A10 trimer into the structure obtained by cryo-electron tomography and subtomogram averaging, both into the unsharpened map (left) and the sharpened map (right). In both cases, it is evident that the A10 trimer is occupying the complete density of the palisade layer. b) The variable positioning of the trimers with respect to each other within the palisade layer is shown in lattice maps obtained from STA of cores in intact MV (left) and in 2D classes of trimers released from the core wall of isolated cores (right). The differential orientation of the trimers to each other is always shown schematically. We note that the variable positioning of trimers within the lattice is likely contributing to the limited resolution of our STA average. We also note that the finding of variable trimer interactions in our 2D classes supports that the variable positioning of trimers within the lattice is not due to alignment inaccuracies of STA, but rather indeed suggests the interactions of trimers among each other to be pliable. The color of the triangles denotes the cross-correlation coefficient (CCC) of the alignment ranging from red (low CCC) to green (high CCC). The 2D classes shown here are identical to the ones shown in Fig. 2c.
Extended Data Fig. 8
Extended Data Fig. 8. Cross-linking mass spectrometry sites on the A10 trimer.
a) Previously identified contact sites between A10 and 23K (shown as yellow spheres), A3 (red spheres), A4 (pink spheres), and L4 (blue), as identified via cross-linking mass spectrometry. b) Surface charge representation of the A10 trimer (negative charge = red, positive charge = blue). c) Surface charge representation of AlphaFold models for monomers of L4, A4, A3 and 23K. Coloring as in (b).
Extended Data Fig. 9
Extended Data Fig. 9. An A3 dimer fits to the density of the inner core wall units.
a) Projection of the 3D reconstruction of the inner core wall from panel b. b) Low-resolution cryo-EM reconstruction of the inner core wall as shown from side and interior views. The variability of the individual units indicates no strict long-range order, as also seen in our 2D classes (Fig. 2c) and the top view of the inner core wall in tomograms of isolated cores (Fig. 1c). c) AlphaFold multimer prediction of an A3 dimer (residues 62-643), with its orientation denoted relative to interior and exterior of virus core. Color represents calculated surface charge with color representations the same as in Extended Data Fig. 8. The orientation was assumed using the negative surface charge of A3 on one side and the suggested orientation towards the base of A10 with the corresponding counter charge. d) Pairs of A3 dimers were rigid body fit into the density of the inner core wall units in panel B. The dimensions and shape of the EM-density accommodate an A3 dimer pair. The central dimer is colored in pink and purple, neighbouring A3 pairs are coloured in grey. The black dashed rectangle annotates a small area of unoccupied density.
Extended Data Fig. 10
Extended Data Fig. 10. Single particle cryo-EM structure of the flower-shaped pore.
a) Slices through density for C6 and C1 reconstructed flower-shaped pore which reveals an unidentified, donut-shaped central density highlighted in red (red arrow). b) Left, Single particle cryo-EM 2D class averages of the flower-shaped pore and right, projections of the C6-symmetrized reconstruction. c) C6-symmetric cryo-EM reconstruction of the flower-shaped pore of the palisade layer. Bottom shows the fit of A10 trimers into the outer densities, while the central hexamer density is not modeled due to the uncertainty of its identity.

Similar articles

Cited by

  • Palisade structure in intact vaccinia virions.
    Hernandez-Gonzalez M, Calcraft T, Nans A, Rosenthal PB, Way M. Hernandez-Gonzalez M, et al. mBio. 2024 Feb 14;15(2):e0313423. doi: 10.1128/mbio.03134-23. Epub 2024 Jan 3. mBio. 2024. PMID: 38171004 Free PMC article.
  • Structure of the poxvirus core.
    Coulibaly F. Coulibaly F. Nat Struct Mol Biol. 2024 Jul;31(7):1001-1003. doi: 10.1038/s41594-024-01331-5. Nat Struct Mol Biol. 2024. PMID: 38890551 No abstract available.
  • Molecular architecture of monkeypox mature virus.
    Hong Y, Huang B, Zhang J, Peng C, Kong W, Tan W, Li S. Hong Y, et al. Cell Discov. 2024 Oct 22;10(1):108. doi: 10.1038/s41421-024-00741-5. Cell Discov. 2024. PMID: 39438447 Free PMC article. No abstract available.

References

    1. Condit RC, Moussatche N, Traktman P. In a nutshell: structure and assembly of the vaccinia virion. Adv. Virus Res. 2006;66:31–124. doi: 10.1016/S0065-3527(06)66002-8. - DOI - PubMed
    1. Strassburg MA. The global eradication of smallpox. Am. J. Infect. Control. 1982;10:53–59. doi: 10.1016/0196-6553(82)90003-7. - DOI - PubMed
    1. Roberts KL, Smith GL. Vaccinia virus morphogenesis and dissemination. Trends Microbiol. 2008;16:472–479. doi: 10.1016/j.tim.2008.07.009. - DOI - PubMed
    1. Bidgood SR, Mercer J. Cloak and dagger: alternative immune evasion and modulation strategies of poxviruses. Viruses. 2015;7:4800–4825. doi: 10.3390/v7082844. - DOI - PMC - PubMed
    1. Bidgood SR, et al. Poxviruses package viral redox proteins in lateral bodies and modulate the host oxidative response. PLoS Pathog. 2022;18:e1010614. doi: 10.1371/journal.ppat.1010614. - DOI - PMC - PubMed

Substances

LinkOut - more resources