Decreased expression of the NLRP6 inflammasome is associated with increased intestinal permeability and inflammation in obesity with type 2 diabetes
- PMID: 38315242
- PMCID: PMC10844155
- DOI: 10.1007/s00018-024-05124-3
Decreased expression of the NLRP6 inflammasome is associated with increased intestinal permeability and inflammation in obesity with type 2 diabetes
Abstract
Background: Obesity-associated dysfunctional intestinal permeability contributes to systemic chronic inflammation leading to the development of metabolic diseases. The inflammasomes constitute essential components in the regulation of intestinal homeostasis. We aimed to determine the impact of the inflammasomes in the regulation of gut barrier dysfunction and metabolic inflammation in the context of obesity and type 2 diabetes (T2D).
Methods: Blood samples obtained from 80 volunteers (n = 20 normal weight, n = 21 OB without T2D, n = 39 OB with T2D) and a subgroup of jejunum samples were used in a case-control study. Circulating levels of intestinal damage markers and expression levels of inflammasomes as well as their main effectors (IL-1β and IL-18) and key inflammation-related genes were analyzed. The impact of inflammation-related factors, different metabolites and Akkermansia muciniphila in the regulation of inflammasomes and intestinal integrity genes was evaluated. The effect of blocking NLRP6 by using siRNA in inflammation was also studied.
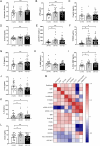
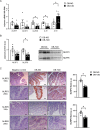
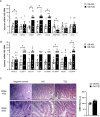
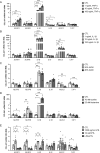
Results: Increased circulating levels (P < 0.01) of the intestinal damage markers endotoxin, LBP, and zonulin in patients with obesity decreased (P < 0.05) after weight loss. Patients with obesity and T2D exhibited decreased (P < 0.05) jejunum gene expression levels of NLRP6 and its main effector IL18 together with increased (P < 0.05) mRNA levels of inflammatory markers. We further showed that while NLRP6 was primarily localized in goblet cells, NLRP3 was localized in the intestinal epithelial cells. Additionally, decreased (P < 0.05) mRNA levels of Nlrp1, Nlrp3 and Nlrp6 in the small intestinal tract obtained from rats with diet-induced obesity were found. NLRP6 expression was regulated by taurine, parthenolide and A. muciniphila in the human enterocyte cell line CCL-241. Finally, a significant decrease (P < 0.01) in the expression and release of MUC2 after the knockdown of NLRP6 was observed.
Conclusions: The increased levels of intestinal damage markers together with the downregulation of NLRP6 and IL18 in the jejunum in obesity-associated T2D suggest a defective inflammasome sensing, driving to an impaired epithelial intestinal barrier that may regulate the progression of multiple obesity-associated comorbidities.
Keywords: Inflammasome; Inflammation; Intestinal integrity; Jejunum; NLRP; Obesity; Type 2 diabetes.
© 2024. The Author(s).
Conflict of interest statement
The authors declare that they have no competing interests.
Figures


Similar articles
-
The Differential Expression of the Inflammasomes in Adipose Tissue and Colon Influences the Development of Colon Cancer in a Context of Obesity by Regulating Intestinal Inflammation.J Inflamm Res. 2021 Dec 1;14:6431-6446. doi: 10.2147/JIR.S335882. eCollection 2021. J Inflamm Res. 2021. PMID: 34880645 Free PMC article.
-
NLRP3 inflammasome blockade reduces adipose tissue inflammation and extracellular matrix remodeling.Cell Mol Immunol. 2021 Apr;18(4):1045-1057. doi: 10.1038/s41423-019-0296-z. Epub 2019 Sep 24. Cell Mol Immunol. 2021. PMID: 31551515 Free PMC article.
-
Upregulation of Intestinal NLRP6 Inflammasomes After Roux-en-Y Gastric Bypass Promotes Gut Immune Homeostasis.Obes Surg. 2020 Jan;30(1):327-335. doi: 10.1007/s11695-019-04152-4. Obes Surg. 2020. PMID: 31602628
-
The NLRP6 inflammasome.Immunology. 2021 Mar;162(3):281-289. doi: 10.1111/imm.13293. Epub 2020 Dec 27. Immunology. 2021. PMID: 33314083 Free PMC article. Review.
-
The NLRP6 inflammasome in health and disease.Mucosal Immunol. 2020 May;13(3):388-398. doi: 10.1038/s41385-020-0256-z. Epub 2020 Jan 27. Mucosal Immunol. 2020. PMID: 31988468 Free PMC article. Review.
Cited by
-
Serum and urinary levels of MIF, CD74, DDT and CXCR4 among patients with type 1 diabetes mellitus, type 2 diabetes and healthy individuals: Implications for further research.Metabol Open. 2024 Sep 15;24:100320. doi: 10.1016/j.metop.2024.100320. eCollection 2024 Dec. Metabol Open. 2024. PMID: 39323959 Free PMC article.
-
Dexmedetomidine ameliorates diabetic intestinal injury by promoting the polarization of M2 macrophages through the MMP23B pathway.World J Diabetes. 2024 Sep 15;15(9):1962-1978. doi: 10.4239/wjd.v15.i9.1962. World J Diabetes. 2024. PMID: 39280187 Free PMC article.
-
Cordycepin Ameliorates High Fat Diet-Induced Obesity by Modulating Endogenous Metabolism and Gut Microbiota Dysbiosis.Nutrients. 2024 Aug 27;16(17):2859. doi: 10.3390/nu16172859. Nutrients. 2024. PMID: 39275176 Free PMC article.
-
Sex Differences in Cardiovascular Diseases: Exploring the Role of Microbiota and Immunity.Biomedicines. 2024 Jul 24;12(8):1645. doi: 10.3390/biomedicines12081645. Biomedicines. 2024. PMID: 39200110 Free PMC article. Review.
-
Association of Circulating Markers of Microbial Translocation and Hepatic Inflammation with Liver Injury in Patients with Type 2 Diabetes.Biomedicines. 2024 May 31;12(6):1227. doi: 10.3390/biomedicines12061227. Biomedicines. 2024. PMID: 38927434 Free PMC article.
References
MeSH terms
Substances
Grants and funding
LinkOut - more resources
Full Text Sources
Medical
Miscellaneous

