[Preprint]. 2024 Nov 2:2024.01.20.576455.
doi: 10.1101/2024.01.20.576455.

Divergent opioid-mediated suppression of inhibition between hippocampus and neocortex across species and development

Affiliations

Divergent opioid-mediated suppression of inhibition between hippocampus and neocortex across species and development

Adam P Caccavano et al. bioRxiv. .

Abstract

Opioid receptors within the CNS regulate pain sensation and mood and are key targets for drugs of abuse. Within the adult rodent hippocampus (HPC), μ-opioid receptor agonists suppress inhibitory parvalbumin-expressing interneurons (PV-INs), thus disinhibiting the circuit. However, it is uncertain if this disinhibitory motif is conserved in other cortical regions, species, or across development. We observed that PV-IN mediated inhibition is robustly suppressed by opioids in hippocampus proper but not neocortex in mice and nonhuman primates, with spontaneous inhibitory tone in resected human tissue also following a consistent dichotomy. This hippocampal disinhibitory motif was established in early development when PV-INs and opioids were found to regulate primordial network rhythmogenesis. Acute opioid-mediated modulation was partially occluded with morphine pretreatment, with implications for the effects of opioids on hippocampal network activity important for learning and memory. Together, these findings demonstrate that PV-INs exhibit a divergence in opioid sensitivity across brain regions that is remarkably conserved across evolution and highlights the underappreciated role of opioids acting through immature PV-INs in shaping hippocampal development.


Conflict of interest statement

DECLARATION OF INTERESTS The authors declare no competing interests.

Figures

Fig. 1:
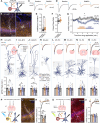
Fig. 1:. μORs are selectively enriched in hippocampal PV-INs.
(A) snRNAseq of GABAergic INs in P28 mice across HPC and CTX, highlighting Oprm1 expression. Cardinal clusters of Lhx6-expressing MGE-INs are colored and delineated as SST (aquamarine), PV (red), and LAMP5 (peach) in contrast to caudal ganglionic eminence (CGE)-derived INs (gray). (B) Oprm1 expression of PV cluster cells, ncell = 1920 (HPC), 3935 (CTX) from nmice = 2 (1F), age = P28. Asterisks represent results of Dunn’s post hoc comparisons after comparing all HPC/CTX differences for Oprm1/Oprd1 in PV /SST-INs (see Fig. 4B for other comparisons). (C) In situ hybridization (ISH) RNAscope for Oprm1 and Pvalb in wild-type (WT) mice across pyramidal cell layers in CA (CA1-CA3) regions of HPC and primary neocortical regions M1, S1 and V1. Closed arrow (CA1) indicates Oprm1+Pvalb+ colocalized cell, while open arrow (M1) indicates Oprm1+Pvalb- cell. (D) Colocalization quantification of percentage of Pvalb+ somata co-expressing Oprm1 for 2–5 sections from each of n = 4 (2F) WT mice, age = P62. Asterisks represent Tukey’s post hoc comparisons after a significant effect of region was observed via 1-way ANOVA. (E) RiboTag-associated Oprm1 expression in n = 4 (2F) P120 Nkx2.1Cre: Rpl22(RiboTag)HA/HA mice, comparing bulk HPC/CTX tissue to MGE-INs. Asterisks represent Tukey’s post hoc comparisons after significant effects of region, cell type, and region × cell type interaction were observed via 2-way ANOVA. (F) Immunohistochemical (IHC) stain for PV in μOR-mCherry mice (boosted with anti-RFP) labeling hippocampal regions: CA1, CA2, CA3, and DG and layers: stratum (str.) oriens (or.), pyramidale (pyr.), radiatum (rad.), lacunosum-moleculare (l.m.), molecular (mol.), granular (gr.), hilus (hil.), and neocortical regions: M1, PrL, S1, and V1, and layers: L1, L2/3, L4, L5/6. (G-H) Quantification of IHC for nsection = 4 from nmice = 2F, age = P70 for all layers of indicated region. (G) Colocalization quantification of the percent of PV cells co-expressing μORs (green circles) and percent of μOR cell co-expressing PV (magenta triangles). Enlarged markers indicate quantification from example images. Asterisks represent significance of unpaired t-test comparing the percentage of PV cells co-expressing μORs across all HPC and CTX. (H) Cell density (cells/mm2) for μOR-expressing cells (magenta), PV cells (green) and PV-μOR colocalized cells (black). Data are represented as mean ± SEM. * p < 0.05, ** p < 0.01, *** p < 0.001, **** p < 0.0001. See Table S1 for statistical details for this and all subsequent figures.
Fig. 2:
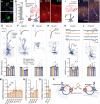
Fig. 2:. Hippocampal PV-INs are selectively hyperpolarized by opioids.
(A) Schematic of whole-cell recordings of PV-INs from PV-tdTom mice voltage-clamped to −50 mV to record the effect of μOR agonist/antagonist DAMGO/CTAP. (B) Representative post hoc staining of recorded PV-INs in CA1 and V1. (C) Average change in holding current elicited by DAMGO/CTAP normalized to baseline for ncell = 11 CA1 from nmice = 5 (3F), age = P37–70 (P57 ± 7) and ncell = 15 V1 from nmice = 4 (3F), age = P47–71 (P58 ± 6), with (D) example traces showing effects of drugs on baseline holding current (rapid inward and outward currents reflect sEPSCs/sIPSCs), (E) post hoc reconstructions, (F) holding current summary data, and (G) input resistance summary data in a subset of cells, for CA1 PV-INs (1, left) and V1 PV-INs (2, right). Asterisks represent Tukey’s post hoc comparisons after a significant effect of treatment was found via 1-way repeated measures ANOVA. (H) Example traces showing effect of DAMGO/CTAP with GTPγS substituted for GTP in the internal pipette solution, with DAMGO administration occurring 15 min. after break-in, performed in ncell = 12 CA1 and 12 V1 from nmice = 4 (2F), age = P118–392 (P315 ± 66). Summary statistics for DAMGO-mediated change from baseline in (I) holding current and (J) input resistance for the four conditions (CA1/V1 and GTP/GTPγS). Asterisks represent Tukey’s post hoc comparisons after significant effects of region, internal solution, and region × internal interaction were observed via 2-way ANOVA. In these and all subsequent plots, data from male/female subjects are indicated with a closed/open marker, with enlarged marker indicating example trace.
Fig. 3:
Fig. 3:. Opioids selectively suppress hippocampal but not neocortical PV-IN inhibition.
(A) Schematic of whole-cell recordings of PCs from PVCre/+:ChR2fl/+ mice voltage-clamped at −70 mV (with high Cl- internal) to record the effect of DAMGO/CTAP on light-evoked IPSCs (leIPSCs). (B) Representative post hoc staining of a recorded CA1 superficial PC (sPC) and M1 layer 2/3 PC. (C) Example CA1-PC leIPSC traces, dark lines represent average of ten light grey traces, showing an increased coefficient of variation (CV = SD/mean). (D) Example paired pulse ratio (PPR = peak2/peak1) traces recorded in a subset of CA1-PCs. Summary data for (E) CV for ncell = 24 from nmice = 10 (5F), age = P28–133 (P55 ± 9) and (F) PPR for ncell = 13 from nmice = 3 (2F), age = P78–83 (P80 ± 2). Asterisks represent results of paired t-test/Wilcoxon. (G) Average leIPSC peak amplitude normalized to baseline in response to DAMGO/CTAP for ncell = 19 CA1-PCs from nmice = 7 (4F), age = P28–55 (P44 ± 3) and ncell = 16 M1-PCs from nmice = 6 (4F), age = P34–61 (P46 ± 5). Asterisk marks regions where data (10 s bins) survived multiple comparisons via 2-way ANOVA. (H-O) Mouse leIPSC experiments with (top) averaged example traces, (top inset) example of brain slices, (middle) representative post hoc reconstructions, and (bottom) summary data in (H) ncell = 12 CA1-sPCs from nmice = 6 (3F), age = P28–133 (P62 ± 15), (I) ncell = 14 CA1 deep PCs (dPCs) from nmice = 9 (5F), age = P28–133 (P54 ± 10), (J) ncell = 17 CA3-PCs from nmice = 7 (2F), age = P41–80 (P65 ± 6), (K) ncell = 21 DG granule cells (GCs) from nmice = 9 (3F), age = P41–125 (P69 ± 9), (L) ncell = 16 M1-PCs from nmice = 6 (4F), age = P34–61 (P46 ± 5), (M) ncell = 12 PrL-PCs from nmice = 3 (2F), age = P34–144 (P107 ± 37), (N) ncell = 15 S1-PCs from nmice = 4 (3F), age = P45–52 (P49 ± 2), and (O) ncell = 16 V1-PCs from nmice = 6 (2F), age = P27–133 (P73 ± 18). (P) Viral bilateral intra-cerebral injection of pAAV-BiPVe4(AAC)-ChR2-mCherry in dorsal hippocampus of WT mice, and schematic of leIPSC recording. (Q) Representative post hoc staining of a recorded CA1-PC (white) and viral expression (orange, see Fig. S4 for AAC viral validation). (R) Summary data for ncell = 12 CA1-PCs from 1M, age = P50. (S) Viral bilateral injection of Cre-dependent pAAV-Ef1a-DIO-C1V1-mCherry in dorsal hippocampus of PVCre/+:Oprm1fl/fl mice (see Fig. S5 for KO validation), and schematic of leIPSC recording. (T) Representative post hoc staining of a recorded CA1-PC (white) and viral expression (red). (U) Summary data for ncell = 9 CA1-PCs from 2M, age = P58–61. Asterisks in (H-U) summary plots represent post hoc comparisons (Tukey’s/Dunn’s) after a significant effect of treatment was found via 1-way repeated measure ANOVA/mixed model/Friedman’s test.
Fig. 4:
Fig. 4:. δOR activation and SST-IN inhibition exhibit similar functional HPC-CTX divergence.
(A) snRNAseq of cardinal clusters of HPC/CTX MGE-INs, highlighting Oprd1 expression. (B, left) Oprd1 expression in PV cluster cells, ncell = 1920 (HPC), 3935 (CTX) and (right) Oprm1 and Oprd1 expression in SST cluster cells, ncell = 1518 (HPC), 3002 (CTX), from nmice = 2 (1F), age = P28. Asterisks and non-significant p-values represent results of Dunn’s post hoc comparisons after comparing all HPC/CTX differences for Oprm1/Oprd1 in PV /SST-INs (including from Fig. 1B). (C) RNAscope for Oprd1 and Pvalb in WT mice comparing CA1 to V1 (all layers). Majority of cells were Oprd1+Pvalb+ colocalized (not indicated), with Oprd1-Pvalb+ cells indicated with open arrows. (D) Colocalization quantification of percentage of Pvalb+ somata co-expressing Oprd1 for 1 section each from n = 4 (2F) WT mice, age = P30–32. Asterisks represent significance of unpaired t-test. (E) RiboTag-associated Oprd1 expression in n = 4 (2F) P120 Nkx2.1Cre: Rpl22(RiboTag)HA/HA mice, comparing bulk HPC/CTX tissue to MGE-INs. Asterisks represent Tukey’s post hoc comparisons after significant effects of region, cell type, and region × cell type interaction were observed via 2-way ANOVA. (F) Schematic of whole-cell recordings of PCs recorded in PVCre/+:ChR2fl/+ mice voltage-clamped at −70 mV (with high Cl- internal) to record the effect of δOR agonist/antagonist DPDPE/naltrindole on leIPSCs. δOR leIPSC experiments were performed in (G) ncell = 14 CA1-PCs and 15 V1-PCs from nmice = 7 (2F), age = P57–90 (P73 ± 5), with (top) averaged example traces and (bottom) summary data. (H) Schematic of whole-cell recordings of PCs voltage-clamped at −70 mV recorded in SSTCre/+:ChR2fl/+ mice to record the effect of μOR/δOR agonists/antagonists on leIPSCs. (I) Representative post hoc staining of recorded CA1 and S1 PCs in SSTCre/+:ChR2fl/+ mice. SST leIPSC experiments with (J) DAMGO/CTAP were performed in ncell = 7 CA1-PCs and 7 S1-PCs from nmice = 4 (3F), age = P57–240 (P162 ± 46) and with (K) DPDPE/Naltrindole in ncell = 7 CA1-PCs and 7 S1-PCs from nmice = 4 (2F), age = P74–135 (P106 ± 13), with (top) averaged example traces and (bottom) summary data. Asterisks in (G, J, K) represent Tukey’s/Dunn’s post hoc comparisons after a significant effect of treatment was found via 1-way repeated measure ANOVA/Friedman’s test.
Fig. 5:
Fig. 5:. Opioids selectively suppress hippocampal inhibition in nonhuman primates and resected human tissue.
(A) RNAscope for Oprm1 and Pvalb in adult rhesus macaque. Closed arrow (CA1) indicates Oprm1+Pvalb+ colocalized cell, while open arrows (CTX) indicate Oprm1+Pvalb- cells. (B) Quantification of the percentage of Pvalb+ somata co-expressing Oprm1 for nsection = 3 from 1F, age = 17.6 years. Asterisks represent significance of unpaired t-test. (C) Schematic of whole-cell recordings of PCs from S5E2-ChR injected macaques voltage-clamped to −70 mV (with high Cl- internal) to record the effect of DAMGO/CTAP on leIPSCs. (D) Representative post hoc staining of recorded CA1 and M1 PCs. (E-H) Macaque leIPSC experiments with (top) averaged example traces, (middle) representative post hoc reconstructions, and (bottom) summary data in (E) ncell = 6 CA1-PCs, (F) 7 CA3-PCs, (G) 9 DG-GCs, and (H) 8 M1-PCs, from nprimate = 5 (2F), age = 7.4–15.9 (11.2 ± 1.4) years. (I) Schematic of whole-cell recordings of PCs from resected human slices voltage-clamped at −70 mV (with high Cl- internal) to record the effect of DAMGO/CTAP on spontaneous IPSCs (sIPSCs). (J) Representative post hoc staining of a recorded CA1 and medial temporal cortex PC. (K-L) Human sIPSC experiments with (top) example traces, (middle) representative post hoc reconstructions, and (bottom) summary data in (K) ncell = 16 CA-PCs (CA1 & CA3) and (L) ncell = 13 CTX-PCs, from nhuman = 4 (2F), age = 37.3–54.8 (44.8 ± 3.7) years. Asterisks in (E-L) represent Tukey’s/Dunn’s post hoc comparisons after a significant effect of treatment was found via 1-way repeated measure ANOVA/mixed model/Friedman’s test. (M-O) Comparison of DAMGO responses across species revealed a similar hippocampal-neocortical divergence in the opioid-mediated suppression of inhibition across (M) mice (data from Fig. 3H-O, bottom), (N) macaques (data from E-H, bottom), and (O) humans (data from K-L, bottom). Asterisks represent significant deviations from the normalized baseline via 1-sample t-test/Wilcoxon. (P) Proposed model: hippocampal PV-INs are selectively enriched in μORs, leading to hyperpolarization and suppressed synaptic release.
Fig. 6:
Fig. 6:. Tac1 cells, as a proxy for immature PV-INs, are suppressed by μOR agonists in HPC.
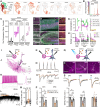
(A) snRNAseq of GABAergic INs in P10 mice across HPC and CTX. Far left, Cardinal clusters of Lhx6-expressing MGE-INs are colored and delineated as putative SST (aquamarine), PV (red), and LAMP5 (peach) in contrast to caudal ganglionic eminence (CGE)-derived INs (gray), with (left to right) individual expression of markers Lhx6, SST, Lamp5, Pvalb, and Tac1 indicated. Expression colormap scale shown in B. (B) Tac1 expression of cardinal MGE-IN cell clusters SST, Lamp5, and PV, ncell = 1476 (SST), 920 (Lamp5), 1451 (PV) from nmice = 2 (1F), age = P10. Asterisks represent results of Dunn’s post hoc comparisons after a significant effect of cell type was find via Kruskal-Wallis. (C) RiboTag-associated Tac1 expression in n = 3 P5 and 4 (2F) P60, P120, and P180 Nkx2.1Cre: Rpl22(RiboTag)HA/HA mice, comparing bulk HPC/CTX tissue to MGE-INs. Asterisks represent Tukey’s post hoc comparisons after significant effects of cell type and region × cell type interaction were observed via 2-way ANOVA. (D-E) IHC stain for PV in Tac1Cre/+:tdTomfl/+ mice, ranging from ages (D, top to bottom) P5, P8, P12, P45 in CA1, showing the developmental onset of PV expression and colocalization with Tac1, as well as (E) in P45 adults throughout S1 cortex (top) and HPC (bottom). (F) IHC stain for SST in Tac1Cre/+:tdTomfl/+ mice, same ages as D. Arrows indicate colocalized cells. Quantification of (F) percent colocalization and (H) cell density. Left: PV-Tac1 CA1 quantification, nsection = 2–4 from nmice = 1 P5, 1 P8, 1 P12, and 3F P45. Middle: PV-Tac1 quantification for HPC and S1, nmice = 3F P45 (2–4 sections each). Right: SST-Tac1 CA1 quantification, nsection = 2 from nmice = 1 P5, 1 P8, 1 P12, and 2F P45. (I) Schematic of whole-cell recordings of Tac1-INs from P8–11 Tac1Cre/+:tdTomfl/+ mice to measure intrinsic parameters and the effect of DAMGO. (J) Example morphological reconstruction of Tac1-INs (see Fig. S8 for more reconstructions). (K) Representative firing of Tac1-IN (see Fig. S9 and Table S2 for full characterization). (L) Example trace showing slow currents from DAMGO administration and rapid sEPSCs/sIPSCs. (M) Holding current summary data across baseline, DAMGO, and wash conditions for ncell = 9 hippocampal Tac1-INs from nmice = 4 (P8–11). (N) Schematic of Tac1-IN→PC paired recordings from P10–11 Tac1Cre/+:tdTomfl/+ mice to measure the effect of DAMGO on unitary currents (uIPSCs). (O) Representative paired recording trace, with repetitive current injection to Tac1-IN to elicit firing (top) and record uIPSCs in downstream PC (bottom). (P) Paired recording summary data of uIPSC peak amplitude in npairs = 7 CA1 and 3 CA3 Tac1-IN→PC pairs from nmice = 3 (P10–11). (Q) Schematic of whole-cell recordings of PCs recorded in Tac1Cre/+:ChR2fl/+ mice voltage-clamped at −70 mV (with high Cl- internal) to record the effect of DAMGO on leIPSCs. (R) Representative post hoc stains of PCs recorded in CA1, CA3, and S1. (S) leIPSC experiments were performed in ncell = 17 CA1-PCs from nmice = 3 (P5–7), ncell = 9 CA3-PCs from nmice = 2 (P6–7), and ncell = 12 S1-PCs from nmice = 3 (P7–10), with (top) averaged example traces and (bottom) summary data. Asterisks in (M, P, S) represent Tukey’s/Dunn’s post hoc comparisons after a significant effect of treatment was found via 1-way repeated measure ANOVA/mixed model/Friedman’s test.
Fig. 7:
Fig. 7:. Opioids and Tac1 cells regulate spontaneous activity of the developing hippocampus.
(A) Schematic of recordings of GDP associated currents (GDP-Is), recorded intracellularly in CA3-PCs voltage-clamped to 0 mV in WT mice. (B) Example traces of the effect of 100 nM DAMGO applied for 5 minutes, with (right inset) example GDP-I events. (C) DAMGO summary data for GDP-I event frequency and amplitude from ncell = 18 from nmice = 6 (P5–8). (D) Schematic of CA3-PC GDP-I recordings from Tac1Cre/+:ArchTfl/+ mice to silence Tac1 cells. (E) Example traces of the effect of ArchT activation with 580 nm light for 1–2 min. (F) ArchT summary data for GDP-I event frequency and amplitude from ncell = 20 from nmice = 6 (P5–8). Asterisks in (C, F) represent Dunn’s post hoc comparisons after a significant effect of treatment was found via Friedman’s test. (G) Schematic of ArchT-DAMGO occlusion in CA3-PCs. (H) Example trace of the effect of Tac1-ArchT silencing for 10 min., with 100 nM DAMGO applied 5 min. after start of Tac1-ArchT silencing. (I) ArchT-DAMGO occlusion summary data from ncell = 13 from nmice = 4 (P6–8). DAMGO administration following Tac1-AchT silencing did not further suppress GDP-I event frequency (yellow). DAMGO alone (orange) plotted from C for comparison. Asterisks represent results of unpaired t-test.
Fig. 8:
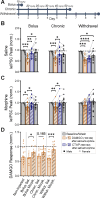
Fig. 8:. Morphine pre-treatment occludes acute DAMGO suppression.
(A) Morphine pretreatment experimental design with 3 regimens: bolus (15 mg/kg), chronic (15, 20, 25, 30, 40, 50 mg/kg) and withdrawal (chronic regimen + 72 hours). All injections were performed in adult PVCre/+:ChR2fl/+ mice with either daily morphine or saline injections, for a total of 6 groups. (B) Saline control groups all exhibited significant DAMGO suppression of leIPSCs recorded in CA1-PCs (cf. Fig. 3H-I). Bolus: ncell = 12 from nmice = 3 (2F), age = P64–126 (P103 ± 20). Chronic: ncell = 15 from nmice = 3F, age = P67–76 (P73 ± 3). Withdrawal: ncell = 14 from nmice = 3 (2F), age = P78–83 (P80 ± 2). (C) Morphine injected groups exhibited partial occlusion of acute DAMGO-mediated suppression of leIPSCs, particularly in the withdrawal group. Bolus: ncell = 15 from nmice = 3 (2F), age = P65–127 (P104 ± 20). Chronic: ncell = 18 from nmice = 3M, age = P68–76 (P72 ± 2). Withdrawal: ncell = 15 from nmice = 3 (2F), age = P77–81 (P79 ± 1). Asterisks in (B-C) represent Tukey’s post hoc comparisons after a significant effect of treatment was found via 1-way repeated measure ANOVA/mixed model. (D) Combined DAMGO responses (non-injected data from Fig. 3H-I for comparison). Asterisks represent Šídák’s post hoc comparisons after a significant effect of treatment was found via 2-way ANOVA, with comparisons restricted to those of a priori interest (morphine vs. saline for each regimen).

Similar articles

References

    1. Le Merrer J., Becker J.A., Befort K., and Kieffer B.L. (2009). Reward processing by the opioid system in the brain. Physiol Rev 89, 1379–1412. 10.1152/physrev.00005.2009. - DOI - PMC - PubMed
    1. Corder G., Castro D.C., Bruchas M.R., and Scherrer G. (2018). Endogenous and Exogenous Opioids in Pain. Annu Rev Neurosci 41, 453–473. 10.1146/annurev-neuro-080317-061522. - DOI - PMC - PubMed
    1. Spencer M.R., Miniño A.M., and Warner M. (2022). Drug Overdose Deaths in the United States, 2001–2021. NCHS Data Brief, 1–8. - PubMed
    1. Florence C., Luo F., and Rice K. (2021). The economic burden of opioid use disorder and fatal opioid overdose in the United States, 2017. Drug Alcohol Depend 218, 108350. 10.1016/j.drugalcdep.2020.108350. - DOI - PMC - PubMed
    1. St Marie B., Coleman L., Vignato J.A., Arndt S., and Segre L.S. (2020). Use and Misuse of Opioid Pain Medications by Pregnant and Nonpregnant Women. Pain Manag Nurs 21, 90–93. 10.1016/j.pmn.2019.05.002. - DOI - PMC - PubMed

Publication types