. 2024 Feb 1;15(2):107.
doi: 10.1038/s41419-024-06469-0.

FSTL3 promotes tumor immune evasion and attenuates response to anti-PD1 therapy by stabilizing c-Myc in colorectal cancer

Affiliations

FSTL3 promotes tumor immune evasion and attenuates response to anti-PD1 therapy by stabilizing c-Myc in colorectal cancer

Haiyang Li et al. Cell Death Dis. .

Abstract

Programmed cell death 1 ligand 1 (PDL1)/programmed cell death 1 (PD1) blockade immunotherapy provides a prospective strategy for the treatment of colorectal cancer (CRC), but various constraints on the effectiveness of the treatment are still remaining. As reported in previous studies, follistatin-like 3 (FSTL3) could mediate inflammatory response in macrophages by induction lipid accumulation. Herein, we revealed that FSTL3 were overexpressed in malignant cells in the CRC microenvironment, notably, the expression level of FSTL3 was related to tumor immune evasion and the clinical efficacy of anti-PD1 therapy. Further studies determined that hypoxic tumor microenvironment induced the FSTL3 expression via HIF1α in CRC cells, FSTL3 could bind to the transcription factor c-Myc (354-406 amino acids) to suppress the latter's ubiquitination and increase its stability, thereby to up-regulated the expression of PDL1 and indoleamine 2,3-dioxygenase 1 (IDO1). The results in the immunocompetent tumor models verified that FSLT3 knockout in tumor cells increased the proportion of CD8+ T cells in the tumor microenvironment, reduced the proportion of regulatory T cells (CD25+ Foxp3+) and exhausted T cells (PD1+ CD8+), and synergistically improved the anti-PD1 therapy efficacy. To sum up, FSTL3 enhanced c-Myc-mediated transcriptional regulation to promote immune evasion and attenuates response to anti-PD1 therapy in CRC, suggesting the potential of FSTL3 as a biomarker of immunotherapeutic efficacy as well as a novel immunotherapeutic target in CRC.


Conflict of interest statement

The authors declare no competing interests.

Figures
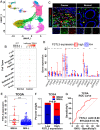
Fig. 1
Fig. 1. FSTL3 is hyper-expressed in cancer cells and closely correlates with microsatellite instability of CRC.
A The single-cell sequencing analysis identified 12 cell clusters in CRC tissues including mainly tumor-associated macrophage (TAM), cancer cell, monocyte, cancer-associated fibroblast, epithelial cell, T cell, NK cell, and B cell and other cell clusters. B The expression of FSTL3 in different cell clusters in CRC tissues and normal tissues. C Immunofluorescence analysis of FSTL3 expression in KRT19-positive cells (cancer cells) of CRC tissues. D Expression of immune checkpoints in high versus low FSTL3 expression subgroups. E The expression level of FSTL3 in microsatellite instability-high (MSI-H) tumors and microsatellite instability-low (MSI-L) tumors. F The proportion of MSI-H tumors in high versus low FSTL3 expression subgroups. G ROC curve showing the predictive efficiency of FSTL3 expression for microsatellite instability. Data are shown as mean ± SD. **P < 0.01, ***P < 0.001.
Fig. 2
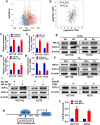
Fig. 2. Hypoxia induces up-regulation of FSTL3 via HIF1α in in CRC cells.
A Volcano plot showing the differentially expressed genes between RKO cells (human CRC cell line) with and without hypoxia treatment from GSE145108 dataset. B The correlation between the mRNA levels of HIF1α and FSTL3 in the TCGA CRC cohort. qRT-PCR was performed to detect FSTL3 mRNA in HCT116 and HCT8 cells after 100 μM CoCl2 treatment for 6 h (C) and incubation in hypoxic incubator (1% O2) for 24 h (D). Western blotting was performed to detect HIF1α and FSTL3 protein levels in HCT116 and HCT8 cells after CoCl2 treatment (E) and incubation in hypoxic incubator (F). The FSTL3 mRNA expression in HCT116 and HCT8 cells after overexpression of HIF1α via transfected plasmids examined (G) and administration of HIF1α inhibitor (BAY87-2243, 10 μM) (H) detected by qRT-PCR. The protein levels of HIF1α and FSTL3 in HCT116 and HCT8 cells after overexpression of HIF1α (I) and the administration of BAY87-2243 (J) examined by western blotting. K The potential binding sites of HIF1α to the FSTL3 promoter region predicted by the Jaspar2022 database. L ChIP and qRT-PCR were performed to detect the enrichment of HIF1α on the FSTL3 promoter. Data are shown as mean ± SD. **P < 0.01, ***P < 0.001.
Fig. 3
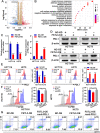
Fig. 3. FSTL3 positively regulates PDL1 expression in CRC cells.
A Volcano plot depicting differentially expressed genes in FSTL3 knockdown HCT116 cells. The immune checkpoint PDL1 (CD274), IDO1 and CEACAM1, which were down-regulated in expression, and marked by boxes. B GO analysis of the differentially expressed genes in FSTL3 knockdown HCT116 cells. The expression of PDL1 in FSTL3 knockdown and overexpressed CRC cells was detected by qRT-PCR (C), western blotting (D) and flow cytometry (E). F CFSE staining analysis indicating the proliferation ratio of CD8+ T cells after co-culture with FSTL3-OE cells in the absence or presence of an anti-PDL1 neutralizing antibody by flow cytometry. G Flow cytometry apoptosis analysis showing the apoptotic percentage of CD8+ T cells after co-culture with FSTL3-OE cells in the absence or presence of an anti-PDL1 neutralizing antibody. Data are shown as mean ± SD. **P < 0.01, ***P < 0.001.
Fig. 4
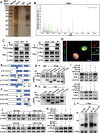
Fig. 4. FSTL3 binds directly to c-Myc and enhances the stability of c-Myc in CRC cells.
A Immunoprecipitate captured by anti-Flag antibody from FSTL3-OE HCT116 cells was separated by SDS-PAGE gel followed by silver staining. B The peptide sequences of the c-Myc protein as detected in the immunoprecipitate complex by mass spectrometry. C Western blotting analysis of immunoprecipitate complexes captured from FSTL3-OE HCT116 cells against anti-Flag or anti-c-Myc antibody. D Immunofluorescence observation revealed that FSTL3 co-localized with c-Myc in the nucleus of HCT116 cells. E Schematic diagram of full-length FSTL3 and its various deletion mutants. F Schematic diagram of full-length c-Myc and its various deletion mutants. G The plasmids of Flag-FSTL3 full-length and specific Flag-FSTL3-depletion fragments were transfected into HCT116 cells, followed by immunoprecipitation using anti-Flag antibody and western blotting to assess the specific region of FSTL3 binding to c-Myc. H The plasmids of HA-c-Myc full-length and specific HA-c-Myc-depletion fragments were transfected into HCT116 cells, followed by immunoprecipitation using anti-HA antibody and western blotting to assess the specific region of c-Myc binding to FSTL3. I Western blotting analysis of c-Myc and PDL1 expression in HCT116 cells transfected with FSTL3 shRNA or together with c-Myc over-expression plasmid, and in HCT116 cells transfected with FSTL3 over-expression lentivirus or together with c-Myc siRNA. J Stability analysis of c-Myc protein in FSTL3-KD and FSTL3-OE HCT116 cells treated with 40 μM cycloheximide (chx) for indicated times. K Western blotting was used to detect the expression of c-Myc protein in FSTL3-KD and FSTL3-OE HCT116 cells treated with 10 μM MG132. L Ubiquitination assay of c-Myc in FSTL3-KD and FSTL3-OE HCT116 cells.
Fig. 5
Fig. 5. Hyper-expressed FSTL3 in CRC cells enhances the c-Myc/IDO1 pathway and induces Tregs.
The expression of IDO1 in FSTL3-KD and FSTL3-OE CRC cells was detected by qRT-PCR (A) and western blotting (B). C Concentration of kynurenine and tryptophan in the cell supernatants of FSTL3-KD MC38 cells detected by ELISA. D Concentration of kynurenine and tryptophan in the cell supernatants of FSTL3-OE MC38 cells detected by ELISA. E The proportion of Tregs in CD4+ T cells after co-culture with FSTL3-OE CRC cells in the absence or presence of 1-MT. F Western blotting analysis of c-Myc and IDO1 expression in CRC cells transfected with FSTL3 shRNA or together with c-Myc over-expression plasmid, and in CRC cells transfected with FSTL3 over-expression lentivirus or together with c-Myc siRNA. G The potential binding sites of c-Myc to the IDO1 promoter region predicted by the Jaspar2022 database. H ChIP and qRT-PCR were performed to detect the enrichment of c-Myc on the IDO1 promoter. Data are shown as mean ± SD. **P < 0.01, ***P < 0.001.
Fig. 6
Fig. 6. Knockdown of FSTL3 in MC38 cells fosters the establishment of anti-tumor immune microenvironment in CRC.
A Immunodeficient mouse (BABL/c-nude mouse) tumor models were constructed by subcutaneous implantation of MC38 cells with FSTL3-KD or NC-KD. Tumor images, growth curves and weight were obtained at day 16 after dissection. B Immunocompetent mouse (C57BL/6J mouse) tumor models were constructed by subcutaneous implantation of FSTL3-KD or NC-KD MC38 cells (FSTL3-KD group or NC-KD group). Tumor images, growth curves and weight were obtained at day 20 after dissection. C Flow cytometric analysis of the infiltrated CD8+ T cells in tumor tissues of C57BL/6J mice in each group. Flow cytometric analysis of PD1 (D) and IFNγ (E) in CD8+ T cells in tumor tissues of C57BL/6J mice in each group. F Flow cytometric analysis of Tregs (CD25+ Foxp3+ T cells) in tumor tissues of C57BL/6J mice in each group. Data are shown as mean ± SD. *P < 0.05, **P < 0.01, ***P < 0.001.
Fig. 7
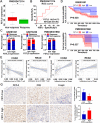
Fig. 7. FSTL3 serves as a potential biomarker of resistance to ICB therapy.
A Box plots showing the expression of FSTL3 in the response group and non-response group. B ROC curve showing the predictive efficiency of FSTL3 expression for ICB therapy response. C The response rate of ICB therapy in high versus low FSTL3 expression subgroups in the cohorts GSE91061, GSE78220, and PMID29301960. D Kaplan–Meier analysis of the relationship between FSTL3 expression level and overall survival of patients from the GSE91061 and PMID29301960 cohorts. E The correlation between FSTL3 expression and CD8+ T cells infiltration in colon and rectal adenocarcinoma tissues. F The correlation between FSTL3 expression and Tregs infiltration in colon and rectal adenocarcinoma tissues. G Representative images of FSTL3, CD8 and Foxp3 staining in high versus low FSTL3 expression CRC tissues. Data are shown as mean ± SD. *P < 0.05.
Fig. 8
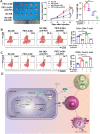
Fig. 8. Hyper-expressed FSTL3 resists the antitumor efficacy of anti-PD1 therapy in vivo.
The mice were injected subcutaneously with NC-OE or FSTL3-OE MC38 cells to establish tumor models, and then treated with anti-PD1 antibody. A Tumor images, growth curves and weight were obtained at day 14 after dissection. B Flow cytometry analysis of CD8+ T cells in tumor tissues of C57BL/6 J mice in each group. C Flow cytometry analysis of Tregs in tumor tissues of C57BL/6 J mice in each group. D Schematic diagram of the concrete function and mechanism of FSTL3 in the CRC microenvironment. Data are shown as mean ± SD. *P < 0.05, **P < 0.01, ***P < 0.001, ns non-significant.

Similar articles

Cited by

References

    1. Sung H, Ferlay J, Siegel RL, Laversanne M, Soerjomataram I, Jemal A, et al. Global cancer statistics 2020: GLOBOCAN estimates of incidence and mortality worldwide for 36 cancers in 185 countries. CA Cancer J Clin. 2021;71:209–49. doi: 10.3322/caac.21660. - DOI - PubMed
    1. Weng J, Li S, Zhu Z, Liu Q, Zhang R, Yang Y, et al. Exploring immunotherapy in colorectal cancer. J Hematol Oncol. 2022;15:95. doi: 10.1186/s13045-022-01294-4. - DOI - PMC - PubMed
    1. Thol K, Pawlik P, Mcgranahan N. Therapy sculpts the complex interplay between cancer and the immune system during tumour evolution. Genome Med. 2022;14:137. doi: 10.1186/s13073-022-01138-3. - DOI - PMC - PubMed
    1. Ganesh K. Optimizing immunotherapy for colorectal cancer. Nat Rev Gastroenterol Hepatol. 2022;19:93–4. doi: 10.1038/s41575-021-00569-4. - DOI - PMC - PubMed
    1. Marcus L, Lemery SJ, Keegan P, Pazdur R. FDA approval summary: pembrolizumab for the treatment of microsatellite instability-high solid tumors. Clin Cancer Res. 2019;25:3753–8. doi: 10.1158/1078-0432.CCR-18-4070. - DOI - PubMed

Publication types