. 2024 Feb 6;121(6):e2313185121.
doi: 10.1073/pnas.2313185121. Epub 2024 Feb 1.

A macrophage-collagen fragment axis mediates subcutaneous adipose tissue remodeling in mice

Affiliations

A macrophage-collagen fragment axis mediates subcutaneous adipose tissue remodeling in mice

Milica Vujičić et al. Proc Natl Acad Sci U S A. .

Abstract

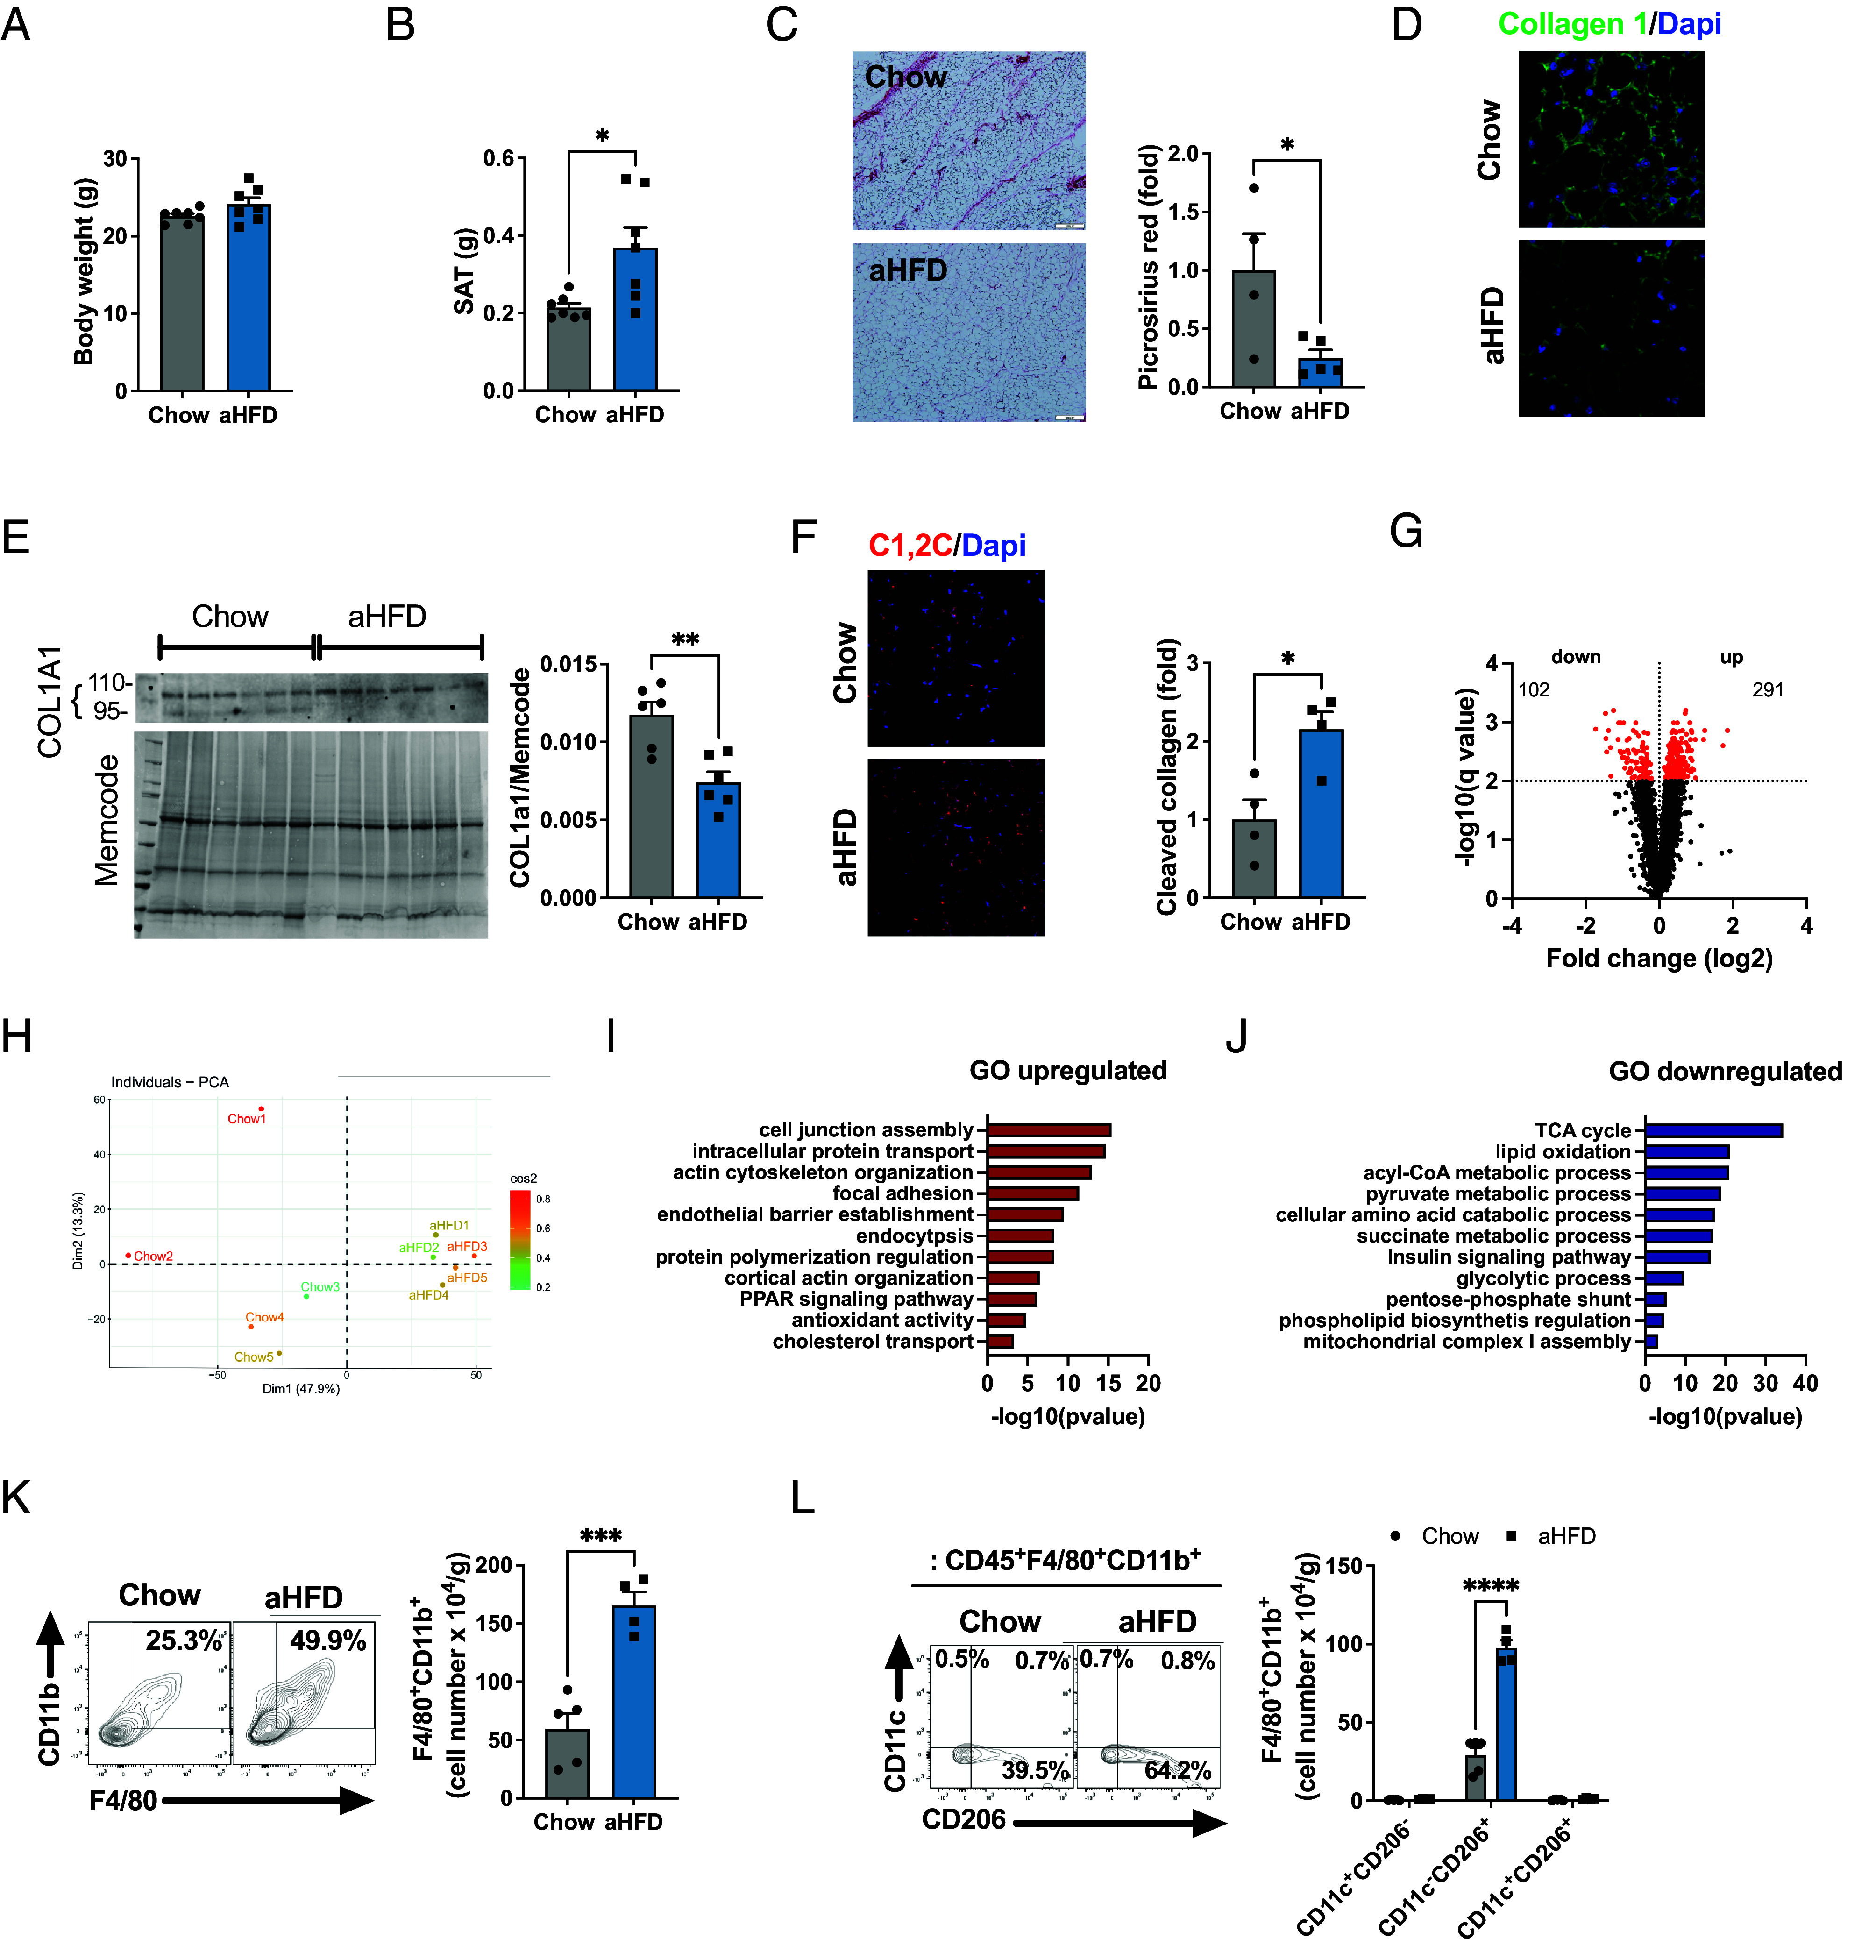
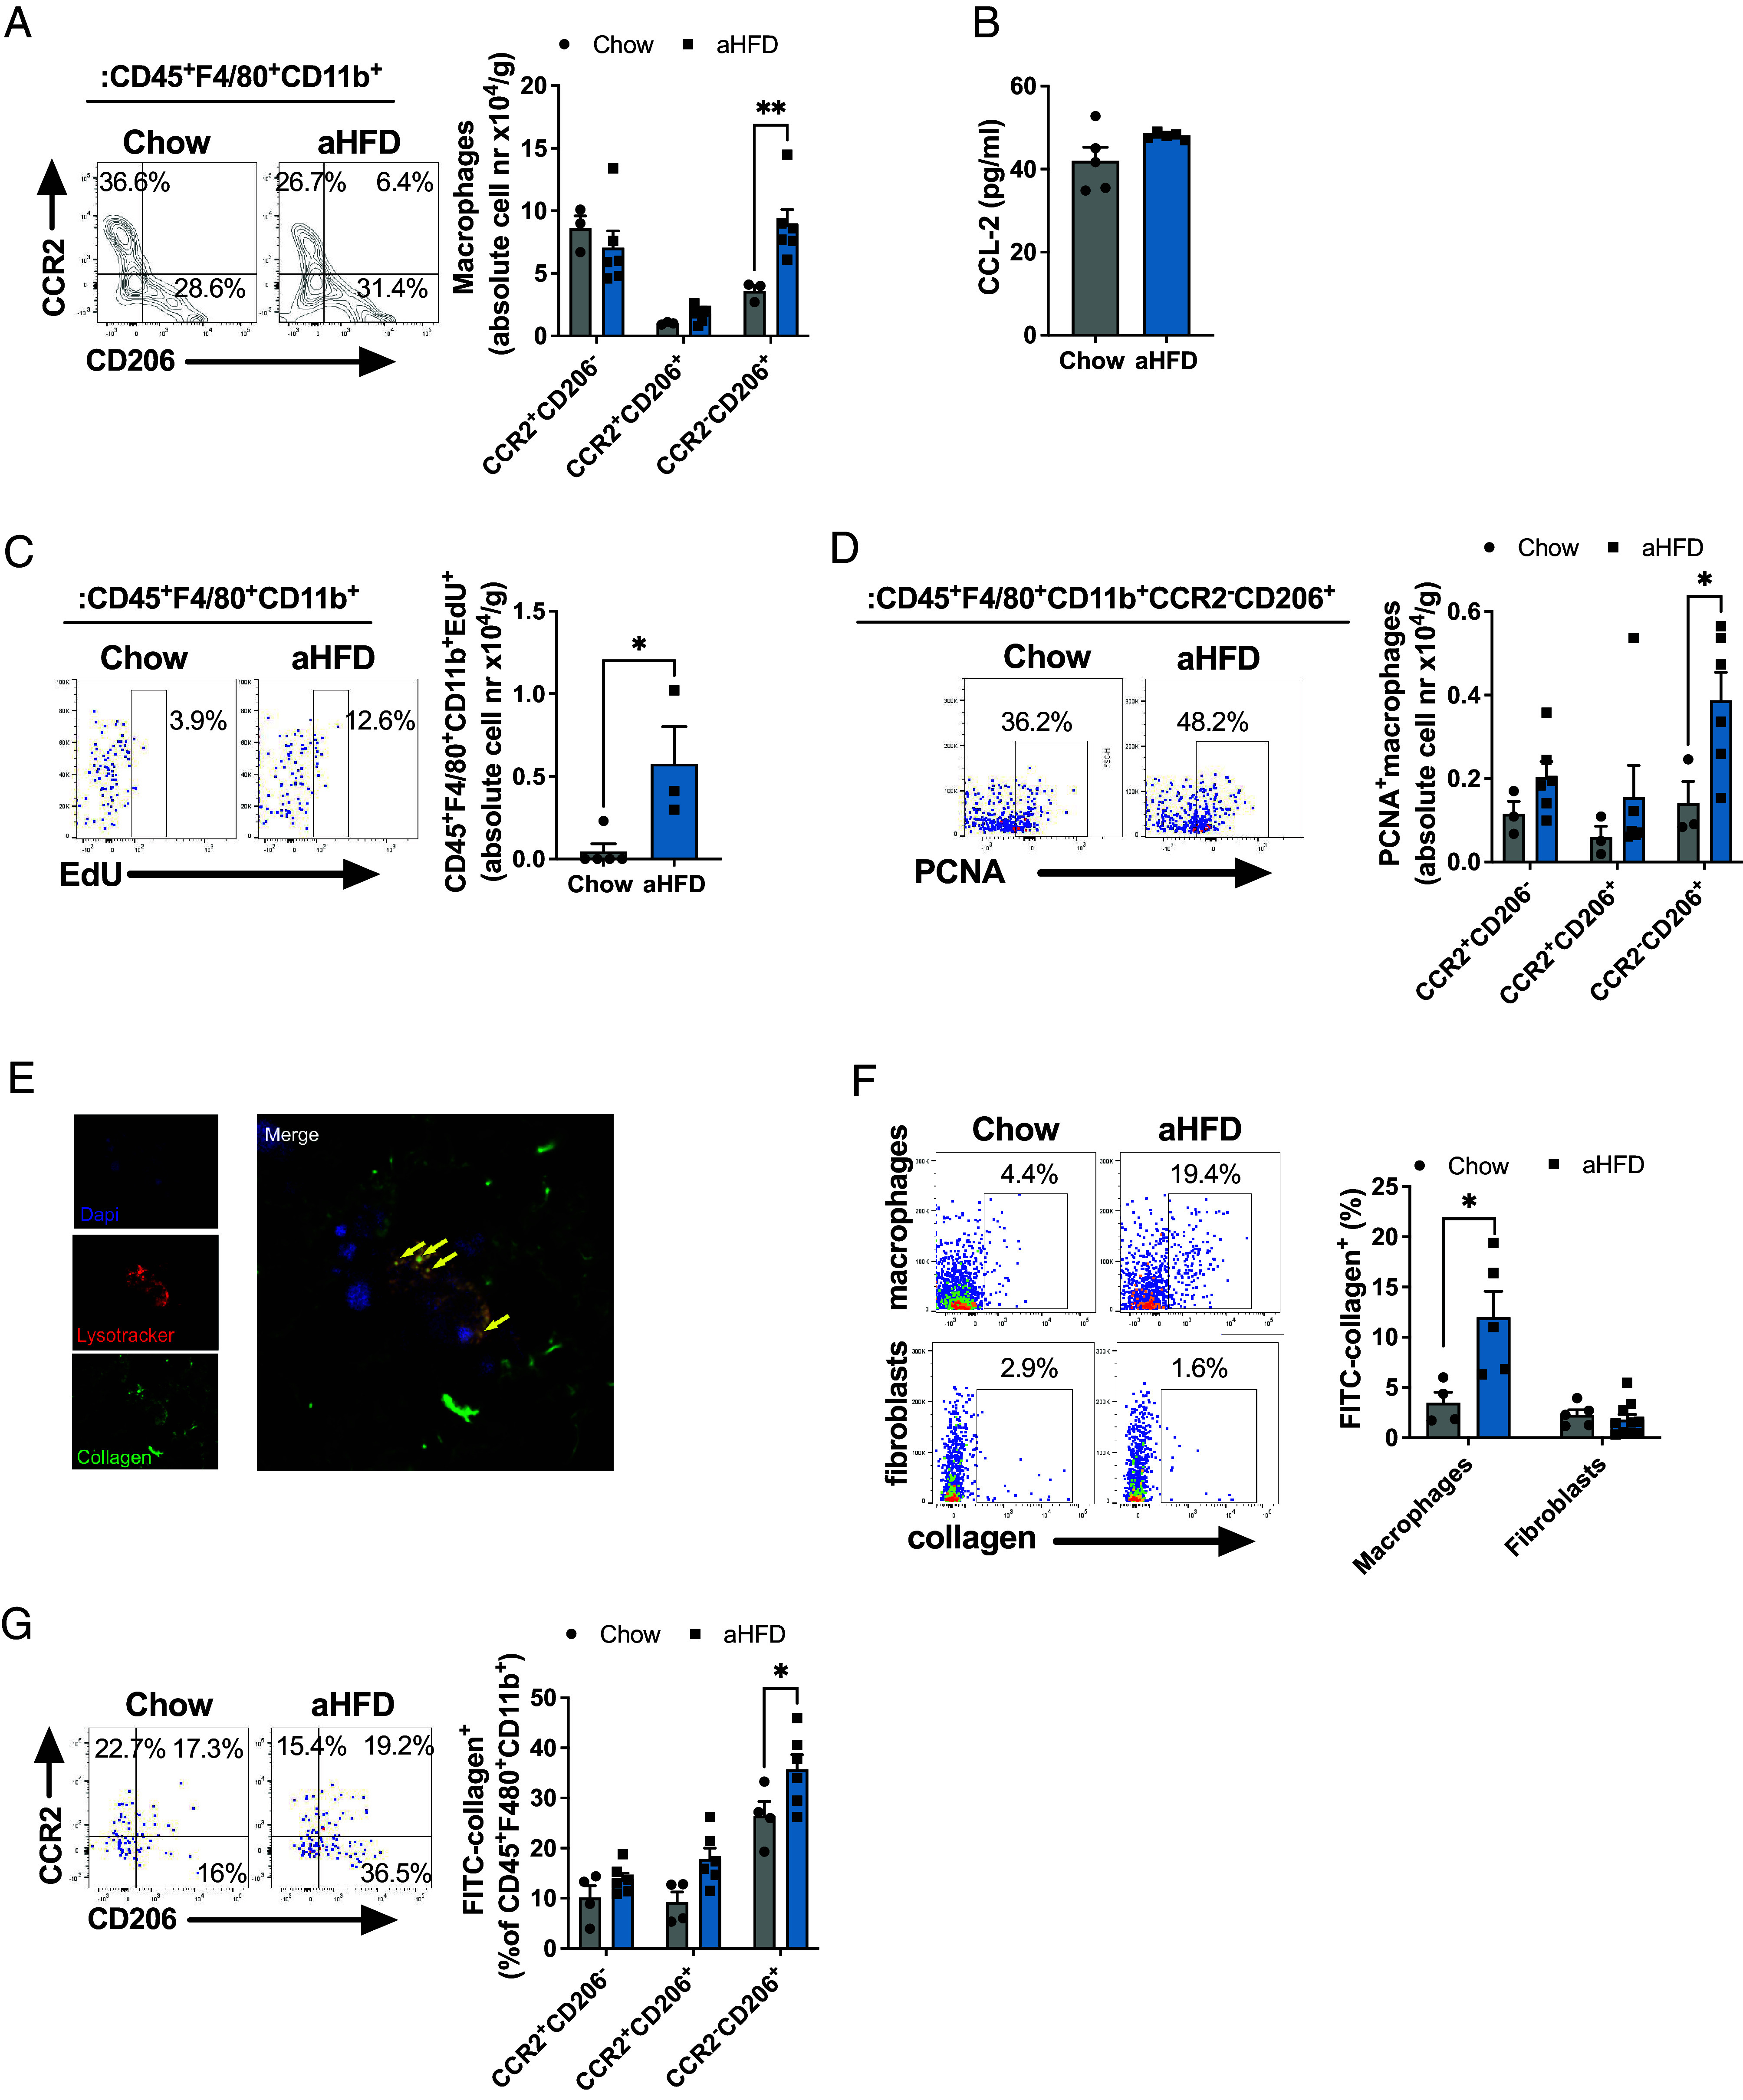
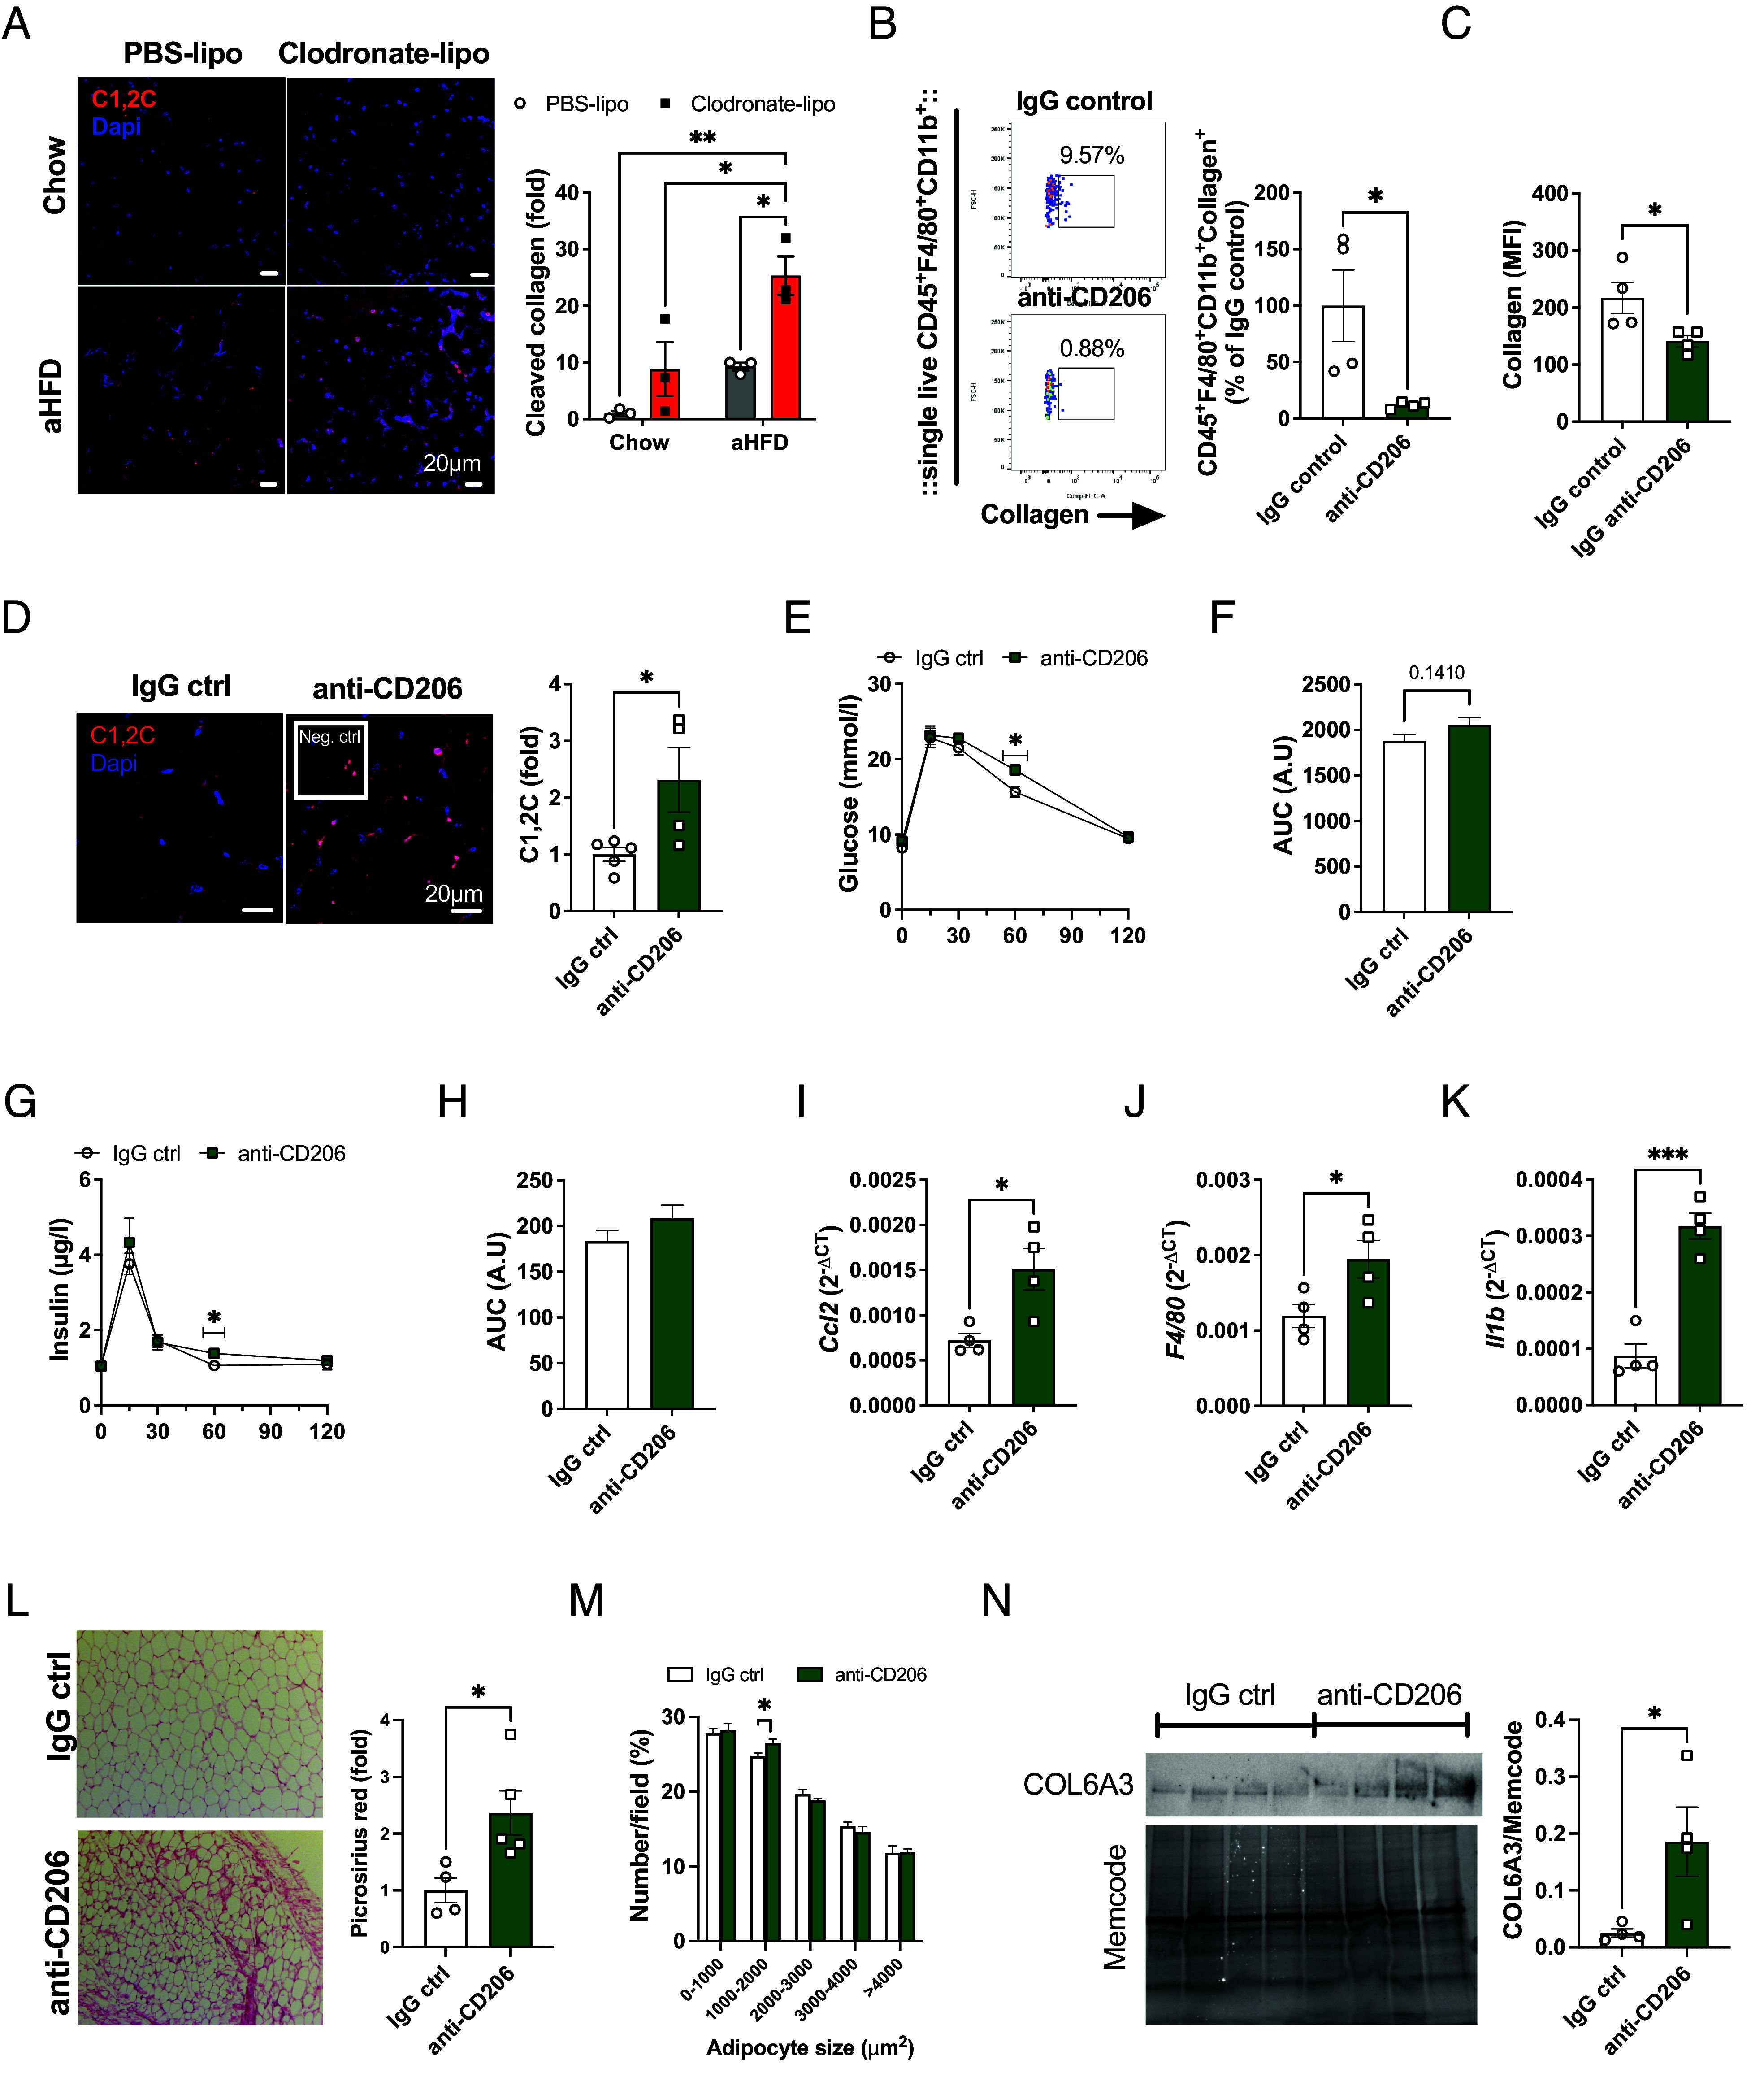
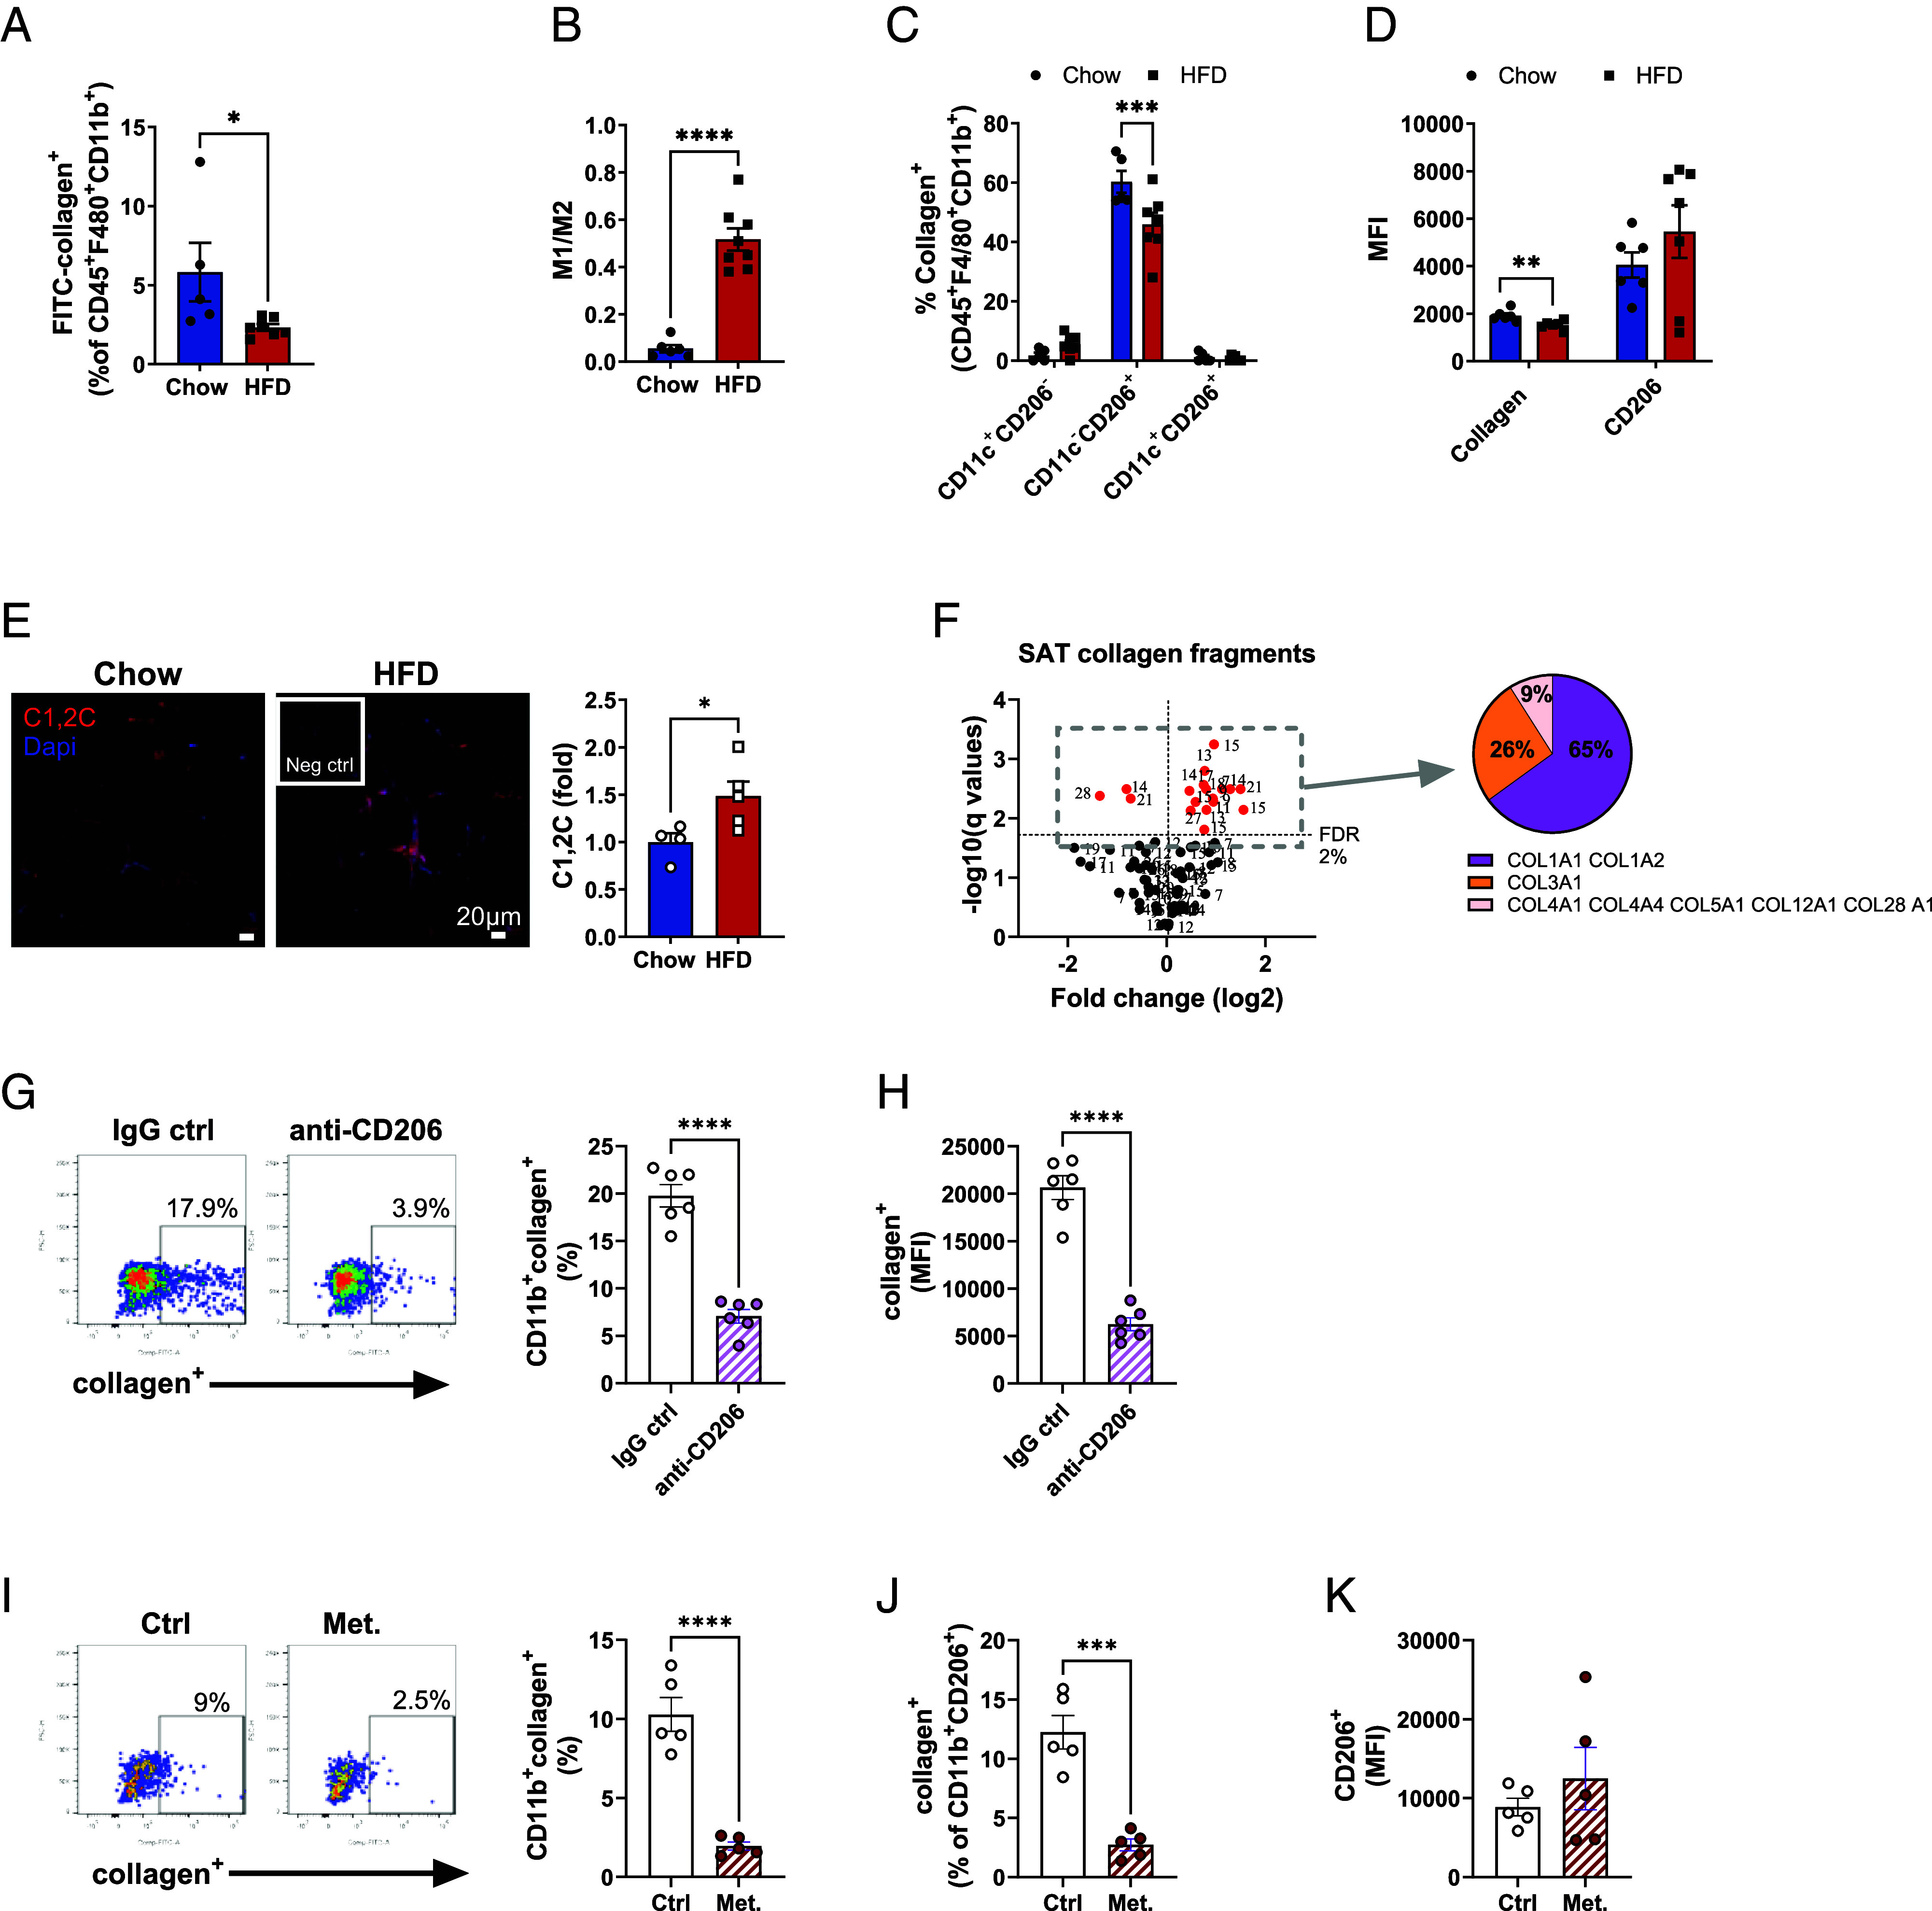
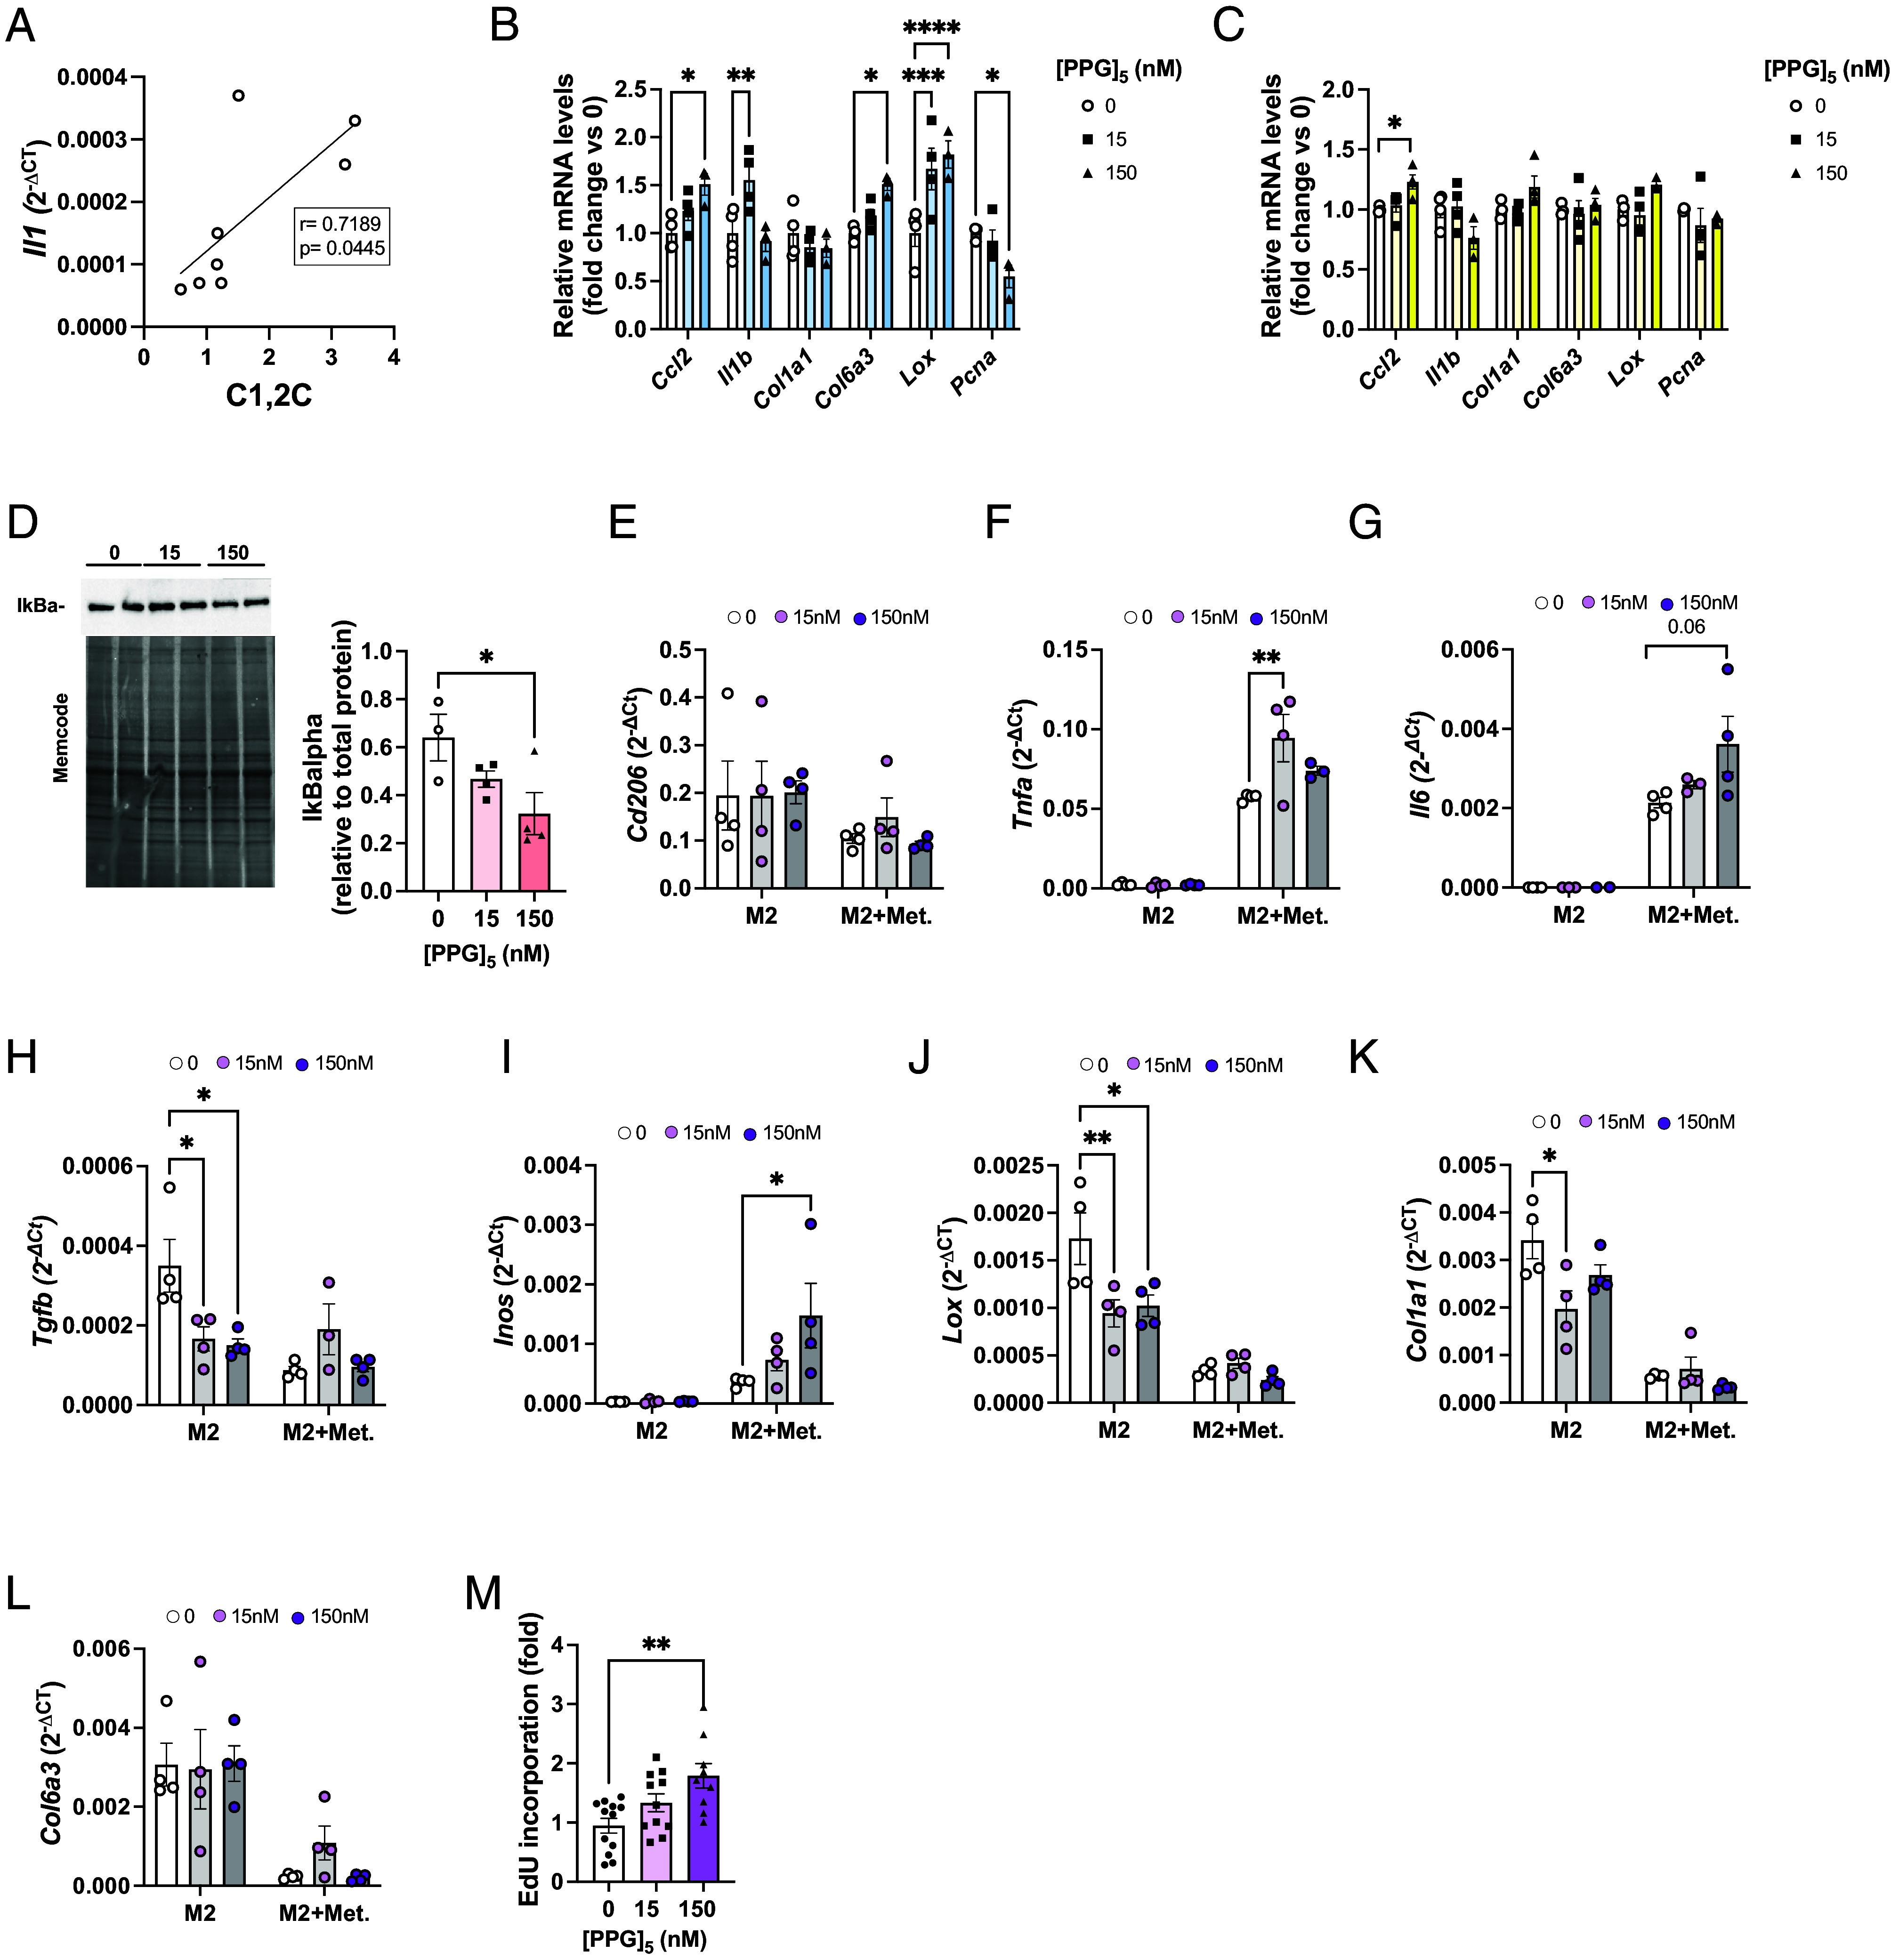
Efficient removal of fibrillar collagen is essential for adaptive subcutaneous adipose tissue (SAT) expansion that protects against ectopic lipid deposition during weight gain. Here, we used mice to further define the mechanism for this collagenolytic process. We show that loss of collagen type-1 (CT1) and increased CT1-fragment levels in expanding SAT are associated with proliferation of resident M2-like macrophages that display increased CD206-mediated engagement in collagen endocytosis compared to chow-fed controls. Blockage of CD206 during acute high-fat diet-induced weight gain leads to SAT CT1-fragment accumulation associated with elevated inflammation and fibrosis markers. Moreover, these SAT macrophages' engagement in collagen endocytosis is diminished in obesity associated with elevated levels collagen fragments that are too short to assemble into triple helices. We show that such short fragments provoke M2-macrophage proliferation and fibroinflammatory changes in fibroblasts. In conclusion, our data delineate the importance of a macrophage-collagen fragment axis in physiological SAT expansion. Therapeutic targeting of this process may be a means to prevent pathological adipose tissue remodeling, which in turn may reduce the risk for obesity-related metabolic disorders.

Keywords: CD206; collagen; fibrosis; macrophages; subcutaneous adipose tissue.


Conflict of interest statement

Competing interests statement:The authors declare no competing interest.

Figures

Fig. 1.
Fig. 1.
Acute challenge with 1-wk HFD leads to SAT CT1 degradation and accumulation of M2-like macrophages. (A) Body and (B) SAT weight of 8 wk old male C57BL/6N chow and aHFD mice (n = 7/group). (C) Representative image and quantification of picrosirius red staining on SAT of chow (n = 4) and aHFD mice (n = 5). For each animal, images were collected from more than six random fields. Data are presented as fold change compared to chow mice (scale bar, 100 µm). (D) Representative image of immunohistofluorescent CT1 staining (green) in SAT of chow and aHFD mice. Nuclei were stained with Dapi (blue, scale bar, 20 µm). (E) Western blot analysis of COL1A1 in SAT of chow and aHFD mice (n = 4/group). Band intensity was normalized to total protein amount on the membrane. (F) Representative image and quantification of cleaved CT1 in SAT of chow and aHFD mice (n = 4/group). Cleaved CT1 was stained with C1,2C antibody (red) and nuclei were stained with Dapi (blue, scale bar, 20 µm). For each group, tiled (5 x 5) images were taken from at least 3 random fields. Data are presented as fold change compared to control mice. (G) Volcano plot and (H) PCA of differentially abundant proteins in SAT of chow and aHFD mice (n = 5/group), detected and quantified by LC-MS/MS using TMT multiplexing. Pathway enrichment analysis of (I) up-regulated and (J) down-regulated proteins in SAT of aHFD mice relative to chow controls. Analysis was done in Cytoscape with GO:Biological process database. (K) Representative dot plot and number of macrophages (single live CD45+F4/80+CD11b+) per gram of SAT from chow (n = 5) and aHFD (n = 4) mice. (L) Representative dot plot and number of macrophage (single live CD45+F4/80+CD11b+) subsets (M1-like=CD11c+CD206, M2-like=CD11cCD206+ and mixed M1-M2=CD11c+CD206+) per gram of SAT from chow (n = 5) and aHFD (n = 4) mice. Data are presented as mean ± SEM. Data are representative of at least three independent experiments (AF, K, and L). Unpaired student’s t tests (A, B, G, I, J, and K), 2-way ANOVA with Fisher’s post hoc test (L). Multiple unpaired t test with Welch correction, corrected with false discovery rate set to 1% cut-off (q value above 2 is significant). *P < 0.05, ***P < 0.001.
Fig. 2.
Fig. 2.
Acute HFD drives proliferation of SAT resident macrophages that engage in collagen endocytosis. (A) Representative dot plot and number of infiltrated (CCR2+CD206 and CCR2+CD206+) and resident (CCR2CD206+) macrophages (single live CD45+F4/80+CD11b+) per gram of SAT from chow (n = 7, some samples pooled) and aHFD (n = 6) mice. (B) Serum levels of CCL-2 from chow (n = 5) and aHFD mice (n = 4). (C) Representative dot plot and number of proliferating (EdU+) macrophages (single live CD45+F4/80+CD11b+) per gram of SAT from chow (n = 5) and aHFD (n = 4) mice. (D) Representative dot plot and number of PCNA+ total (single live CD45+F4/80+CD11b+), infiltrated (CCR2+CD206 and CCR2+CD206+ of total), and resident (CCR2CD206+ of total) macrophages per gram of SAT of chow (n = 7, some samples pooled) and aHFD (n = 7) mice. (E) Representative image of collagen-endocytosing macrophages. Ex vivo sorted macrophages (F4/80+ SVF of SAT) where immersed in neutralized FITC-collagen and left to polymerize. Collagen (green) forms the fibers similar to in vivo settings. Lysosomes were stained with Lysotracker red (red). Nuclei were stained with Dapi (blue). Macrophages endocytose collagen which can be noted as co-localization of green (collagen) and red (lysosomes) signal. (F) Collagen endocytosis assay. Frequencies of FITC-collagen+ macrophages (single live CD45+F4/80+CD11b+) and fibroblasts (single live CD45-PDGRFα+) from SAT of chow and aHFD mice (n = 10/group). Cells were magnetically sorted (macrophages: F4/80+ of SVF, fibroblasts: F4/80CD45CD90.2+ of SVF). (G) Collagen endocytosis assay- subset distribution of collagen endocytosing macrophages. Frequencies of FITC-collagen+ infiltrated (CCR2+CD206 and CCR2+CD206+) and resident (CCR2CD206+) macrophages (single live CD45+F4/80+CD11b+). Data are presented as mean ± SEM and are representative of two or more independent experiments. Unpaired student’s t tests (B, C, and F), two-way ANOVA with Fisher’s post hoc test (A, D, and G). *P < 0.05, **P < 0.01
Fig. 3.
Fig. 3.
CT1 endocytosis in SAT macrophages is mediated by CD206 receptor. (A) Representative images and quantification of C1,2C staining in SAT. Chow and aHFD mice received Clodronate-liposomes (40 mg/kg bw) into one SAT fat pad and control PBS-liposomes into another fat pad on day 0 and day 3 of aHFD course (n = 3/group). Cleaved CT1 was stained with C1, 2C antibody (red) and nuclei were stained with Dapi (blue, scale bar, 20 µm). For each group, tiled (5 x 5) images were taken from at least three random fields. Data are presented as fold change compared to chow PBS SAT. (B and C) Representative dot plots and quantification of ex vivo collagen endocytosis assay in the presence of neutralizing anti-CD206 antibody or IgG control (n = 4/group). SAT-macrophages from lean mice were magnetically sorted (F4/80+) and treated with FITC-collagen (15 µg/mL) in the presence of anti-CD206 antibody or IgG control (10 µg/mL). Collagen+ macrophages as (B) % of total macrophages and (C) collagen uptake per cell, measured as MFI values. (DN) In vivo antibody-mediated CD206 neutralization. Mice were treated with anti-CD206 or IgG control (1 mg/kg) antibody every other day during the aHFD-challenge. (D) Representative images and quantification of C1,2C (red) staining in SAT of IgG- (n = 4) or anti-CD206-treated (n = 5) aHFD mice. Nuclei were stained with Dapi (blue, scale bar, 20 µm). Data are presented as a fold change of IgG control. (E) Blood glucose levels and (F) area under the curve (AUC) during oral glucose tolerance test (OGTT, n = 5/group). (G) Serum insulin levels and (H) AUC during OGTT (n = 5/group). mRNA expression of (I) Ccl2 (J) F4/80, and (K) Il1 in SAT of anti-CD206 or IgG-treated mice (n = 4/group). Expression is relative to Bactin. (L) Representative images and quantification of picrosirius red staining in SAT of anti-CD206 or IgG-treated mice (n = 4 to 5). For each sample, images were collected from more than six random fields. Data are presented as fold change compared to IgG control SAT (scale bar, 100 µm). (M) Adipocyte size distribution and (N) average adipocyte size calculated from the picrosirius red staining with ImageJ software and Adiposoft plugin. (O) Western blot analysis of COL6A3 in SAT of anti-CD206 or IgG-treated mice (n = 4/group). Band intensity was normalized to total protein amount on the membrane. Data are presented as mean ± SEM and are representative of two independent experiments (AC). Unpaired student’s t tests, two-way ANOVA (A and M). *P < 0.05, **P < 0.01
Fig. 4.
Fig. 4.
Macrophage-collagen axis is disrupted in SAT of obese insulin resistant mice. (AF) Male C57BL/6 mice were placed on chow or HFD for 14 wk. (A) Percentage of collagen+ macrophages (single live CD45+F4/80+CD11b+) magnetically sorted from SAT of chow (n = 6) or mice fed with HFD (n = 8). (B) M1/M2 ratio in SAT of chow and HFD mice. M1 macrophages were defined as CD11c+CD206 and M2 as CD11cCD206+ of total macrophages (single live CD45+F4/80+CD11b+). (C) Subset distribution of collagen+ macrophages. (D) Mean fluorescence intensity of collagen+ and CD206+ macrophages. (E) Representative images and quantification of C1,2C staining (red) in SAT of chow (n = 4) and HFD (n = 5) mice. Nuclei were stained with Dapi and data are presented as fold change of chow controls (scale bar, 20 µm). (F) Volcano plot of various fragmented collagens found in SAT of chow and HFD mice (n = 5/group). The number indicates amino acid length of each fragment (sequences are shown in SI Appendix, Table S1). Collagen+ human PBMC-derived M2-like macrophages (live CD3CD19CD56CD66bCD1cCD11b+CD206+) in the presence of (GH) anti-CD206 antibody or IgG control (10 µg/mL both) or (IJ) in the presence or absence of metabolic cocktail (25 mM glucose, 0.5 mM palmitate-BSA, 10 nM insulin). MFI values of (H) collagen and (K) CD206. Data are presented as mean ± SEM. Unpaired student’s t tests, two-way ANOVA (C), and multiple unpaired t test with Welch correction, corrected with false discovery rate set to 2% cut-off (F). *P < 0.05, **P < 0.01, ***P < 0.001, ****P < 0.0001
Fig. 5.
Fig. 5.
Collagen fragments induce inflammation and fibrosis in pre- and adipocytes, but proliferation in M2-like macrophages. (A) Pearson correlation of mRNA expression of Il1 and the amount of collagen fragments in the SAT of mice treated with anti-CD206 or IgG control. mRNA expression (relative to untreated cells) after in vitro treatment of (B) 3T3-L1 fibroblasts and (C) differentiated 3T3-L1 adipocytes. (D) Western blot analysis of IkBalpha in 3T3-L1 pre-adipocytes after 24 h treatment with [PPG]5. Band intensity was normalized to total protein amount on the membrane. (EL) mRNA expression in M2 BMD macrophages after 24 h treatment with [PPG]5 (n = 3 to 4 per group) in the presence or absence of metabolic cocktail (25 mM glucose, 0.5 mM palmitate-BSA, 10 nM insulin). Expression is relative to Bactin. (M) EdU incorporation in M2 BMD macrophages after 24 h treatment with collagen mimetic peptide (15 and 150 nM, n = 9 to 12/group). Data are presented as mean ± SEM and are representative of three independent experiments (AD). One significant outlier value was detected with Grubb’s outlier test (P < 0.05) and removed (F and G). One-way (BD and M) and two-way (EL) ANOVA. *P < 0.05, **P < 0.01.

Similar articles

Cited by

References

    1. Smith U., Kahn B. B., Adipose tissue regulates insulin sensitivity: Role of adipogenesis, de novo lipogenesis and novel lipids. J. Intern. Med. 280, 465–475 (2016). - PMC - PubMed
    1. Schoettl T., Fischer I. P., Ussar S., Heterogeneity of adipose tissue in development and metabolic function. J. Exp. Biol. 221, jeb162958 (2018). - PubMed
    1. Mori S., Kiuchi S., Ouchi A., Hase T., Murase T., Characteristic expression of extracellular matrix in subcutaneous adipose tissue development and adipogenesis; comparison with visceral adipose tissue. Int. J. Biol. Sci. 10, 825–833 (2014). - PMC - PubMed
    1. Divoux A., et al. , Fibrosis in human adipose tissue: Composition, distribution, and link with lipid metabolism and fat mass loss. Diabetes 59, 2817–2825 (2010). - PMC - PubMed
    1. Manka S. W., Bihan D., Farndale R. W., Structural studies of the MMP-3 interaction with triple-helical collagen introduce new roles for the enzyme in tissue remodelling. Sci. Rep. 9, 18785 (2019). - PMC - PubMed