

This is a preprint.
Single-cell morphodynamical trajectories enable prediction of gene expression accompanying cell state change
- PMID: 38293173
- PMCID: PMC10827140
- DOI: 10.1101/2024.01.18.576248
Single-cell morphodynamical trajectories enable prediction of gene expression accompanying cell state change
Abstract
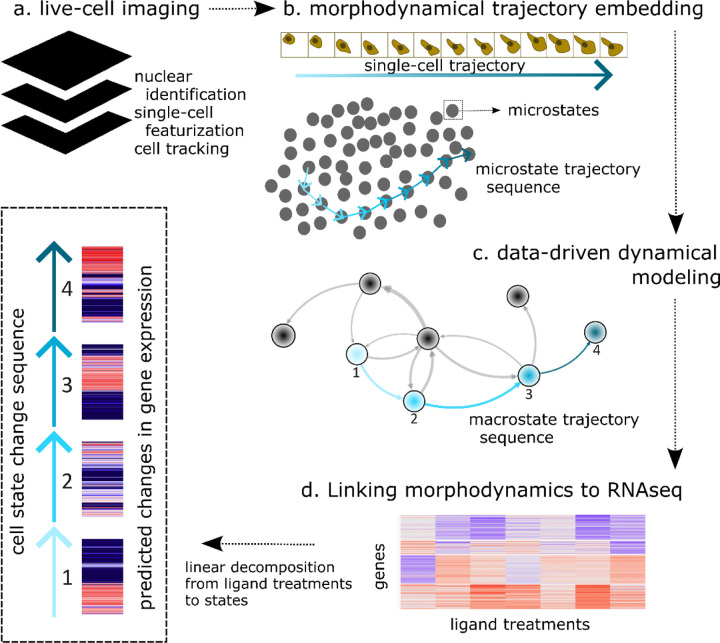
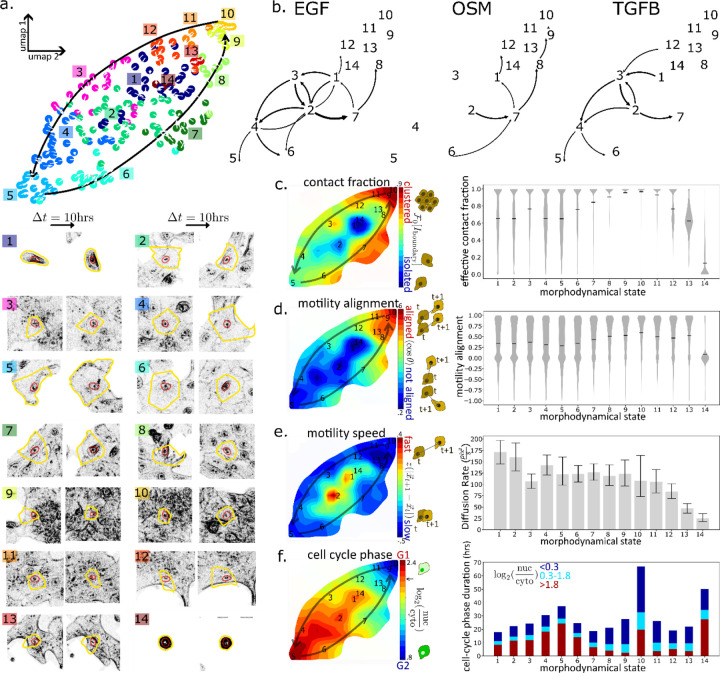
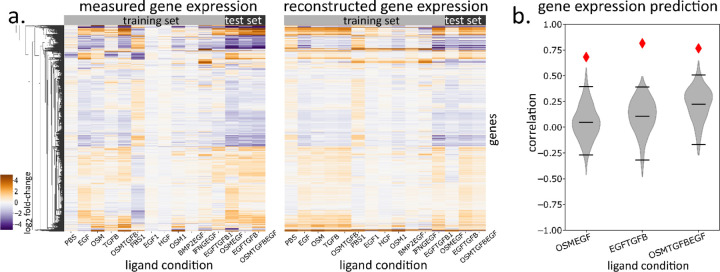
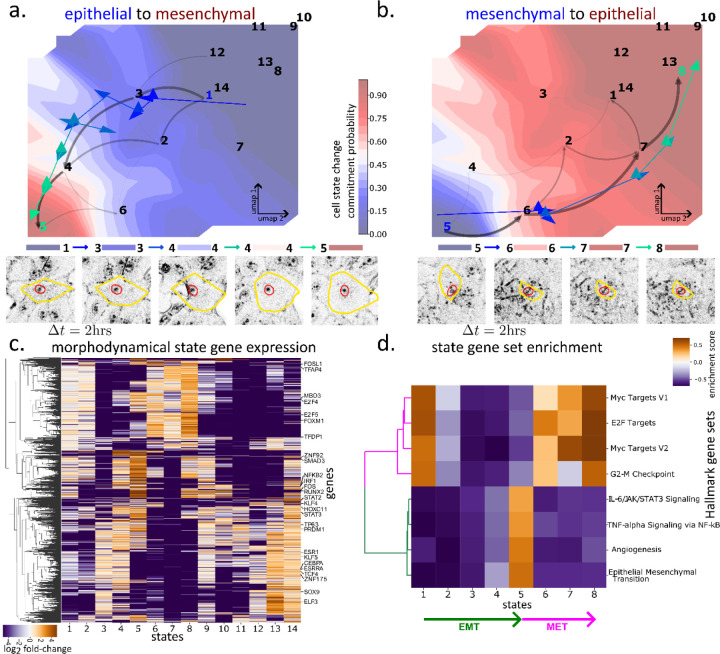
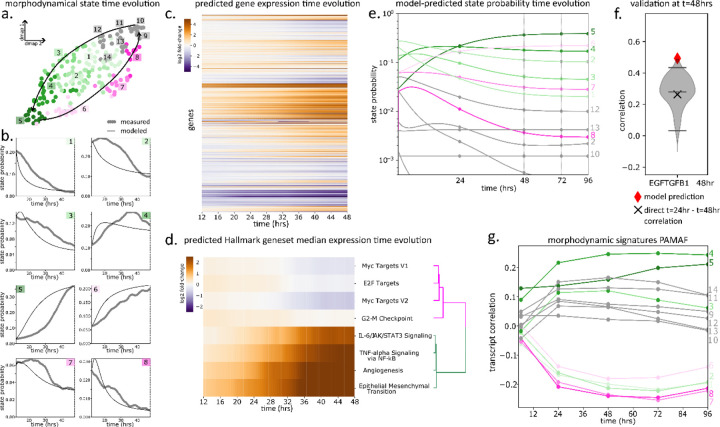
Extracellular signals induce changes to molecular programs that modulate multiple cellular phenotypes, including proliferation, motility, and differentiation status. The connection between dynamically adapting phenotypic states and the molecular programs that define them is not well understood. Here we develop data-driven models of single-cell phenotypic responses to extracellular stimuli by linking gene transcription levels to "morphodynamics" - changes in cell morphology and motility observable in time-lapse image data. We adopt a dynamics-first view of cell state by grouping single-cell trajectories into states with shared morphodynamic responses. The single-cell trajectories enable development of a first-of-its-kind computational approach to map live-cell dynamics to snapshot gene transcript levels, which we term MMIST, Molecular and Morphodynamics-Integrated Single-cell Trajectories. The key conceptual advance of MMIST is that cell behavior can be quantified based on dynamically defined states and that extracellular signals alter the overall distribution of cell states by altering rates of switching between states. We find a cell state landscape that is bound by epithelial and mesenchymal endpoints, with distinct sequences of epithelial to mesenchymal transition (EMT) and mesenchymal to epithelial transition (MET) intermediates. The analysis yields predictions for gene expression changes consistent with curated EMT gene sets and provides a prediction of thousands of RNA transcripts through extracellular signal-induced EMT and MET with near-continuous time resolution. The MMIST framework leverages true single-cell dynamical behavior to generate molecular-level omics inferences and is broadly applicable to other biological domains, time-lapse imaging approaches and molecular snapshot data.
Conflict of interest statement
Competing Interest The authors declare no competing interests.
Figures
Similar articles
-
Epithelial-to-mesenchymal transition proceeds through directional destabilization of multidimensional attractor.Elife. 2022 Feb 21;11:e74866. doi: 10.7554/eLife.74866. Elife. 2022. PMID: 35188459 Free PMC article.
-
Mapping lung cancer epithelial-mesenchymal transition states and trajectories with single-cell resolution.Nat Commun. 2019 Dec 6;10(1):5587. doi: 10.1038/s41467-019-13441-6. Nat Commun. 2019. PMID: 31811131 Free PMC article.
-
Cellular dynamics of EMT: lessons from live in vivo imaging of embryonic development.Cell Commun Signal. 2021 Jul 22;19(1):79. doi: 10.1186/s12964-021-00761-8. Cell Commun Signal. 2021. PMID: 34294089 Free PMC article. Review.
-
Population dynamics of EMT elucidates the timing and distribution of phenotypic intra-tumoral heterogeneity.iScience. 2023 Jun 5;26(7):106964. doi: 10.1016/j.isci.2023.106964. eCollection 2023 Jul 21. iScience. 2023. PMID: 37426354 Free PMC article.
-
Dynamical hallmarks of cancer: Phenotypic switching in melanoma and epithelial-mesenchymal plasticity.Semin Cancer Biol. 2023 Nov;96:48-63. doi: 10.1016/j.semcancer.2023.09.007. Epub 2023 Oct 1. Semin Cancer Biol. 2023. PMID: 37788736 Review.
References
-
- Tang F. et al. mRNA-Seq whole-transcriptome analysis of a single cell. Nat Methods 6, (2009). - PubMed
Publication types
Grants and funding
LinkOut - more resources
Full Text Sources
Miscellaneous