[Preprint]. 2024 Jan 15:2024.01.14.575614.
doi: 10.1101/2024.01.14.575614.

Genome scale CRISPR screens identify actin capping proteins as key modulators of therapeutic responses to radiation and immunotherapy

Affiliations

Genome scale CRISPR screens identify actin capping proteins as key modulators of therapeutic responses to radiation and immunotherapy

Nipun Verma et al. bioRxiv. .

Abstract

Radiotherapy (RT), is a fundamental treatment for malignant tumors and is used in over half of cancer patients. As radiation can promote anti-tumor immune effects, a promising therapeutic strategy is to combine radiation with immune checkpoint inhibitors (ICIs). However, the genetic determinants that impact therapeutic response in the context of combination therapy with radiation and ICI have not been systematically investigated. To unbiasedly identify the tumor intrinsic genetic factors governing such responses, we perform a set of genome-scale CRISPR screens in melanoma cells for cancer survival in response to low-dose genotoxic radiation treatment, in the context of CD8 T cell co-culture and with anti-PD1 checkpoint blockade antibody. Two actin capping proteins, Capza3 and Capg, emerge as top hits that upon inactivation promote the survival of melanoma cells in such settings. Capza3 and Capg knockouts (KOs) in mouse and human cancer cells display persistent DNA damage due to impaired homology directed repair (HDR); along with increased radiation, chemotherapy, and DNA repair inhibitor sensitivity. However, when cancer cells with these genes inactivated were exposed to sublethal radiation, inactivation of such actin capping protein promotes activation of the STING pathway, induction of inhibitory CEACAM1 ligand expression and resistance to CD8 T cell killing. Patient cancer genomics analysis reveals an increased mutational burden in patients with inactivating mutations in CAPG and/or CAPZA3, at levels comparable to other HDR associated genes. There is also a positive correlation between CAPG expression and activation of immune related pathways and CD8 T cell tumor infiltration. Our results unveil the critical roles of actin binding proteins for efficient HDR within cancer cells and demonstrate a previously unrecognized regulatory mechanism of therapeutic response to radiation and immunotherapy.


Figures

Figure 1.
Figure 1.. Genome-wide B16F10 CRISPR Screen identifies that inactivation of actin capping proteins, Capg and Capza3, promotes B16F10 survival following radiation and co-culture with anti-PD1 antibody and CD8 cytotoxic T cells.
a, Schematic of the B16F10 genome-scale CRISPR KO screen is shown on the left. Validation experiment of WT B16F10 and Capza3 KO B16F10 cell survival following co-culture with OT-I CD8+ T cells is shown on the right. b, Screen analysis plot (left) and top 6 gRNAs enriched (right) in surviving B16F10 cells after low-dose radiation (1 Gy) treatment and co-culture with CD8 cytotoxic T cells. Results shown are from 2 biologic repeats of the screen. c, Screen analysis plot (left) and top 6 gRNAs enriched (right) in surviving B16F10 cells after low-dose radiation (1 Gy) treatment and anti-PD1 antibody treatment during co-culture with CD8 cytotoxic T cells. Results shown are from 2 biologic repeats of the screen. d, Screen analysis plot (left) and top 6 gRNAs enriched (right) in surviving B16F10 cells after anti-PD1 antibody treatment during co-culture with CD8 cytotoxic T cells. Results shown are from 2 biologic repeats of the screen. e, Validation experiment of WT B16F10 and Capza3 KO B16F10 cell survival. Capza3 KO B16F10 cells were transduced with lentivirus containing the Capza3 targeting gRNA and a GFP reporter. Prior to transduction of B16F10 cells, some cells were isolated to be used as a WT control. Flow analysis of % GFP positive cells (B16F10 Cas9 cells transduced with lentivirus that contains the Capza3-targeting gRNA) following either: 1) co-culture with CD8 cytotoxic T cells or 2) treatment with low-dose radiation (1 Gy) and anti-PD1 antibody during co-culture with CD8 T cells. Representative plots are shown on the left and quantification is shown on the right. Significance testing was performed with two-way ANOVA. Validation experiments were performed using three biological replicates for each treatment condition. * p < 0.05, ** p < 0.01, *** p < 0.001, **** p < 0.0001.
Figure 2.
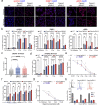
Figure 2.. B16F10 Capza3 KO cells show increased DNA damage after exposure to radiation.
a, Representative immunofluorescence staining of γH2AX (left), 53BP1 (middle) and phospho-RPA2 (pRPA, right) foci in WT and Capza3 KO cells at 6 hours and 24 hours after low-dose (1 Gy) radiation treatment. b, Quantification of γH2AX (left), 53BP1 (middle) and pRPA (right) foci in WT and Capza3 KO cells at different timepoints following low-dose (1 Gy) radiation treatment. Significance testing was performed with two-way ANOVA, three biological replicates were done for each sample and treatment condition. c, Quantification of total γH2AX foci in individual WT and Capza3 KO cells 24 hours after low-dose (1 Gy) radiation treatment. Significance testing was performed with one-way ANOVA, individual cell data from three biological replicates were pooled together for each sample. d, Quantification of γH2AX foci in WT and Capza3 KO cells 24 hours after exposure to different doses of radiation treatment. Significance testing was performed with two-way ANOVA, three biological replicates were done for every sample and treatment condition. e, Colony forming ability (CFA) of WT and Capza3 KO cells after exposure to different doses of radiation treatment. The survival fraction for each treatment was determined after normalization with the colony number seen in the no treatment control for each cell line. Significance testing was performed with two-way ANOVA, the p value for WT vs Capza3 gRNA 2 is shown in blue and the p value for WT vs Capza3 gRNA 3 is shown in red. Three biological replicates were done for each sample and treatment condition. f, Percent of WT and Capza3 KO cells that are Annexin V positive 24 hours after exposure to different doses of radiation. Significance testing was performed with two-way ANOVA, three biological replicates were done for each sample and treatment condition. g, CFA of WT and Capza3 KO cells after treatment with varying doses of Olaparib. The survival fraction for each treatment was determined after normalization with the colony number seen in no treatment control for each cell line. Significance testing was performed with two-way ANOVA, the p value for WT vs Capza3 gRNA 2 is shown in blue and the p value for WT vs Capza3 gRNA 3 is shown in red. Three biological replicates were done for each sample and treatment condition. h, Cell cycle analysis of WT and Capza3 KO cells during maintenance culture. Gating for G1, S and G2 are shown in the representative flow plots with quantification of proportion of cells in G1, S, and G2 phases in the graph below. Significance testing was performed with two-way ANOVA, the p value for WT vs Capza3 gRNA 2 is shown in blue and the p value for WT vs Capza3 gRNA 3 is shown in red. Three biological replicates were done for each sample. For all experiments, WT cells were transduced with a lentiviral vector expressing a NTC gRNA. * p < 0.05, ** p < 0.01, *** p < 0.001, **** p < 0.0001.
Figure 3.
Figure 3.. B16F10 Capza3 KO cells have impaired HDR compared to WT cells.
a, Schematic of extra-chromosomal reporters used to analyze efficiency of HDR and NHEJ in WT and Capza3 KO B16F10 cells. b, Quantification of luciferase activity, compared to WT cells, 48 hours after transfection with linearized HDR and NHEJ extrachromosomal reporters. Significance testing was performed with two-way ANOVA, Three biological replicates were done for each sample. P-values: WT vs. Capza3 gRNA 2 KO #1: 0.0071, WT vs Capza3 gRNA 2 KO #2: 0.0062, WT vs Capza3 gRNA 3 KO #1: <0.0001, WT vs Capza3 gRNA 3 KO #2: <0.0001. c, Schematic of laser micro-irradiation to induce DNA damage followed by fixation and staining with γH2AX at different time points to monitor dispersion of DNA damage foci following laser micro-irradiation. d, Representative immunofluorescence imaging of γH2AX DNA damage foci 1 minute and 20 minutes following laser micro-irradiation in WT and Capza3 KO cells. e, Quantification in individual cells of the ratio of intensity of γH2AX staining in the region of laser induced DNA damage versus outside this region, 1 minute and 20 minutes after laser micro-irradiation. Analysis was done using ImageJ. Significance testing was performed with two-way ANOVA, individual cell data from three biological replicates were pooled together for each sample. P-values: WT vs. Capza3 gRNA 2 KO #1: <0.0001, WT vs Capza3 gRNA 2 KO #2: 0.0024, WT vs Capza3 gRNA 3 KO #1: <0.0001, WT vs Capza3 gRNA 3 KO #2: 0.0087. f, Average intensity of γH2AX stripe in the region of laser induced DNA damage in WT and Capza3 KO cells at different time points after laser micro-irradiation. Significance testing was performed with two-way ANOVA, the average intensity from three biological replicates is shown. P-values: WT vs. Capza3 gRNA 2 KO #1: ns, WT vs Capza3 gRNA 2 KO #2: ns, WT vs Capza3 gRNA 3 KO #1: 0.0082, WT vs Capza3 gRNA 3 KO #2: 0.0157. g, 24 hours live cell imaging of WT and Capza3 KO cells with Hoechst staining and a H2B fluorescent reporter to monitor proportion of cells that show micronuclei formation following 1 Gy radiation treatment. Micronuclei formation was quantified in 10 representative fields of view. Cells with at least one micronuclei were considered positive. Significance testing was performed with one-way ANOVA, two replicates were done, with 10 fields quantified for each replicate. For all experiments, WT cells were transduced with a lentiviral vector expressing a NTC gRNA. * p < 0.05, ** p < 0.01, *** p < 0.001, **** p < 0.0001.
Figure 4.
Figure 4.. PANC1 and MDA-MB-231 CAPG and CAPZA3 KO cell lines show increased DNA damage following radiation treatment and impaired HDR.
a, Representative γH2AX immunofluorescence staining 24 hours after radiation treatment (5 Gy) in WT, CAPG and CAPZA3 KO PANCI and MDA-MB-231 cell lines. b, Quantification of γH2AX foci in WT, CAPG and CAPZA3 KO MDA-MB-231 (left) and PANC1 (right) cell lines 24 hours after different doses of radiation treatment. Significance testing was performed with two-way ANOVA, three biological replicates were done for each sample and treatment condition. c, Quantification of total γH2AX foci in individual cells in WT, CAPG and CAPZA3 KO MDA-MB-231 (left) and PANC1 (right) cell lines 24 hours after exposure to 5 Gy radiation. Significance testing was performed with one-way ANOVA, individual cell data from three biological replicates were pooled together for each sample. P-values are shown for comparisons of the KO line (CAPG KO or CAPZA3 KO) to WT. d, Quantification of luciferase activity, compared to WT cells, 48 hours after transfection with a linearized HDR extrachromosomal reporter. Significance testing was performed with one-way ANOVA. 4 biological replicates were done for the MDA-MB-231 and 6 biological replicates were done for the PANC1. MDA-MB-231 p-values: WT vs. CAPG KO #1: <0.0001, WT vs CAPG KO #2: 0.0012, WT vs CAPZA3 KO #1: <0.0001, WT vs CAPZA3 KO #2: <0.0001. PANC1 p-values: WT vs. CAPG KO #1: 0.0003, WT vs CAPG KO #2: <0.0001, WT vs CAPZA3 KO #1: 0.0011, WT vs CAPZA3 KO #2: <0.0001. e, CFA of WT, CAPG and CAPZA3 KO MDA-MB-231 (left) and PANC1 (right) cell lines after different doses of radiation treatment. Surviving fraction for each treatment was determined after normalization with the colony number seen in no treatment control for each cell line. Significance testing was performed with two-way ANOVA, the p value for WT vs CAPG KO is shown in blue and the p value for WT vs CAPZA3 KO is shown in red. Three biological replicates were done for each sample and treatment condition. f, Colony forming ability of WT, CAPG and CAPZA3 KO PANC1 cell lines after treatment with different doses of cisplatin. Surviving fraction for each treatment was determined after normalization with the colony number seen in no treatment control for each cell line. Significance testing was performed with two-way ANOVA, the p value for WT vs CAPG KO is shown in blue and the p value for WT vs CAPZA3 KO is shown in red. Four biological replicates were done for each sample and treatment condition. g, Representative flow plots of RFP positive and GFP positive cells 48 hours after transfection of Rosa26 gRNA into PANC1 AAVS1 traffic light reporter (TLR) cells: NT (WT not transfected), WT, CAPG and CAPZA3 KO cell lines. h, Quantification of GFP positive cells (left, % cells with successful HDR) and RFP positive cells (right, % cells with successful NHEJ) 24 and 48 hours after transfection of Rosa26 gRNA in PANC1 AAVS1 TLR WT, CAPG and CAPZA3 KO cell lines. Significance testing was performed with two-way ANOVA, four biological replicates were done for each sample. For all experiments, WT cells were passage-matched controls that underwent the procedure to generate KO cell lines (transfected with plasmid containing CAPG or CAPZA3 targeting gRNA, sorted as single cells into a 96 well plate and expanded) but did not have a mutation at either the CAPG or CAPZA3 locus. * p < 0.05, ** p< 0.01, *** p < 0.001, **** p < 0.0001.
Figure 5.
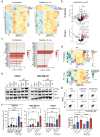
Figure 5.. B16F10 Capza3 KO cells and PANC1 CAPG/CAPZA3 KO cells show increased activation of the STING pathway and increased expression of CEACAM1 compared to WT cells.
a, Heat map shows differentially expressed genes between WT and Capza3 KO B16F10 cells before (left) and after (right) low-dose (1 Gy) radiation treatment from bulk RNA-Seq analysis of WT and Capza3 KO B16F10 cells. b, plot of genes differentially expressed between Capza3 KO and WT cells before radiation treatment (top) and after radiation treatment (bottom) from bulk RNA-Seq analysis of WT and Capza3 KO B16F10 cells. c, Analysis of transcription factor pathways that are significantly upregulated in Capza3 KO compared to WT B16F10 cells before (left) and after (right) low-dose (1 Gy) radiation treatment. Pathway activation confidence is depicted as a score from 0 to 1, representing the confidence of the relationship between the indicated gene and pathway. Analysis was done on bulk RNA-Seq data of WT and Capza3 KO B16F10 cells. d, Targets of the IRF1 transcription factor that showed the greatest upregulation in Capza3 KO compared to WT B16F10 cells before (top) and after (bottom) low-dose (1 Gy) radiation treatment. e, Western blot analysis of expression of STING pathway components in PANC1 (left) and MDA-MB-231 (right) WT, CAPG KO and CAPZA3 KO cell lines before and after low-dose (1 Gy) radiation treatment. f, qPCR analysis of CEACAM1 expression in B16F10 (left), MDA-MB-231 (middle) and PANC1 (right) WT and KO cell lines before and after low-dose (1 Gy) radiation treatment. Significance testing was performed with two-way ANOVA, three biological replicates were done for each sample and treatment condition. g, Representative flow plots of CEACAM1-488 staining in WT, CAPG KO and CAPZA3 KO PANC1 cell lines before and after low-dose (1 Gy) radiation treatment. Quantification of CEACAM1 positive cells is shown on the bottom. Significance testing was performed with two-way ANOVA, four biological replicates were done for each sample and treatment condition. For RNA-Seq analysis, n = 2 biologic replicates for each cell line (WT #1, WT #2, Capza3 gRNA 2 KO #1, Capza3 gRNA 2 KO #2, Capza3 gRNA 3 KO #1, Capza3 gRNA 3 KO #2) and each condition (no radiation or after 1 Gy radiation) for a total of 24 samples submitted for sequencing. For B16F10, WT cells were transduced with a lentiviral vector expressing a NTC gRNA. For PANC1 and MDA-MB-231 For all experiments, WT cells were passage-matched controls that underwent the procedure to generate KO cell lines (transfected with plasmid containing CAPG or CAPZA3 targeting gRNA, sorted as single cells into a 96 well plate and expanded) but did not have a mutation at either the CAPG or CAPZA3 locus. * p < 0.05, ** p < 0.01, *** p < 0.001, **** p < 0.0001.
Figure 6.
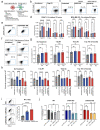
Figure 6.. PANC1 CAPG/CAPZA3 KO cells lose their survival advantage following co-culture with EGFR CAR-T after inactivation of CEACAM1 or with co-culture with anti-TIM3 antibody.
a, Schematic of co-culture experiments using MDA-MB-231 and PANC1 cell lines with EGFR CAR-T cells. Specific KO cell lines and different treatment conditions that were analyzed are shown. b, Representative flow plots of EGFR chimeric antigen receptor (CAR) Flag tag on EGFR CAR-T cells. c, Representative flow plots of EGFR expression in MDA-MB-231 and PANC1 cell lines. d, Analysis of cell survival after exposure to radiation and co-culture with EGFR CAR-T for WT, CAPG KO and CAPZA3 KO PANC1 (left) and MDA-MB-231 (right) cell lines. Significance testing was performed with two-way ANOVA, three biological replicates were done for each sample and treatment condition. e, Representative flow plot of CEACAM1 flow analysis in EGFR CAR-T cells during regular maintenance culture. f, Representative flow plots of inhibitory receptor expression on EGFR CAR-T during regular maintenance culture. g, Cell survival of PANC1 CAPG and CAPZA3 KO cell lines compared to WT cells following treatment with radiation and/or anti-TIM3 antibody and co-culture with EGFR CAR-T. Significance testing was performed with one-way ANOVA, three biological replicates were done for each sample. h, Cell survival of PANC1 KO cell lines (CEACAM1, CAPG and CAPZA3 single and double KO) compared to WT cells following treatment with radiation and/or anti-TIM3 antibody and co-culture with EGFR CAR-T. Significance testing was performed with two-way ANOVA, three biological replicates were done for each sample and treatment condition. i, Expression of PDL1 inhibitory ligand in WT, CAPG and CAPZA3 KO PANC1 cell lines following radiation treatment. Representative flow plots are shown on the left and quantification is shown on the right. Significance testing was performed with one-way ANOVA, four biological replicates were done for each sample. j, Cell survival of PANC1 WT, CAPG and CAPZA3 KO cell lines following treatment with radiation, anti-TIM3 antibody and anti-PD1 antibody and co-culture with EGFR CAR-T. Significance testing was performed with two-way ANOVA, all comparisons were made to the no radiation or antibody treatment control. WT p-values: No RT or Ab vs. RT: 0.1014, No RT or Ab vs. RT + TIM3 Ab: 0.1298, No RT or Ab vs. RT + PD1 Ab: 0.5644. CAPG KO p-values: No RT or Ab vs. RT: 0.9986, No RT or Ab vs. RT + TIM3 Ab: 0.0178, No RT or Ab vs. RT + PD1 Ab: 0.0279. CAPZA3 KO p-values: No RT or Ab vs. RT: 0.6799, No RT or Ab vs. RT + TIM3 Ab: 0.0032, No RT or Ab vs. RT + PD1 Ab: 0.0027. Three biological replicates were done for each sample and treatment condition. For all experiments, WT cells were passage-matched controls that underwent the procedure to generate KO cell lines (transfected with plasmid containing CAPG or CAPZA3 targeting gRNA, sorted as single cells into a 96 well plate and expanded) but did not have a mutation at either the CAPG or CAPZA3 locus. * p < 0.05, ** p< 0.01, *** p < 0.001, **** p < 0.0001.
Figure 7.
Figure 7.. TCGA data analysis of tumor mutational burden, CD8 T cell infiltration and overall survival in patients with inactivating mutations or low expression of CAPG, CAPZA3 and known HDR associated genes.
a, The statistical significance of the co-occurrence of CAPG/CAPZA3 mutations with other HDR genes mutations evaluated using Fisher’s exact test. b, Expression of CAPG (top) and CAPZA3 (bottom) in different cancer types. c, Analysis of tumor mutational burden in patients with an isolated inactivating mutation in CAPG or CAPZA3 or a mutation in a single HDR associated gene. P-values are shown for selected comparisons. Significance testing was performed with one-way ANOVA. d, Ranking of the correlation between CD8 T cell tumor infiltration and expression of genes within the genome are shown. Correlation was determined from the calculation of spearman correlation coefficient and ranges from +1 (left) to −1 (right). CAPG (blue), CAPZA3 (red) and other known HDR associated genes (black) are highlighted. e, Pathway-level alterations between patients with high and low expression of CAPG (top) and CAPZA3 (bottom) were estimated by comparing the gene expression profiles of patients in the top and bottom quantiles for CAPG. For CAPZA3, 50% of tumor samples in the TCGA dataset had a 0 expression value for CAPZA3 and so we compared the gene expression profiles of patients showing any expression of CAPZA3 compared to those that had a 0 expression value. f, Heat map of relationship between HDR gene expression and patient survival for different cancer types. HR is shown by the color of the circle. A HR >1 reflects that increased expression of the HDR gene is associated with poorer survival. Size of the circle indicates the p-value from Cox univariate regression analysis. g, Survival of patients stratified based on low versus high expression of CAPG or CAPZA3 in different cancer types. Significance was determined using Log Rank Test. h, Diagram of proposed mechanistic model.

Similar articles

References

    1. Atun R. et al. Expanding global access to radiotherapy. Lancet Oncol 16, 1153–1186 (2015). 10.1016/S1470-2045(15)00222-3 - DOI - PubMed
    1. Citrin D. E. Recent Developments in Radiotherapy. N Engl J Med 377, 2200–2201 (2017). 10.1056/NEJMc1713349 - DOI - PubMed
    1. Jackson S. P. & Bartek J. The DNA-damage response in human biology and disease. Nature 461, 1071–1078 (2009). 10.1038/nature08467 - DOI - PMC - PubMed
    1. Sirbu B. M. & Cortez D. DNA damage response: three levels of DNA repair regulation. Cold Spring Harb Perspect Biol 5, a012724 (2013). 10.1101/cshperspect.a012724 - DOI - PMC - PubMed
    1. Symington L. S. & Gautier J. Double-strand break end resection and repair pathway choice. Annu Rev Genet 45, 247–271 (2011). 10.1146/annurev-genet-110410-132435 - DOI - PubMed

Publication types