

DeepCORE: An interpretable multi-view deep neural network model to detect co-operative regulatory elements
- PMID: 38292477
- PMCID: PMC10825326
- DOI: 10.1016/j.csbj.2023.12.044
DeepCORE: An interpretable multi-view deep neural network model to detect co-operative regulatory elements
Abstract
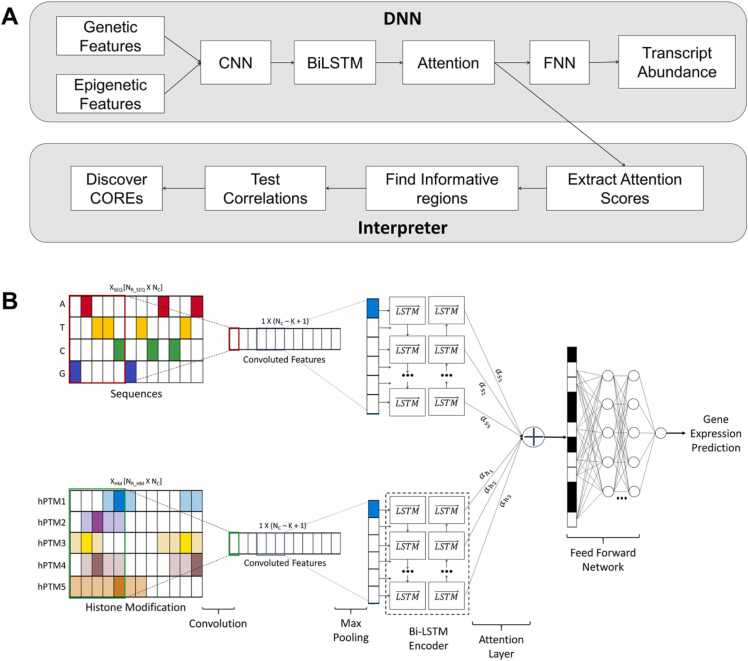
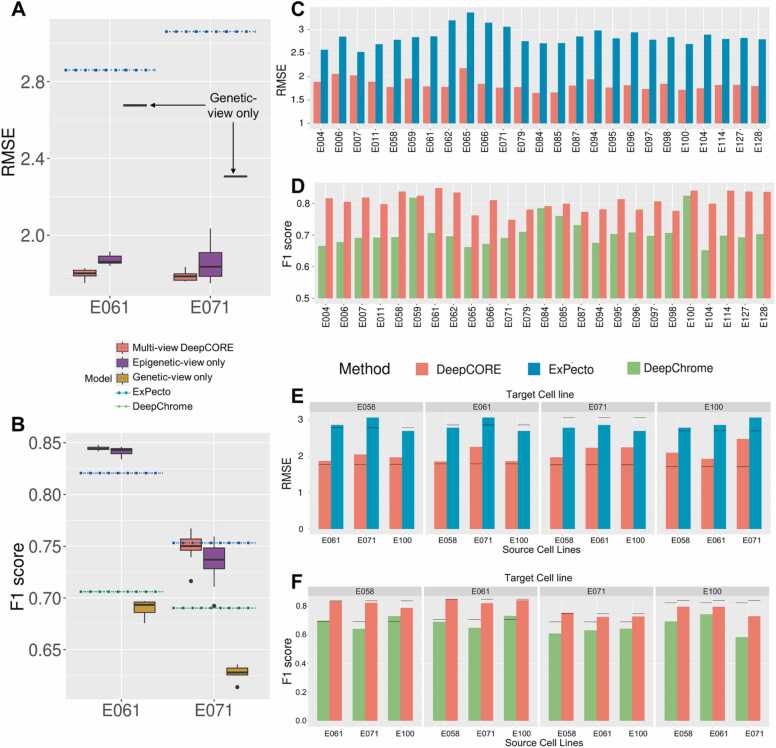
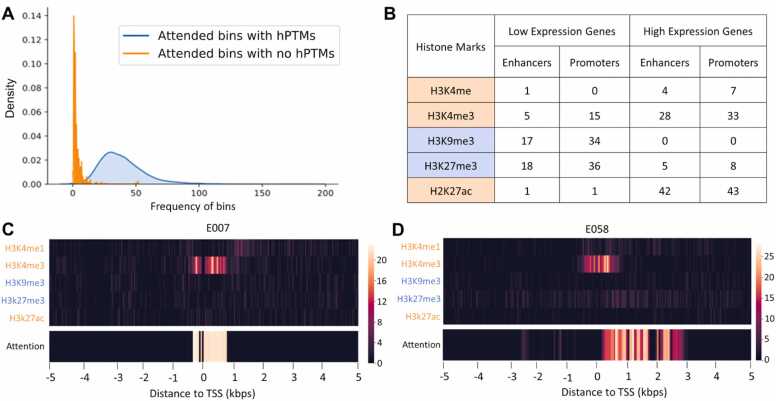
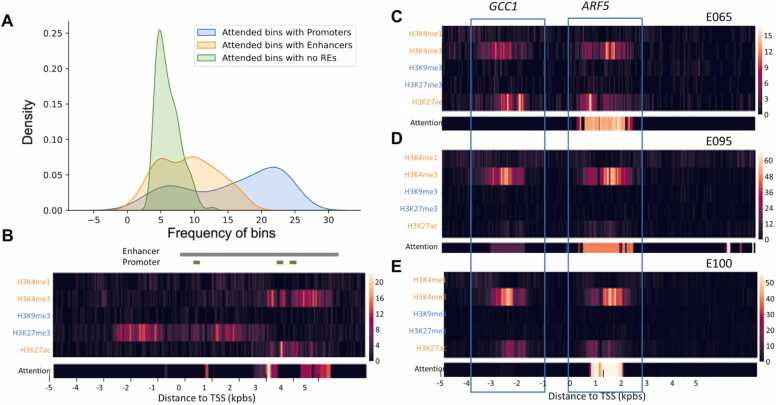
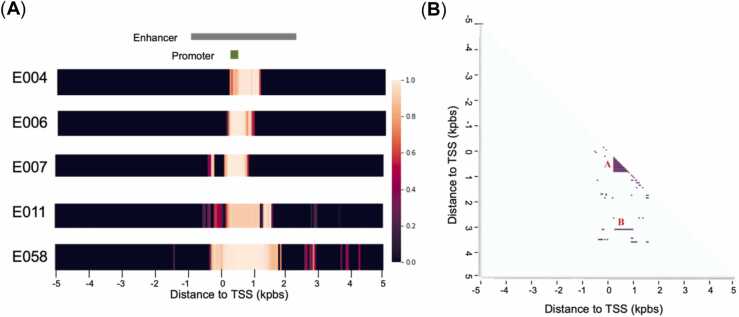
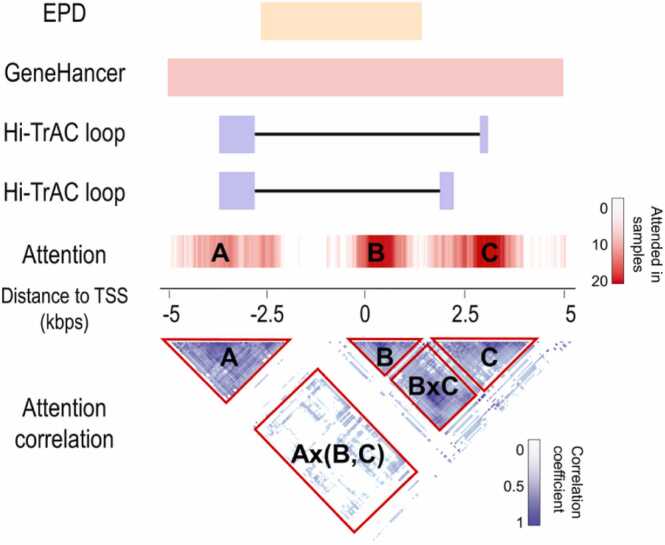
Gene transcription is an essential process involved in all aspects of cellular functions with significant impact on biological traits and diseases. This process is tightly regulated by multiple elements that co-operate to jointly modulate the transcription levels of target genes. To decipher the complicated regulatory network, we present a novel multi-view attention-based deep neural network that models the relationship between genetic, epigenetic, and transcriptional patterns and identifies co-operative regulatory elements (COREs). We applied this new method, named DeepCORE, to predict transcriptomes in various tissues and cell lines, which outperformed the state-of-the-art algorithms. Furthermore, DeepCORE contains an interpreter that extracts the attention values embedded in the deep neural network, maps the attended regions to putative regulatory elements, and infers COREs based on correlated attentions. The identified COREs are significantly enriched with known promoters and enhancers. Novel regulatory elements discovered by DeepCORE showed epigenetic signatures consistent with the status of histone modification marks.
Keywords: Cooperative regulatory elements; Deep learning; Epigenetics; Gene regulation.
© 2024 The Authors.
Conflict of interest statement
All authors claim no conflict of interest.
Figures
Update of
-
DeepCORE: An interpretable multi-view deep neural network model to detect co-operative regulatory elements.bioRxiv [Preprint]. 2023 Apr 19:2023.04.19.536807. doi: 10.1101/2023.04.19.536807. bioRxiv. 2023. Update in: Comput Struct Biotechnol J. 2023 Dec 29;23:679-687. doi: 10.1016/j.csbj.2023.12.044. PMID: 37131697 Free PMC article. Updated. Preprint.
Similar articles
-
DeepCORE: An interpretable multi-view deep neural network model to detect co-operative regulatory elements.bioRxiv [Preprint]. 2023 Apr 19:2023.04.19.536807. doi: 10.1101/2023.04.19.536807. bioRxiv. 2023. Update in: Comput Struct Biotechnol J. 2023 Dec 29;23:679-687. doi: 10.1016/j.csbj.2023.12.044. PMID: 37131697 Free PMC article. Updated. Preprint.
-
Opening up the blackbox: an interpretable deep neural network-based classifier for cell-type specific enhancer predictions.BMC Syst Biol. 2016 Aug 1;10 Suppl 2(Suppl 2):54. doi: 10.1186/s12918-016-0302-3. BMC Syst Biol. 2016. PMID: 27490187 Free PMC article.
-
Enhancer prediction with histone modification marks using a hybrid neural network model.Methods. 2019 Aug 15;166:48-56. doi: 10.1016/j.ymeth.2019.03.014. Epub 2019 Mar 21. Methods. 2019. PMID: 30905748
-
Epigenetics of neural differentiation: Spotlight on enhancers.Front Cell Dev Biol. 2022 Oct 13;10:1001701. doi: 10.3389/fcell.2022.1001701. eCollection 2022. Front Cell Dev Biol. 2022. PMID: 36313573 Free PMC article. Review.
-
Concise Review: Epigenetic Regulation of Hematopoiesis: Biological Insights and Therapeutic Applications.Stem Cells Transl Med. 2017 Dec;6(12):2106-2114. doi: 10.1002/sctm.17-0192. Epub 2017 Oct 28. Stem Cells Transl Med. 2017. PMID: 29080249 Free PMC article. Review.
Cited by
-
Artificial Intelligence in Metabolomics: A Current Review.Trends Analyt Chem. 2024 Sep;178:117852. doi: 10.1016/j.trac.2024.117852. Epub 2024 Jul 3. Trends Analyt Chem. 2024. PMID: 39071116
References
-
- Blackwood E.M., Kadonaga J.T. Going the distance: a current view of enhancer action. Science. 1998;281:60–63. - PubMed
-
- Appella E., Anderson C.W. Post-translational modifications and activation of p53 by genotoxic stresses. Eur J Biochem. 2001;268:2764–2772. - PubMed
-
- Carey M., Peterson C.L., Smale S.T. Cold Spring Harbor Laboratory Press,; 2009. Transcriptional regulation in eukaryotes.
Grants and funding
LinkOut - more resources
Full Text Sources