. 2024 Apr;130(6):1059-1072.
doi: 10.1038/s41416-024-02586-x. Epub 2024 Jan 26.

Farnesyl-transferase inhibitors show synergistic anticancer effects in combination with novel KRAS-G12C inhibitors

Affiliations

Farnesyl-transferase inhibitors show synergistic anticancer effects in combination with novel KRAS-G12C inhibitors

Marcell Baranyi et al. Br J Cancer. 2024 Apr.

Abstract

Background: Inhibition of mutant KRAS challenged cancer research for decades. Recently, allele-specific inhibitors were approved for the treatment of KRAS-G12C mutant lung cancer. However, de novo and acquired resistance limit their efficacy and several combinations are in clinical development. Our study shows the potential of combining G12C inhibitors with farnesyl-transferase inhibitors.

Methods: Combinations of clinically approved farnesyl-transferase inhibitors and KRAS G12C inhibitors are tested on human lung, colorectal and pancreatic adenocarcinoma cells in vitro in 2D, 3D and subcutaneous xenograft models of lung adenocarcinoma. Treatment effects on migration, proliferation, apoptosis, farnesylation and RAS signaling were measured by histopathological analyses, videomicroscopy, cell cycle analyses, immunoblot, immunofluorescence and RAS pulldown.

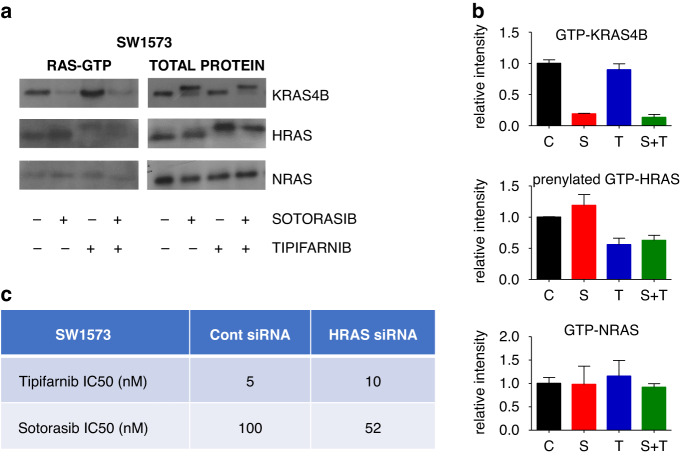
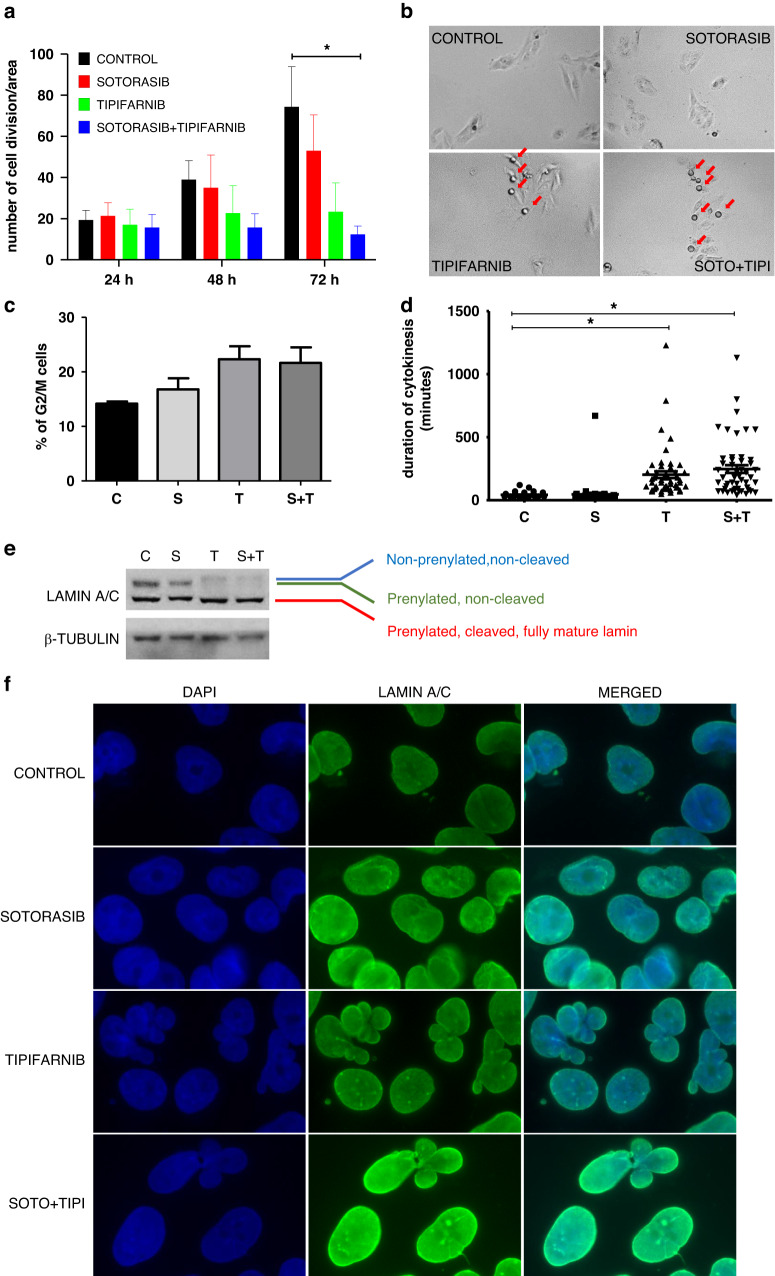
Results: Combination of tipifarnib with sotorasib shows synergistic inhibitory effects on lung adenocarcinoma cells in vitro in 2D and 3D. Mechanistically, we present antiproliferative effect of the combination and interference with compensatory HRAS activation and RHEB and lamin farnesylation. Enhanced efficacy of sotorasib in combination with tipifarnib is recapitulated in the subcutaneous xenograft model of lung adenocarcinoma. Finally, combination of additional KRAS G1C and farnesyl-transferase inhibitors also shows synergism in lung, colorectal and pancreatic adenocarcinoma cellular models.

Discussion: Our findings warrant the clinical exploration of KRAS-G12C inhibitors in combination with farnesyl-transferase inhibitors.


Conflict of interest statement

The authors declare that MB, EM, JTímár, JTóvári, IR and BH filed an international patent for the combinational treatment of KRAS inhibitors and farnesyl-transferase inhibitors of KRAS mutant cancers (patent number: PCT/HU2022/050077, priority date: 2021.11.02). Besides, MB, IR, VL acknowledge to be contracted employees and JTóvári to be chief scientific officer of Kineto Lab Ltd.

Figures

Fig. 1
Fig. 1. Sensitivity of lung adenocarcinoma cell lines to farnesyl-transferase inhibitors.
a Data from PRISM Primary Repurposing Screen shows pooled and normalized (to the viability of all 572 or 562 cell lines tested in the screen) sensitivity values to tipifarnib and lonafarnib. Error bars represent SEM for 30 WT KRAS and 8 KRAS-G12C mutant cells. Statistical significance is marked by an asterisk and was determined by an unpaired t-test in the case of tipifarnib (p = 0.0896) and lonafarnib (p = 0.0182). b Data from the GDSC1 screen (Genomics of Drug Sensitivity in Cancer from cancerrxgene.org) shows the natural logarithm of IC50 to tipifarnib and FTI277. Error bars represent SEM for 39 WT KRAS and 8 KRAS-G12C mutant cells. Statistical significance is determined with p < 0.05 and is marked by an asterisk and was analyzed by unpaired t-test in the case of tipifarnib (p = 0.4594) results and Mann–Whitney U test in the case of FTI277 (p = 0.0143).
Fig. 2
Fig. 2. Combination of sotorasib and tipifarnib in three KRAS-G12C mutant lung adenocarcinoma cell lines.
a Heatmaps of control-normalized cell viability values derived from 6-day-long 2D SRB tests. Treatment concentrations of each cell line can be seen in (b). Data is derived from three independent experiments. b Combinational index (CI) values of the 2D combinational experiments. CIs were calculated by CompuSyn Software. CI values less than 1 indicate synergy while values equal to or more than 1 represent additive or antagonistic effect, respectively. c Representative images of lung adenocarcinoma spheroids from 6-day-long 3D spheroid experiments exposed to 50 nM sotorasib and/or 100 nM tipifarnib treatment. Images were taken on the last day of the treatment. Scale bar means 0.2 mm. d Heatmaps of control-normalized spheroid volume data derived from 6-day-long 3D spheroid tests. The data shown is from three independent experiments. e Combinational index (CI) values of the 3D spheroid combinational experiments. Both 2D and 3D experiments resulted in robust synergistic combinational indexes.
Fig. 3
Fig. 3. Combination of sotorasib and tipifarnib in the sotorasib-sensitive (H358) and sotorasib-resistant (SW1573) xenograft models of lung adenocarcinoma.
H358 xenografts were given sotorasib (5 mg/kg i.p.) and/or tipifarnib (40 mg/kg i.p.), while SW1573 xenografts were treated with sotorasib (25 mg/kg i.p.) and/or tipifarnib (40 mg/kg i.p.) therapy. Treatment started after randomization when tumors reached approximately 100 mm3 (7 days following cell inoculation in the case of H358 xenografts and 26 days in the case of SW1573 tumors). Each treatment group contained 7 animals. The weekly treatment schedule was five days on and two days off. a Tumor volume was determined twice a week using a caliper. Relative tumor volume growth was normalized with each tumor’s starting volume on the day of the first treatment. Error bars represent SEM. In the case of H358 combinational treatment resulted in significantly smaller tumors compared to control and tipifarnib-treated tumors, while in SW1573 xenografts sotorasib monotherapy and combinational therapy resulted in significantly smaller tumors compared to control based on last day’s relative growth values. b Pictures of the harvested tumors. ce Histopathological analysis of necrotic areas and frequency of apoptosis and mitosis. In H358 tumors, amount of necrotic areas in the combination treatment group were significantly higher compared to control and both monotherapies. A significant increase in apoptosis and decrease in mitosis can also be observed. In SW1573 tumors, focal necrotic areas were significantly larger in sotorasib and combination treatment group compared to control and tipifarnib group, while frequency of apoptotic cells was higher in tipifarnib and combination treatment group compared to control and sotorasib. Sotorasib and combination treatments also decreased frequency of mitotic cells compared to control. Asterisks marks statistically significant differences with p < 0.05. Statistical significance was tested with the Kruskal–Wallis test followed by Dunn’s multiple comparison test.
Fig. 4
Fig. 4. RAS protein levels and activation following 48-hour-long treatment with sotorasib (100 nM) and/or tipifarnib (500 nM).
a Images show representative blots of the RAS proteins. RAS-GTP stands for only GTP-bound, active RAS proteins while “total protein” shows blots from the whole cell lysates. b Graphs represent normalized levels of GTP-bound KRAS4B, HRAS and NRAS, respectively. Note that the graph shows only changes of the prenylated fraction of HRAS. Protein levels were normalized to control. c Changes of IC50 values upon transfection with non-targeting and HRAS-targeting siRNA after 6-day-long treatment with tipifarnib and sotorasib. All data are from three independent experiments. Graphs show mean with error bars representing SEM.
Fig. 5
Fig. 5. Investigation of the proliferative activity of SW1573 cell line upon treatment and alterations in the laminar network.
a Number of cell divisions during a 72-hour-long treatment with sotorasib (100 nM) and/or tipifarnib (500 nM). Combination treatment induced a significant decrease in cell divisions on the last day of the treatment (N = 3, total number of cell divisions from three independent experiments from three fields of view/experiment. Asterisks marks statistically significant differences with p < 0.05. Statistical significance was tested with the Kruskal-Wallis test followed by Dunn’s multiple comparison test.). b Representative pictures from the videomicroscopic analysis show accumulation of cells unable to execute cytokinesis after treatment with tipifarnib alone or in combination with sotorasib. c Changes in M phase following treatment using a modified, M-phase preserving protocol of cell cycle investigation. d Duration of cytokinesis was measured following 48-hour-long treatment. Both tipifarnib and the combination treatment significantly increased the duration of cytokinesis. e Western blot analyses of Lamin A/C changes. Tipifarnib and the combination treatment resulted in the appearance of an upper third band (representative of the non-prenylated, non-cleaved lamins) while the level of prenylated, non-cleaved lamins diminished. f Immunofluorescence labeling of Lamin A/C proteins. DAPI (blue) staining reveals lobular cell nuclear morphology upon tipifarnib and combinational treatment. These treatments also lead to the accumulation of distinct spots of Lamin A/C (green) in the nucleus. All data shown derives from or is representative of three independent experiments. Graphs show mean with error bars representing SEM.
Fig. 6
Fig. 6. Combination treatments with various combinations of KRAS-G12C inhibitors and FTis in KRAS-G12C mutant lung, colorectal and pancreatic adenocarcinoma cell lines.
a, c Heatmaps of control-normalized cell viability values derived from 6-day-long 2D SRB tests. PF139 and SW1573 are lung, while PF97 colorectal and MIAPACA2 pancreatic adenocarcinoma cell lines. Treatment concentrations used for each cell line are shown in (b, d). Data is derived from three independent experiments. b, d Combinational index (CI) values of the 2D combinational experiments. CIs were calculated by CompuSyn Software. CI values less than 1 indicate synergy while values equal to or more than 1 represent additive or antagonistic effect, respectively.

Similar articles

Cited by

References

    1. Prior IA, Hood FE, Hartley JL. The frequency of ras mutations in cancer. Cancer Res. 2020;80:2969–74. doi: 10.1158/0008-5472.CAN-19-3682. - DOI - PMC - PubMed
    1. Timar J, Kashofer K. Molecular epidemiology and diagnostics of KRAS mutations in human cancer. Cancer Metastasis Rev. 2020;39:1029–38. doi: 10.1007/s10555-020-09915-5. - DOI - PMC - PubMed
    1. Moore AR, Rosenberg SC, McCormick F, Malek S. RAS-targeted therapies: is the undruggable drugged? Nat Rev Drug Discov. 2020;19:533–52. doi: 10.1038/s41573-020-0068-6. - DOI - PMC - PubMed
    1. Ghimessy A, Radeczky P, Laszlo V, Hegedus B, Renyi-Vamos F, Fillinger J, et al. Current therapy of KRAS-mutant lung cancer. Cancer Metastasis Rev. 2020;39:1159–77. doi: 10.1007/s10555-020-09903-9. - DOI - PMC - PubMed
    1. McCormick F. Sticking it to KRAS: covalent inhibitors enter the clinic. Cancer Cell. 2020;37:3–4. doi: 10.1016/j.ccell.2019.12.009. - DOI - PMC - PubMed