. 2024 Jan 25;43(1):32.
doi: 10.1186/s13046-024-02946-8.

MAGOH promotes gastric cancer progression via hnRNPA1 expression inhibition-mediated RONΔ160/PI3K/AKT signaling pathway activation

Affiliations

MAGOH promotes gastric cancer progression via hnRNPA1 expression inhibition-mediated RONΔ160/PI3K/AKT signaling pathway activation

Shanshan Yu et al. J Exp Clin Cancer Res. .

Abstract

Background: Gastric cancer (GC) is associated with high mortality and heterogeneity and poses a great threat to humans. Gene therapies for the receptor tyrosine kinase RON and its spliceosomes are attracting increasing amounts of attention due to their unique characteristics. However, little is known about the mechanism involved in the formation of the RON mRNA alternative spliceosome RONΔ160.

Methods: Fourteen human GC tissue samples and six normal gastric tissue samples were subjected to label-free relative quantitative proteomics analysis, and MAGOH was identified as a candidate protein for subsequent studies. The expression of MAGOH in clinical specimens was verified by quantitative real-time PCR and western blotting. We then determined the biological function of MAGOH in GC through in vitro and in vivo experiments. RNA pulldown, RNA sequencing and RNA immunoprecipitation (RIP) were subsequently conducted to uncover the underlying mechanism by which MAGOH regulated the formation of RONΔ160.

Results: Proteomic analysis revealed that MAGOH, which is located at key nodes and participates in RNA processing and mRNA splicing, was upregulated in GC tissue and GC cell lines and was associated with poor prognosis. Functional analysis showed that MAGOH promoted the proliferation, migration and invasion of GC cells in vitro and in vivo. Mechanistically, MAGOH inhibited the expression of hnRNPA1 and reduced the binding of hnRNPA1 to RON mRNA, thereby promoting the formation of RONΔ160 to activate the PI3K/AKT signaling pathway and consequently facilitating GC progression.

Conclusions: Our study revealed that MAGOH could promote the formation of RONΔ160 and activate the PI3K/AKT signaling pathway through the inhibition of hnRNPA1 expression. We elucidate a novel mechanism and potential therapeutic targets for the growth and metastasis of GC based on the MAGOH-RONΔ160 axis, and these findings have important guiding significance and clinical value for the future development of effective therapeutic strategies for GC.

Keywords: Alternative splicing; Gastric cancer; MAGOH; PI3K/AKT signaling pathway; RONΔ160; hnRNPA1.


Conflict of interest statement

The authors declare that they have no conflict of interest. Figure 9 was created with BioRender software.

Figures
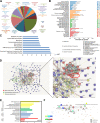
Fig. 1
Fig. 1
Screening of DEPs in GC tissue based on label-free relative quantitative proteomics. A Protein ANalysis through Evolutionary Relationships (PANTHER 9.0) for the analysis of the protein classes of DEPs between GC patients and healthy controls. B The results from the pathway enrichment analysis of the DEPs were divided into four pathways, and the second pathway, genetic information processing, was particularly significant. C The top ten most statistically significant enriched pathways, most of which were involved in RNA splicing and metabolism. D Protein‒protein interaction analysis of DEPs. The circled RNA-binding proteins and splicing-involved proteins interacted in clusters, and MAGOH was located at the node between the splicing-related proteins and the ribosome-related proteins. E Schematic representation of the functional enrichment analysis of proteins interacting with MAGOH. F Schematic diagram of pathways involving MAGOH and its interacting proteins visualized by OmicsBean analysis
Fig. 2
Fig. 2
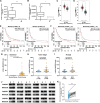
MAGOH was generally upregulated in GC and predicted poor prognosis. A Relative expression of MAGOH in GC tissues identified by label-free relative quantitative proteomics. B Relative expression of MAGOHB in GC tissues identified by label-free relative quantitative proteomics. C Differences in the expression of MAGOH in GC tissues analyzed using the GEPIA database. D Differences in the expression of MAGOHB in GC tissues analyzed using the GEPIA database. E The Kaplan‒Meier plotter database (210092_at) was used to analyze the correlation between the MAGOH level and overall survival (OS) or first progression survival (FPS) in GC patients. F The Kaplan‒Meier plotter database (218894_s_at) was used to analyze the correlation between MAGOHB levels and OS or FPS in GC patients. G qRT‒PCR analysis of MAOGH expression in GC tissues and corresponding normal tissues (n = 60, p < 0.0001; Student’s t test). H Correlation between MAGOH expression and tumor stage (I-II or III-IV) in 60 GC tumor samples. The statistical significance of the data was analyzed by the chi-square test. I Correlation between MAGOH expression and N stage (N0-1 or N2-3) in 60 GC tumor samples. The statistical significance of the data was analyzed by the chi-square test. J Western blotting was used to analyze the expression level of the MAGOH protein in GC tissues and adjacent normal tissues (n = 18). K ImageJ quantification of the WB results for the MAGOH protein (n = 18). The data are shown as the means ± SDs. Differences were considered significant if p < 0.05 (**p < 0.01, ***p < 0.001, ****p < 0.0001)
Fig. 3
Fig. 3
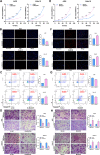
MAGOH promoted GC proliferation and metastasis in vitro. A A CCK-8 assay showed that MAGOH knockdown inhibited the proliferation of GC cells. B The EdU immunofluorescence assay showed that MAGOH knockdown inhibited the proliferation of GC cells. Scale bar = 100 μm. C Flow cytometry showed that MAGOH knockdown accelerated the apoptosis of GC cells. The bar graph (right panel) showed the percentage of apoptotic cells. D Transwell assays revealed that MAGOH knockdown inhibited the migration and invasion abilities of GC cells. Scale bar = 200 μm. E A CCK8 assay showed that MAGOH overexpression promoted the proliferation of GC cells. F The results of the EdU immunofluorescence assay showed that MAGOH overexpression enhanced the proliferation of GC cells. Scale bar = 100 μm. G Flow cytometry showed that MAGOH overexpression decreased the apoptosis of GC cells. The bar graph (right panel) showed the percentage of apoptotic cells. H Transwell assays showed that MAGOH overexpression facilitated the migration and invasion of GC cells. Scale bar = 200 μm
Fig. 4
Fig. 4
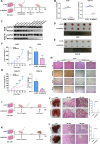
MAGOH encouraged GC tumor growth and distant metastasis. A Schematic representation of the subcutaneous xenograft tumor model in BALB/c nude mice. B The mRNA levels of MAGOH in xenograft tumors from nude mice were determined by RT‒qPCR (n = 5). C The protein levels of MAGOH in xenograft tumors from nude mice were determined via WB (n = 5). D, E Anatomical images of subcutaneous xenograft tumors in different groups. F, G Tumor growth curves and weight analyses of xenografts in nude mice. H Xenograft tumor sections were stained with HE and subjected to IHC using anti-MAGOH, anti-Ki67, and anti-Bcl-2 antibodies. Scale bar for 40X-magnified images = 500 μm; scale bar for 200X-magnified images = 100 μm. I Schematic diagram of the process used to establish a pulmonary metastasis model in BALB/c nude mice after tail vein injection. J Pulmonary metastasis models were constructed with MAGOH-knockdown (sh-MAGOH) or negative control (sh-NC) AGS cells (n = 5). Representative photographs of the dissected lungs (left) were presented to show metastases (marked by black arrows), and HE staining was performed to confirm the presence of metastases (middle); the results were presented in histograms (right). K Schematic diagram of BALB/c nude mice after spleen vein injection to establish a liver metastasis model. L Liver metastasis models were constructed with MAGOH-knockdown (sh-MAGOH) or negative control (sh-NC) AGS cells (n = 5). Representative photographs of the dissected livers (left) were presented to show metastases (marked by black arrows), and HE staining was used to confirm the presence of metastases (middle), which were quantified in histograms (right)
Fig. 5
Fig. 5
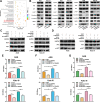
MAGOH indirectly regulated the formation of RONΔ160. A The correlation between MAGOH and RONΔ160 expression in GC tissues and paired normal tissues was analyzed. B RT‒qPCR was used to measure the mRNA levels of RON∆160 and flRON in GC cells transfected with MAGOH siRNA. C RT‒qPCR was used to measure the mRNA levels of RON∆160 and flRON in GC cells transfected with the MAGOH overexpression plasmid. D WB was used to measure the protein levels of RON∆160 and flRON in GC cells transfected with MAGOH siRNA, the quantified results were presented in histograms (right). E WB was used to measure the protein levels of RON∆160 and flRON in GC cells transfected with a MAGOH overexpression plasmid, the quantified results were presented in histograms (right). F Biotinylated RON pull-down assays of AGS and Kato III cell lysates were performed, and the expression levels of EJC components, including MAGOH, EIF4A3, and Y14, were measured via WB. G RIP analysis of RON was performed using IgG and MAGOH antibodies. The relative enrichment of RON mRNA was calculated by qRT‒PCR
Fig. 6
Fig. 6
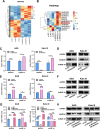
MAGOH inhibited hnRNPA1 expression and hnRNPA1 binding to RON mRNA. A Heatmap of differentially expressed genes (DEGs) between AGS cells with low MAGOH expression and control cells. B Heatmap of the expression profiles of splicing factors showing significant differences between AGS cells with low MAGOH expression and control cells. C, D The correlation between the expression of MAGOH and hnRNPA1 in GC cells transfected with MAGOH siRNA was examined by qRT‒PCR and WB. E, F The correlation between the expression of MAGOH and hnRNPA1 in GC cells transfected with the MAGOH overexpression plasmid was examined by qRT‒PCR and WB. G, H The correlation between the expression of MAGOH and hnRNPA1 in the sh-NC group, sh-MAGOH group and sh-MAGOH + MAGOH overexpression plasmid cotransfected group was examined by qRT‒PCR and WB
Fig. 7
Fig. 7
Silencing hnRNPA1 rescued the changes in cell proliferation and invasion caused by MAGOH knockdown. A, B AGS cells (A) and Kato III cells (B) were transfected with NC siRNA or MAGOH siRNA, and RIP analyses of RON in both groups were performed using anti-IgG and anti-hnRNPA1 antibodies, respectively. The relative enrichment of RON mRNA was calculated by qRT‒PCR. C, D qRT‒PCR (C) and WB (D) were used to assess the expression of RON∆160 and flRON in the MAGOH-silenced and hnRNPA1-silenced rescue groups of AGS cells. E, F qRT‒PCR (E) and WB (F) were used to assess the expression of RON∆160 and flRON in the MAGOH-silenced and hnRNPA1-silenced rescue groups of Kato III cells. G, H A CCK8 assay was conducted to analyze the short-term proliferation ability of AGS cells (G) and Kato III cells (H) after cotransfection with si-NC + si-NC, si-NC + si-hnRNPA1, si-NC + si-MAGOH or si-hnRNPA1 + si-MAGOH. I, J A colony formation assay was conducted to evaluate the long-term proliferation ability of cotransfected AGS cells (I) and Kato III cells (J). K, L A Transwell assay was performed to evaluate the invasion and migration capacities of cotransfected AGS cells (K) and Kato III cells (L). Scale bar = 200 μm
Fig. 8
Fig. 8
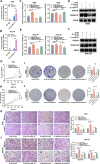
MAGOH accelerated GC progression by activating the PI3K/AKT signaling pathway in an hnRNPA1/RONΔ160-dependent manner. A The enrichment of DEGs in different pathways was assessed by KEGG pathway enrichment analysis. B WB was used to detect changes in the expression of PI3K/AKT signaling pathway components and their corresponding downstream genes in GC cells after MAGOH knockdown, MAGOH overexpression or stable MAGOH knockdown followed by MAGOH restoration. C WB was used to assess the expression of proteins in the PI3K/AKT signaling pathway in the MAGOH-silenced and hnRNPA1-silenced rescue groups of GC cells. D WB was used to assess the expression of proteins in the PI3K/AKT signaling pathway in the MAGOH-silenced and RONΔ160-overexpressing rescue groups of GC cells. EG A CCK8 assay was performed to evaluate the proliferative ability of MAGOH-overexpressing (E), hnRNPA1-silenced (F) and RONΔ160-overexpressing (G) GC cells in the presence of LY294002, an inhibitor of the PI3K/AKT signaling pathway
Fig. 9
Fig. 9
Schematic illustration of the mechanism by which MAGOH promoted GC progression via hnRNPA1 expression inhibition-mediated RONΔ160/PI3K/AKT signaling pathway activation

Similar articles

References

    1. Sung H, Ferlay J, Siegel R, Laversanne M, Soerjomataram I, Jemal A, et al. Global Cancer Statistics 2020: GLOBOCAN Estimates of incidence and mortality worldwide for 36 cancers in 185 countries. CA Cancer J Clin. 2021;71(3):209–249. doi: 10.3322/caac.21660. - DOI - PubMed
    1. In H, Solsky I, Palis B, Langdon-Embry M, Ajani J, Sano T. Validation of the 8th edition of the AJCC TNM staging system for gastric cancer using the national cancer database. Ann Surg Oncol. 2017;24(12):3683–91. doi: 10.1245/s10434-017-6078-x. - DOI - PubMed
    1. Smyth E, Nilsson M, Grabsch H, van Grieken N, Lordick F. Gastric cancer. Lancet (London, England) 2020;396(10251):635–648. doi: 10.1016/S0140-6736(20)31288-5. - DOI - PubMed
    1. Zhou Y, Chen Y, Shi Y, Wu L, Tan Y, Li T, et al. FAM117B promotes gastric cancer growth and drug resistance by targeting the KEAP1/NRF2 signaling pathway. J Clin Invest. 2023;133(3):e158705. doi: 10.1172/JCI158705. - DOI - PMC - PubMed
    1. Joshi S, Badgwell B. Current treatment and recent progress in gastric cancer. CA Cancer J Clin. 2021;71(3):264–279. doi: 10.3322/caac.21657. - DOI - PMC - PubMed