

DNA-guided transcription factor cooperativity shapes face and limb mesenchyme
- PMID: 38262408
- PMCID: PMC10872279
- DOI: 10.1016/j.cell.2023.12.032
DNA-guided transcription factor cooperativity shapes face and limb mesenchyme
Abstract
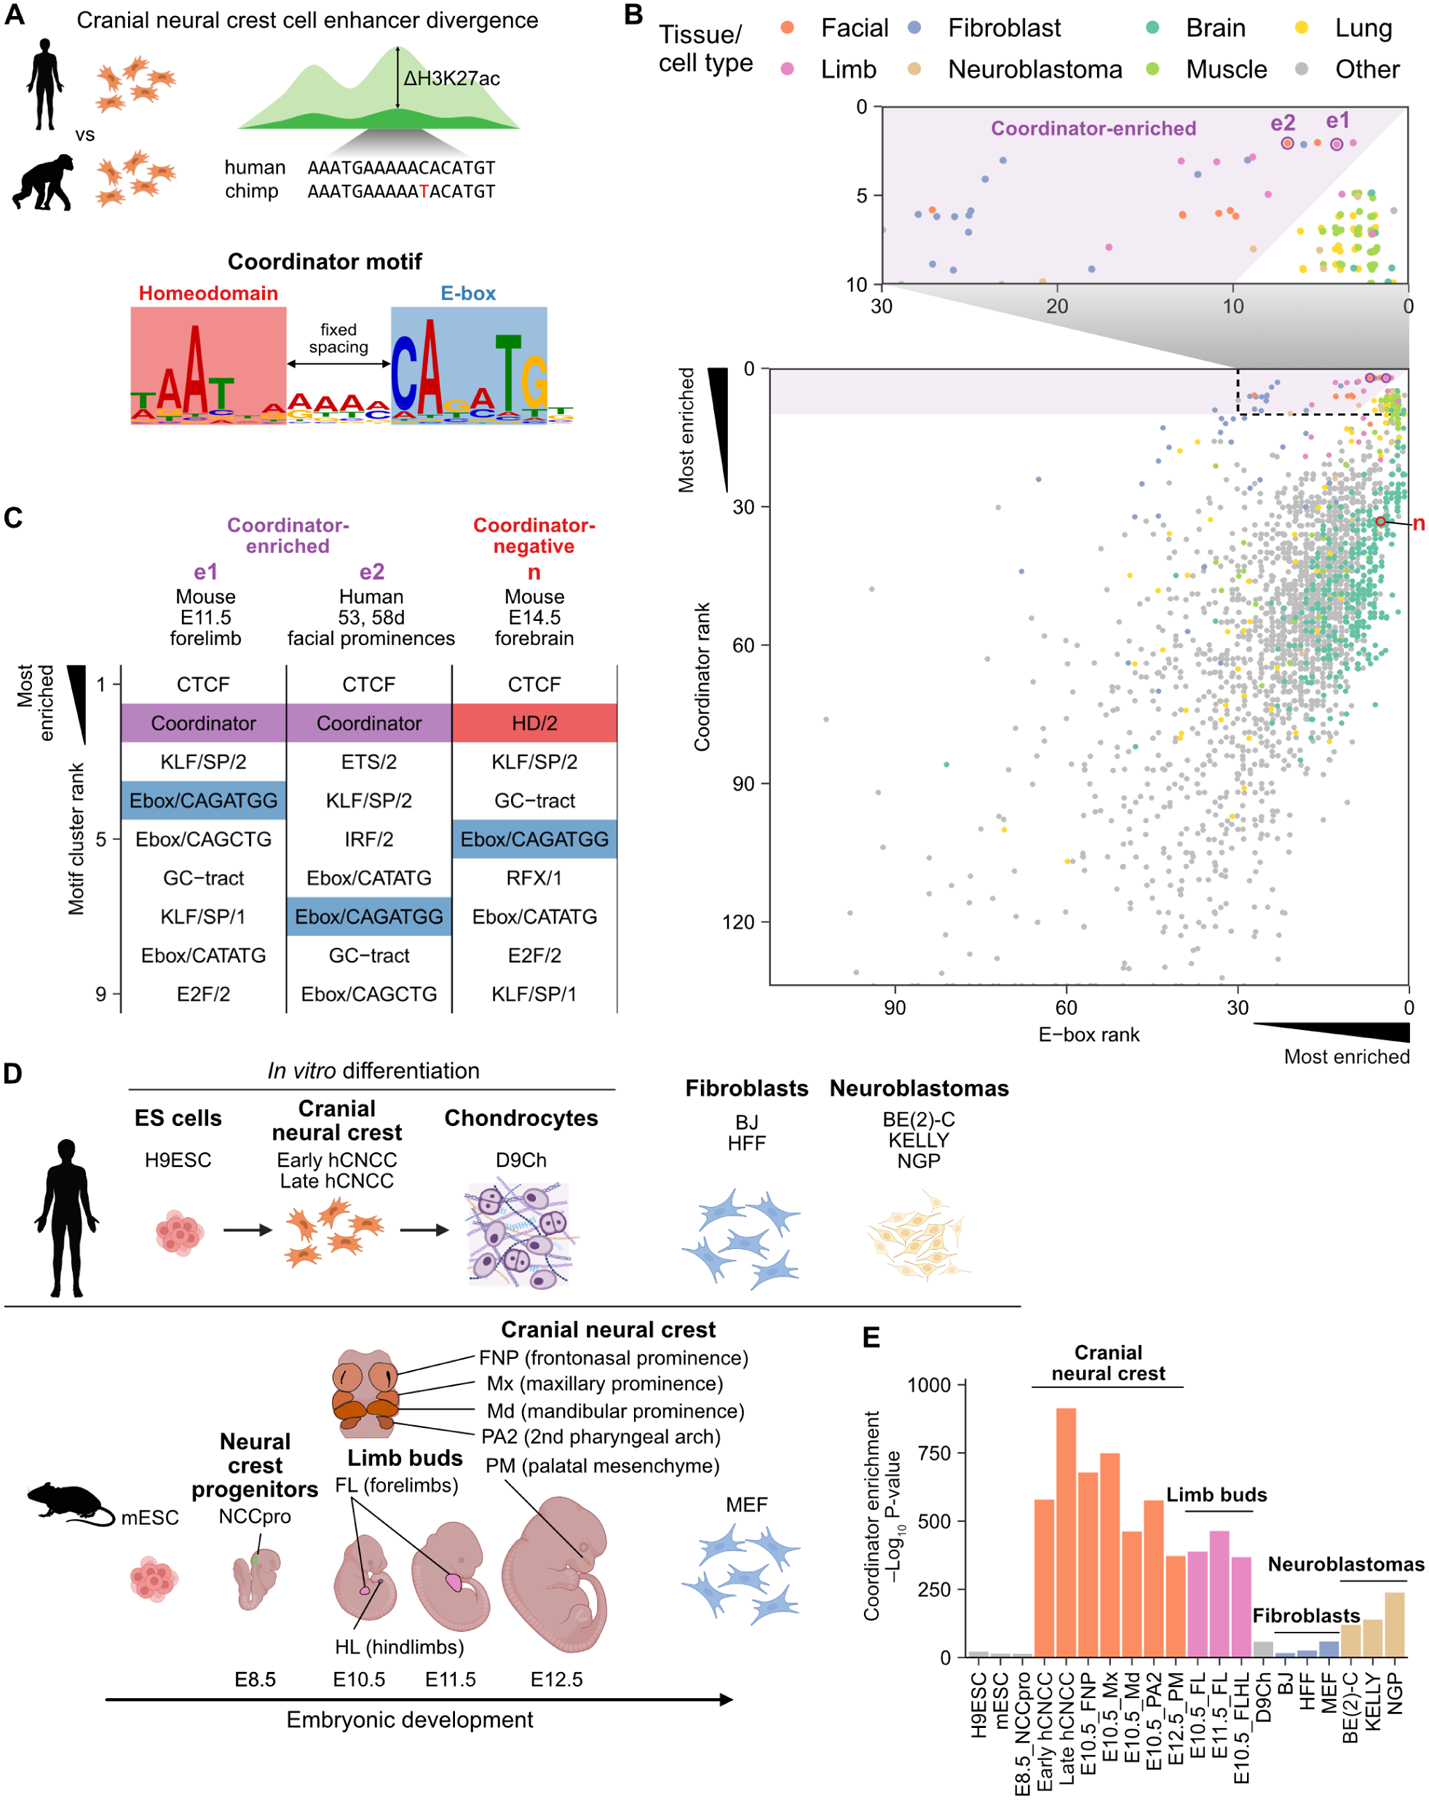
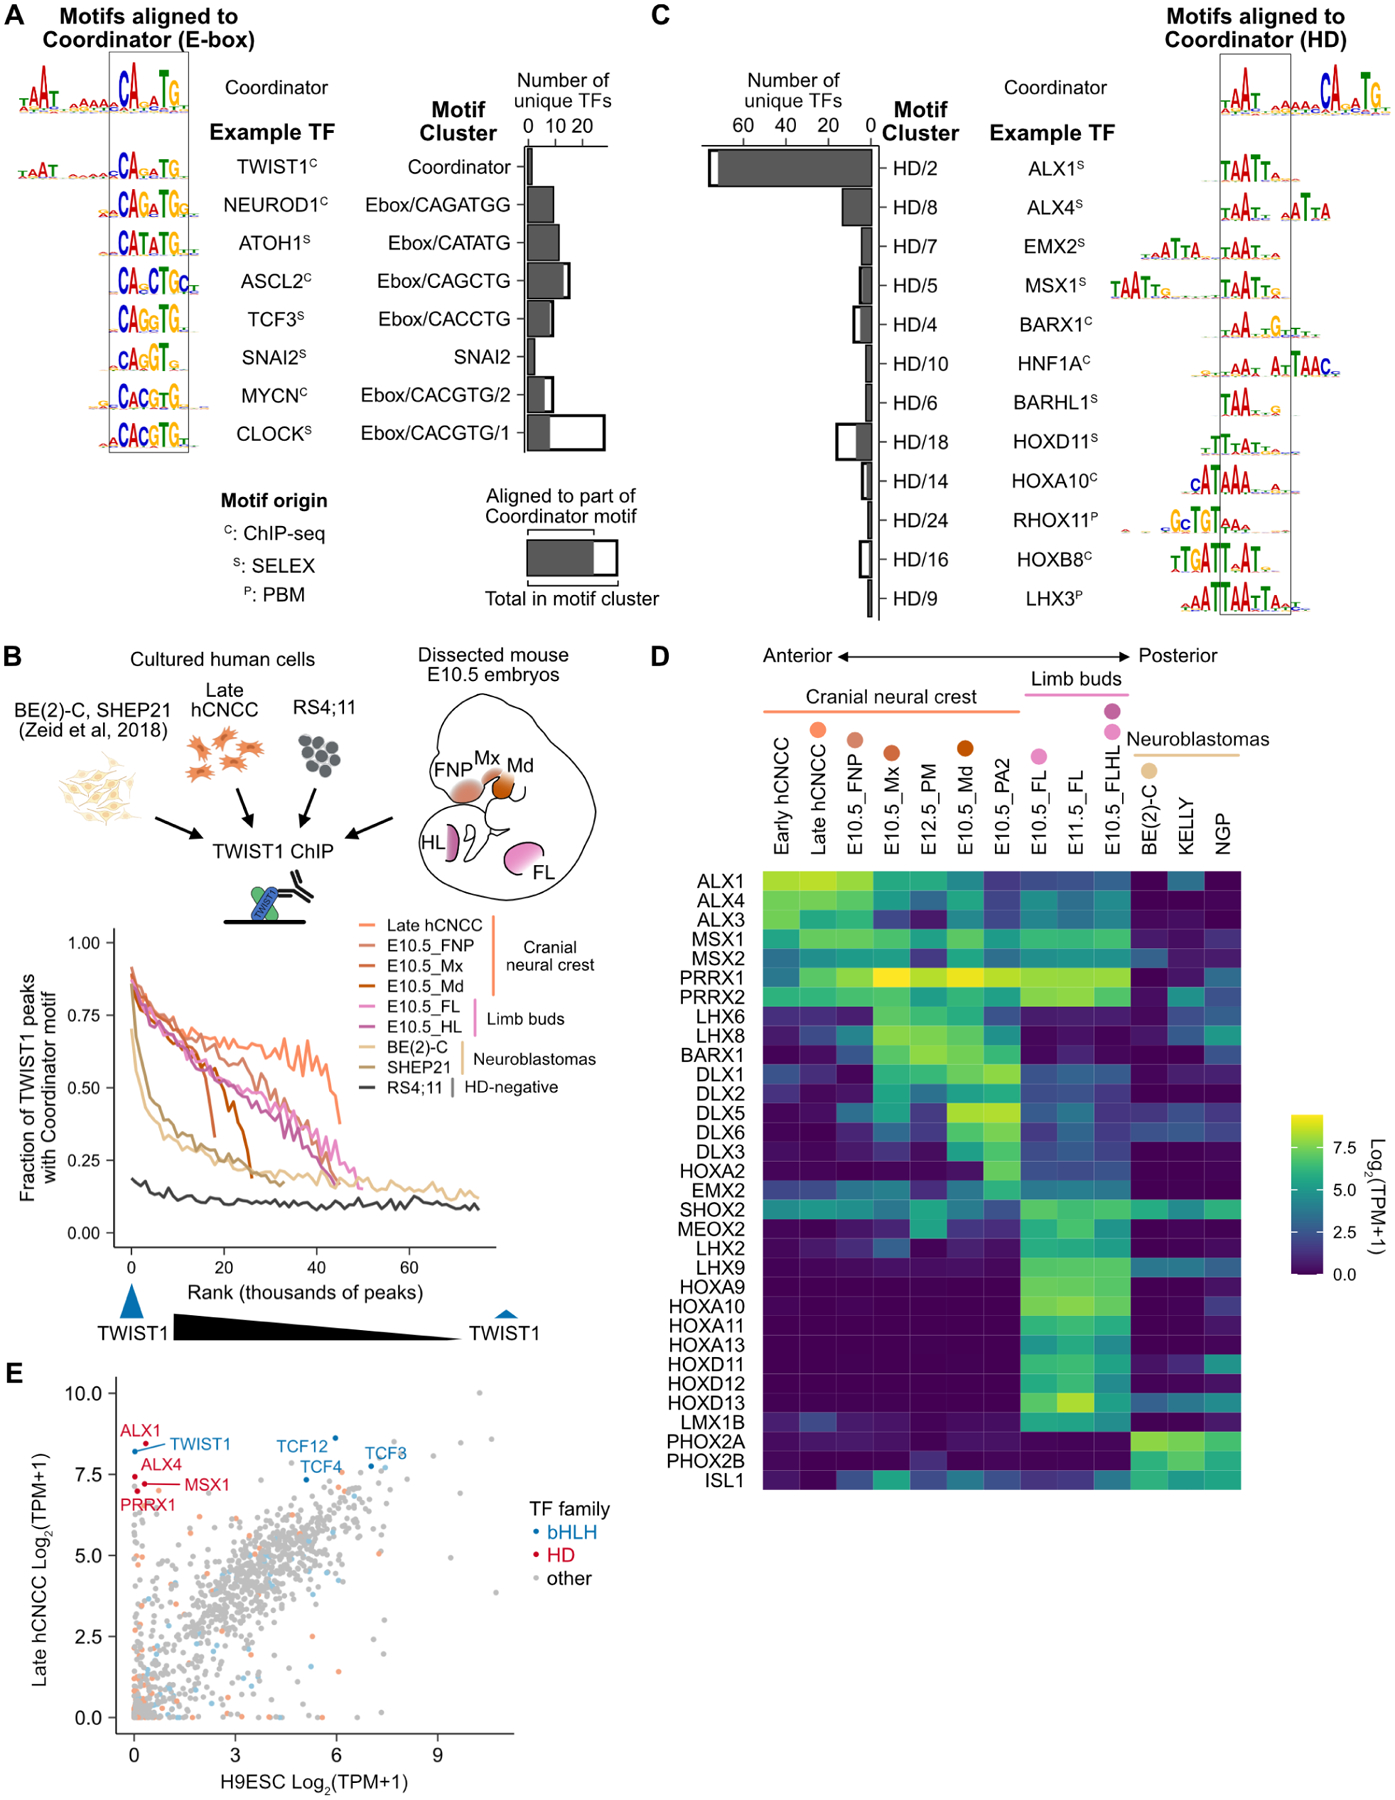
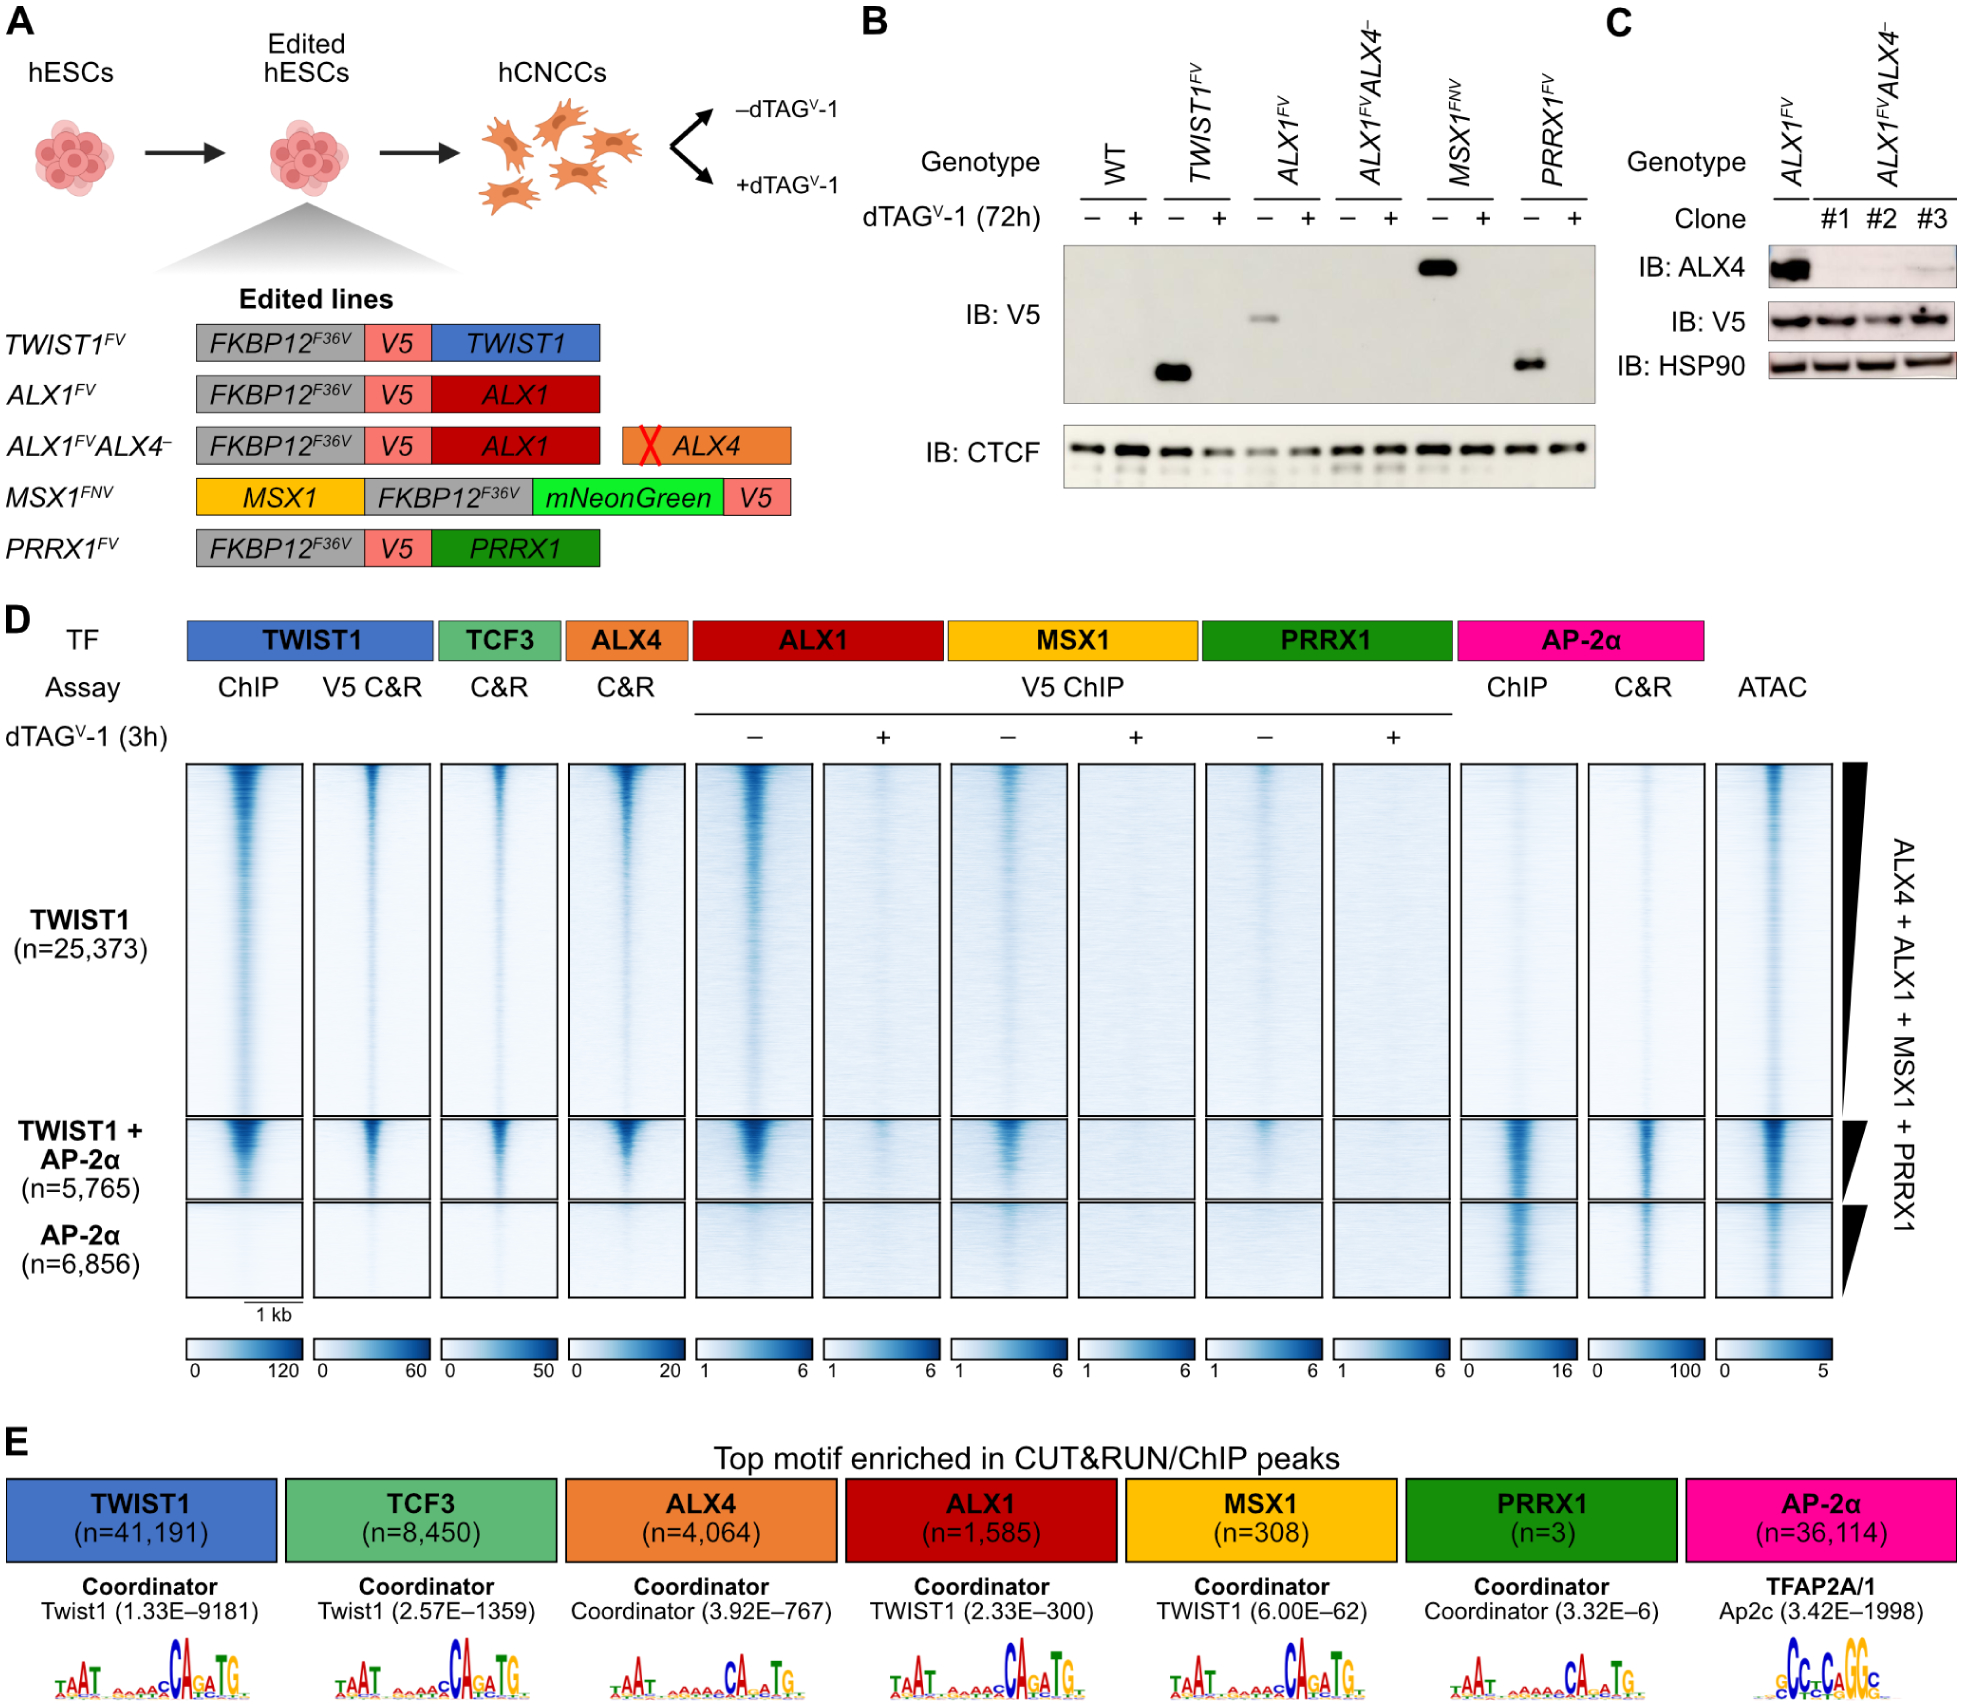
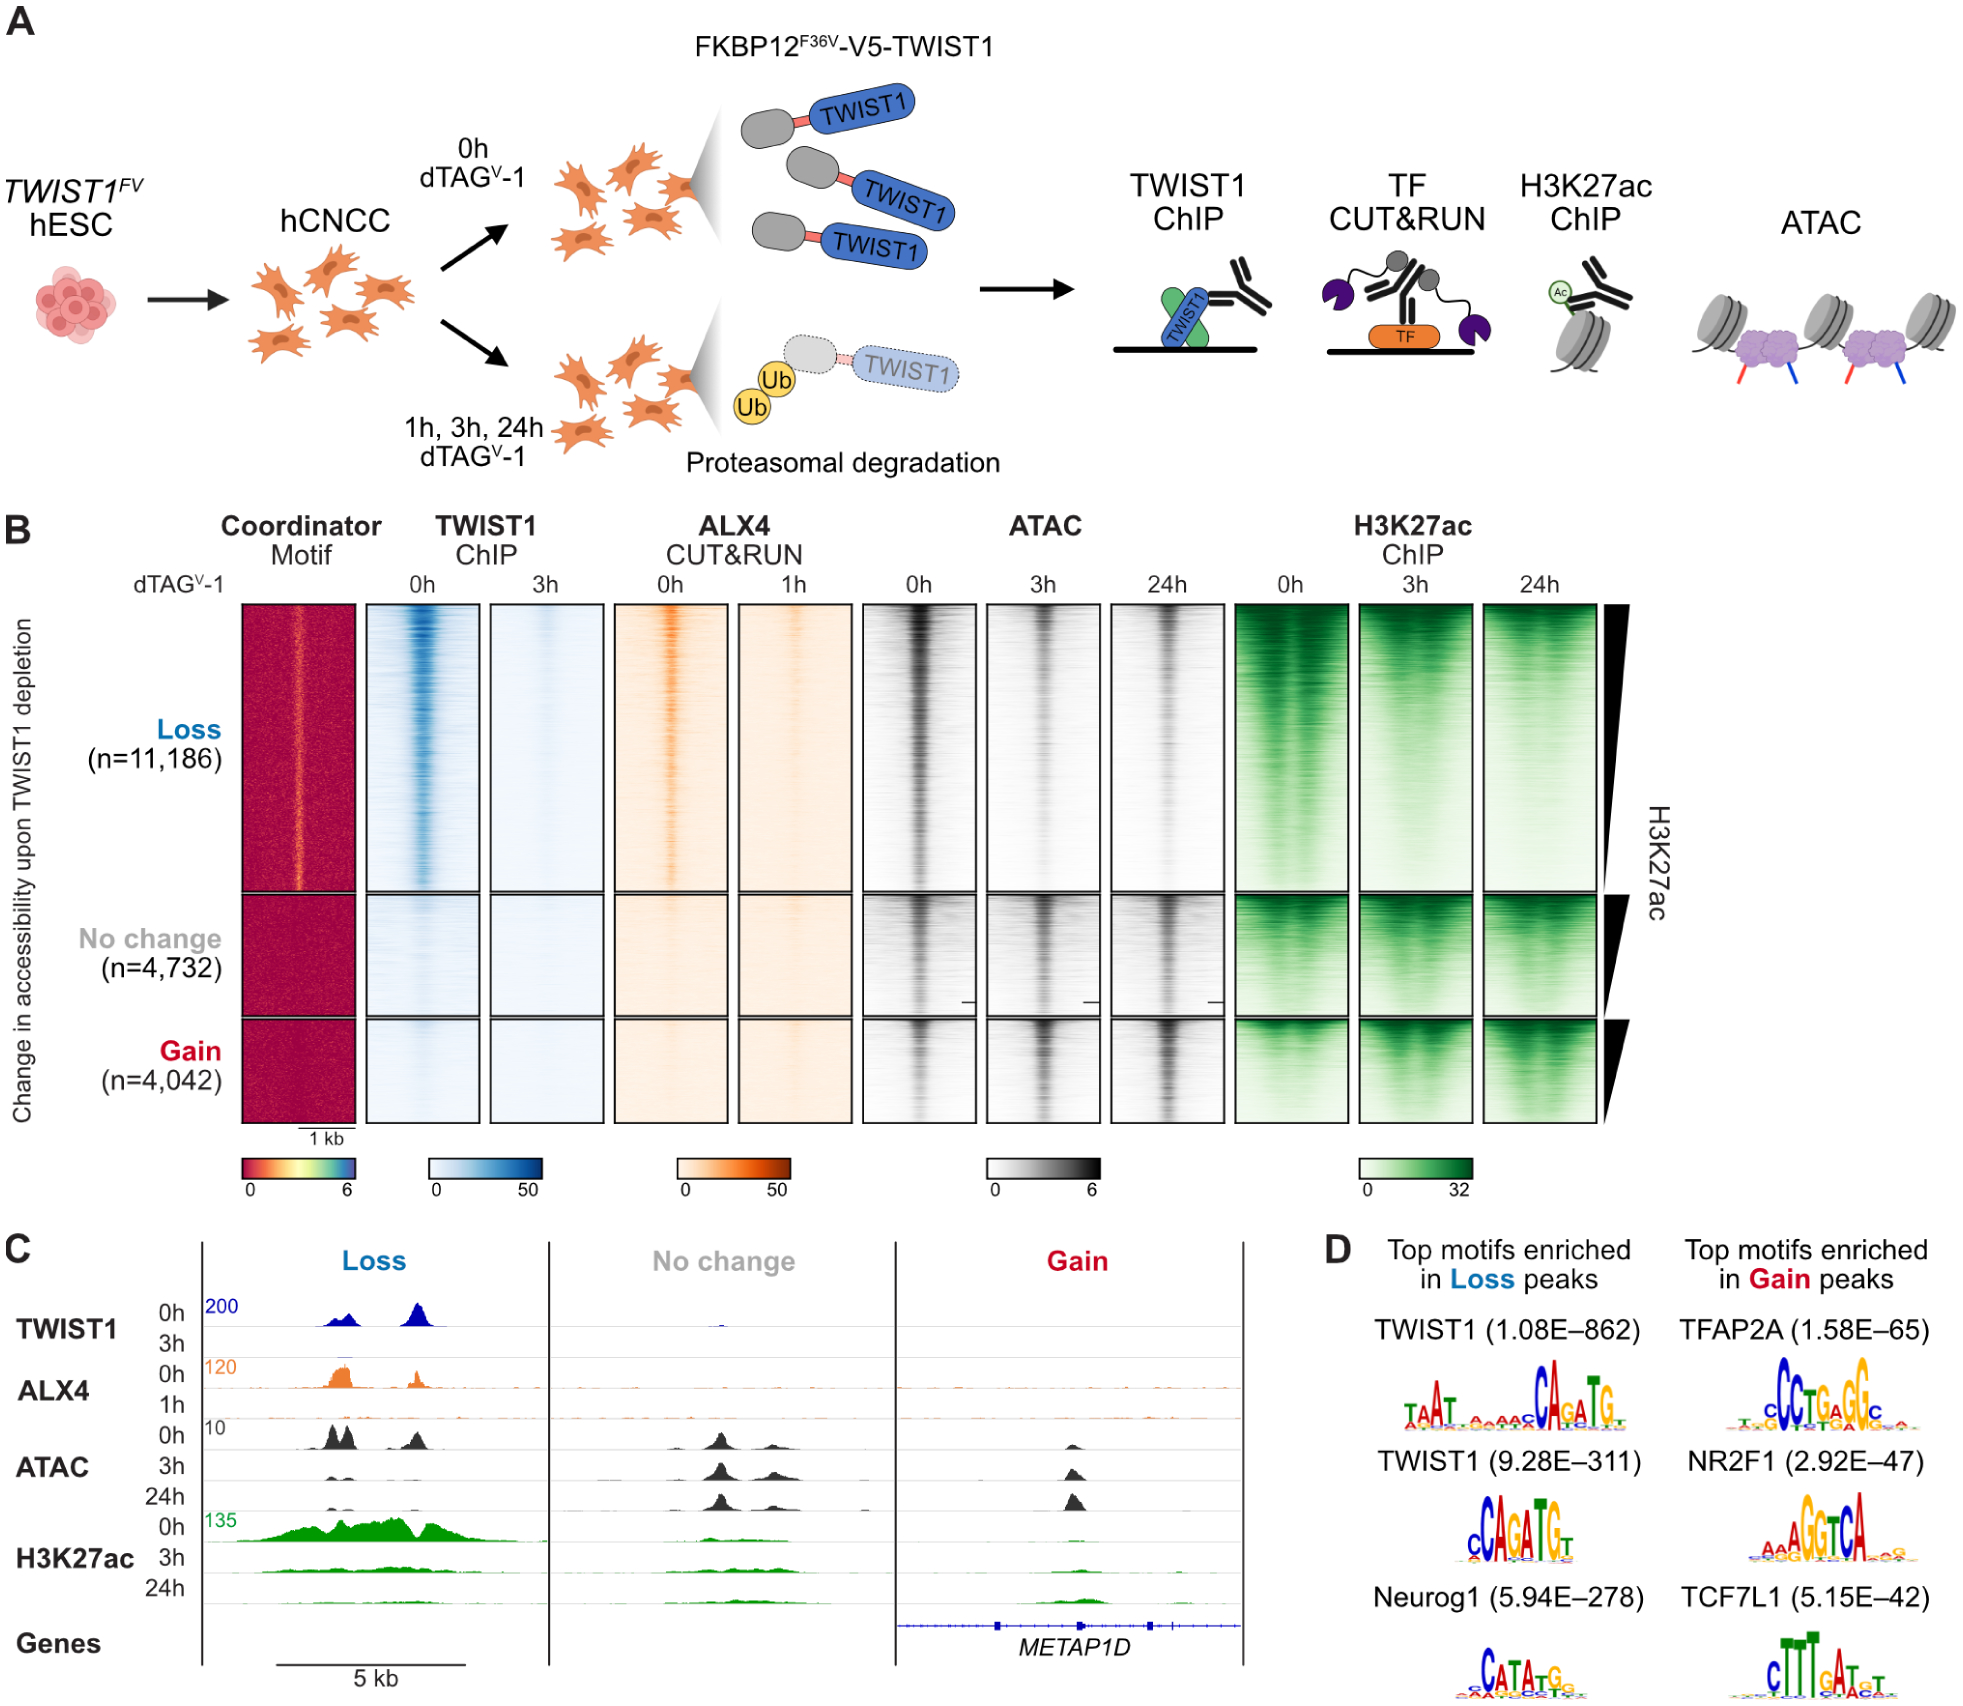
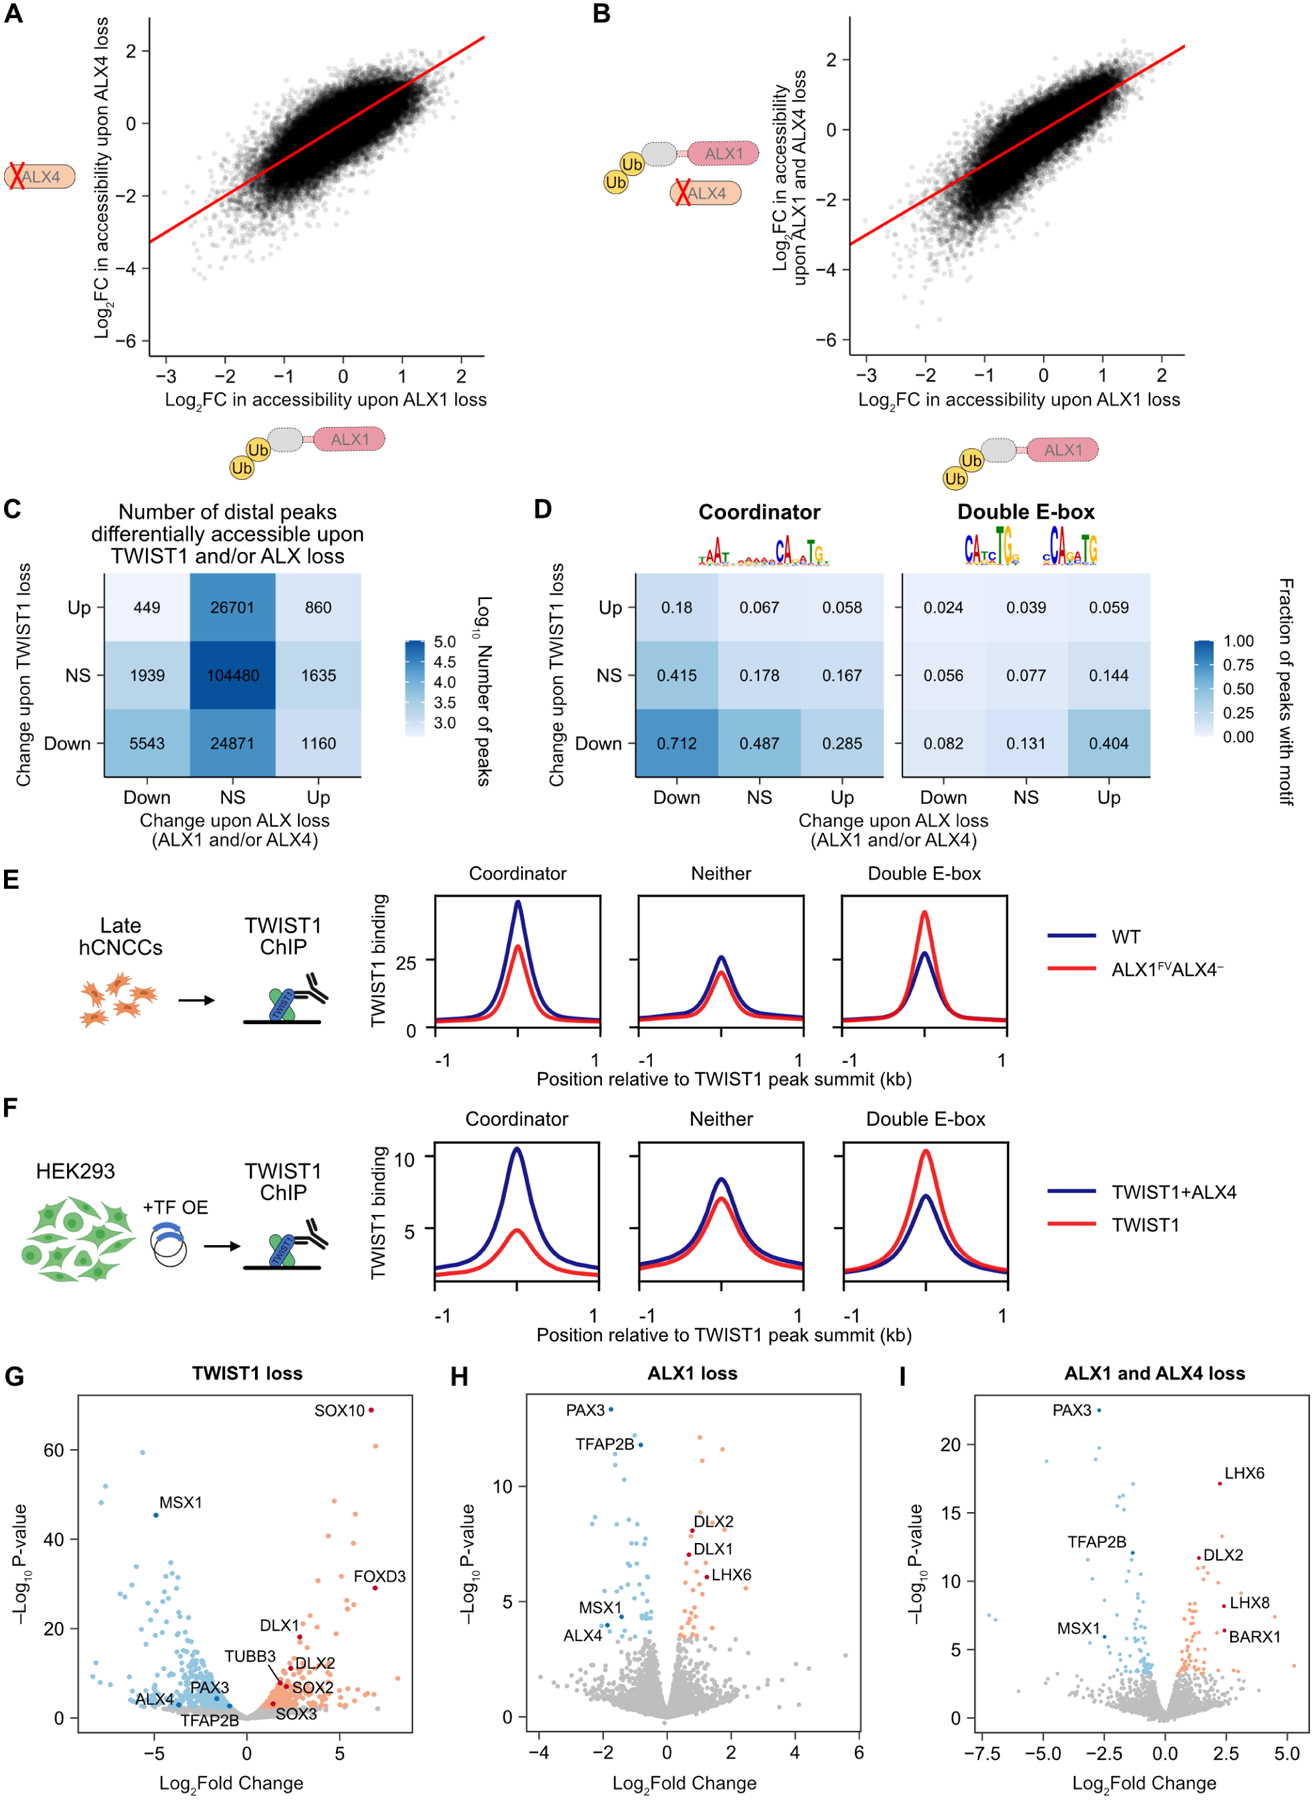
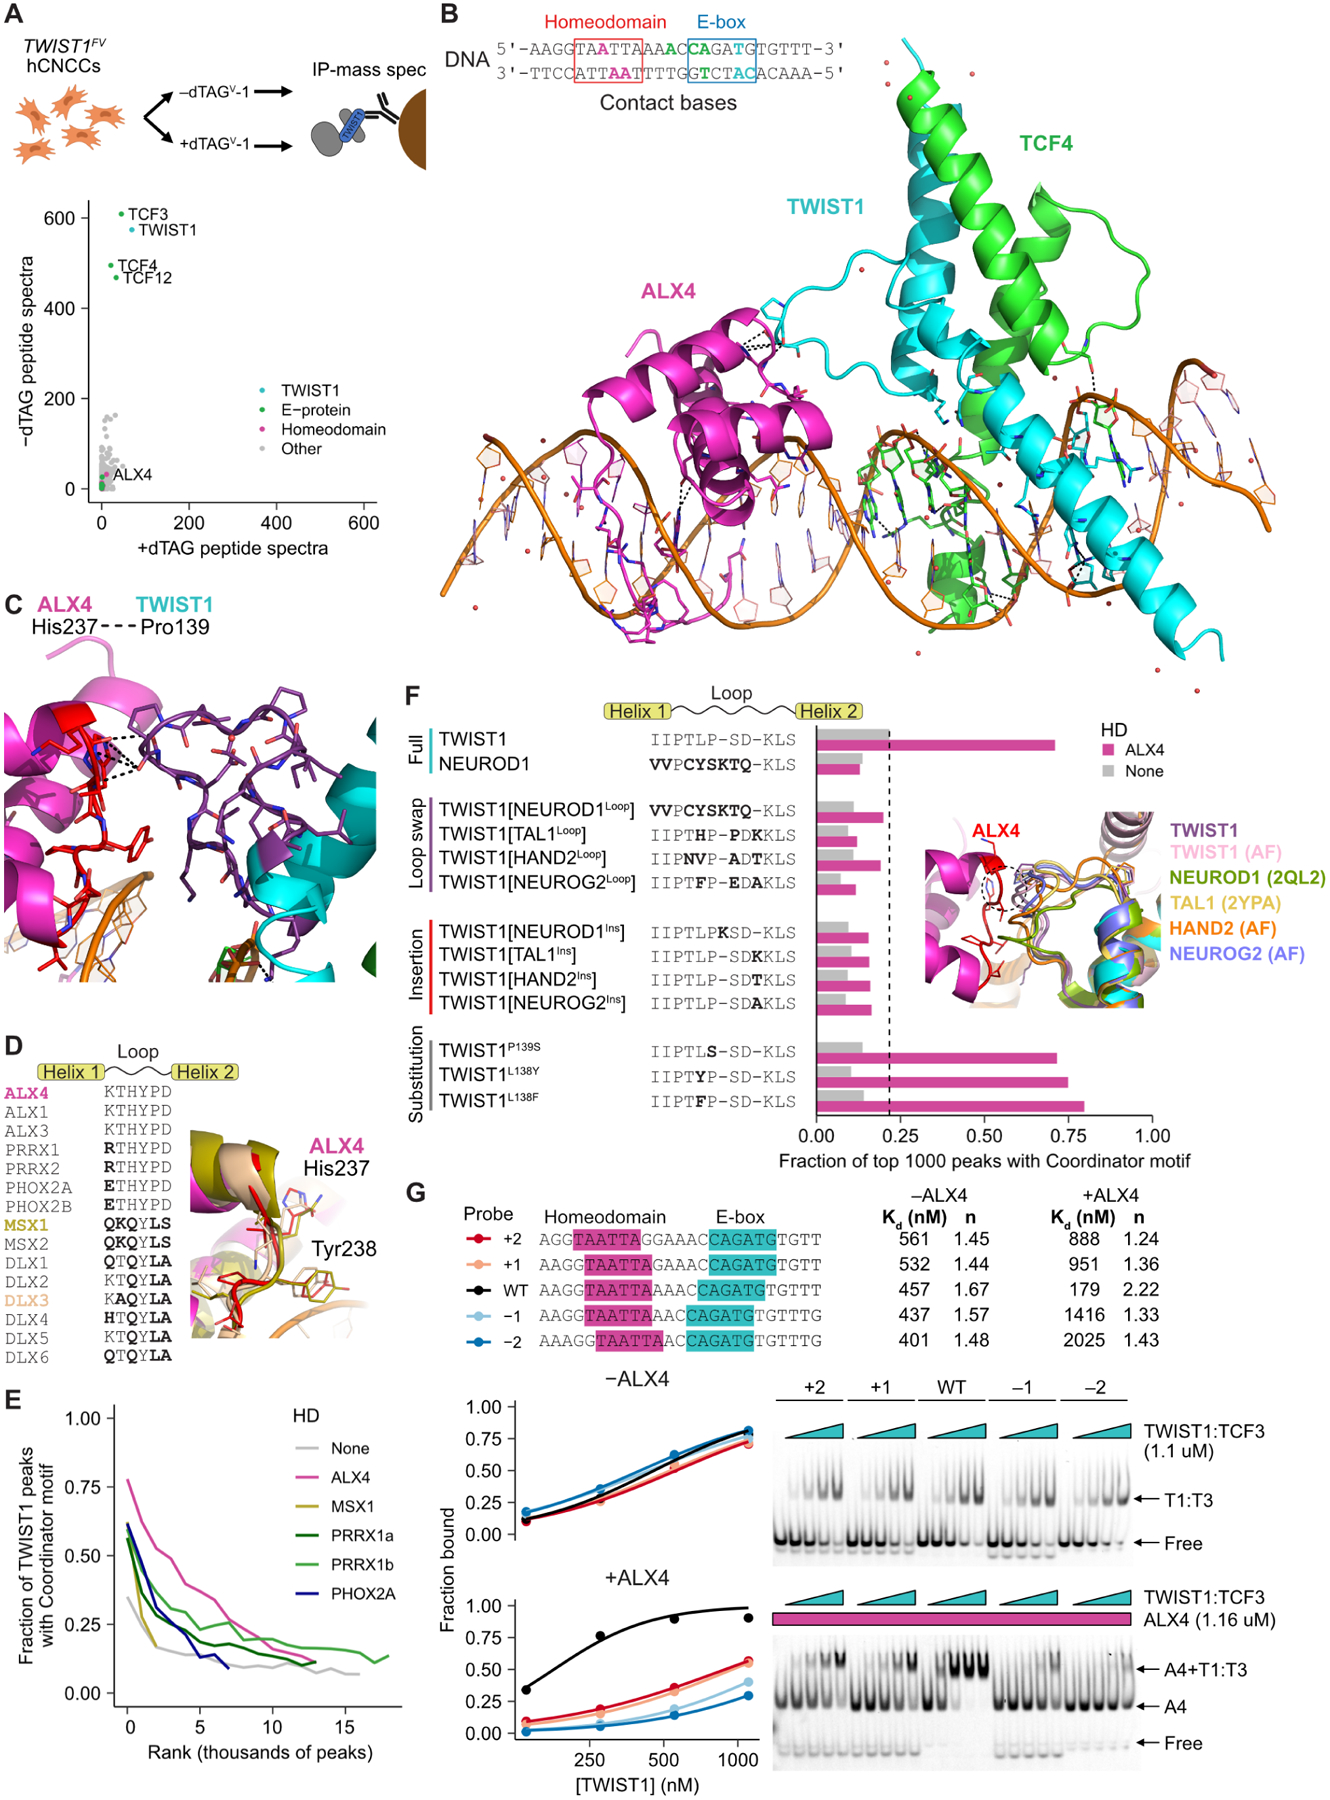
Transcription factors (TFs) can define distinct cellular identities despite nearly identical DNA-binding specificities. One mechanism for achieving regulatory specificity is DNA-guided TF cooperativity. Although in vitro studies suggest that it may be common, examples of such cooperativity remain scarce in cellular contexts. Here, we demonstrate how "Coordinator," a long DNA motif composed of common motifs bound by many basic helix-loop-helix (bHLH) and homeodomain (HD) TFs, uniquely defines the regulatory regions of embryonic face and limb mesenchyme. Coordinator guides cooperative and selective binding between the bHLH family mesenchymal regulator TWIST1 and a collective of HD factors associated with regional identities in the face and limb. TWIST1 is required for HD binding and open chromatin at Coordinator sites, whereas HD factors stabilize TWIST1 occupancy at Coordinator and titrate it away from HD-independent sites. This cooperativity results in the shared regulation of genes involved in cell-type and positional identities and ultimately shapes facial morphology and evolution.
Keywords: ALX factors; Coordinator; TWIST1; bHLH; cooperativity; face; homeodomain; limb; mesenchyme; neural crest; transcription factor.
Copyright © 2023 The Author(s). Published by Elsevier Inc. All rights reserved.
Conflict of interest statement
Declaration of interests J.W. is a paid scientific advisory board member at Camp4 and Paratus Sciences. J.T. has a consultancy agreement with DeepMind Technologies. J.W. is an advisory board member at Cell Press journals, including Cell, Molecular Cell, and Developmental Cell.
Figures

Update of
-
DNA-guided transcription factor cooperativity shapes face and limb mesenchyme.bioRxiv [Preprint]. 2023 May 29:2023.05.29.541540. doi: 10.1101/2023.05.29.541540. bioRxiv. 2023. Update in: Cell. 2024 Feb 1;187(3):692-711.e26. doi: 10.1016/j.cell.2023.12.032. PMID: 37398193 Free PMC article. Updated. Preprint.
Similar articles
-
DNA-guided transcription factor cooperativity shapes face and limb mesenchyme.bioRxiv [Preprint]. 2023 May 29:2023.05.29.541540. doi: 10.1101/2023.05.29.541540. bioRxiv. 2023. Update in: Cell. 2024 Feb 1;187(3):692-711.e26. doi: 10.1016/j.cell.2023.12.032. PMID: 37398193 Free PMC article. Updated. Preprint.
-
Preaxial polydactyly: interactions among ETV, TWIST1 and HAND2 control anterior-posterior patterning of the limb.Development. 2010 Oct;137(20):3417-26. doi: 10.1242/dev.051789. Epub 2010 Sep 8. Development. 2010. PMID: 20826535 Free PMC article.
-
Intrinsic DNA binding properties demonstrated for lineage-specifying basic helix-loop-helix transcription factors.Genome Res. 2018 Apr;28(4):484-496. doi: 10.1101/gr.224360.117. Epub 2018 Mar 2. Genome Res. 2018. PMID: 29500235 Free PMC article.
-
Mechanisms of Binding Specificity among bHLH Transcription Factors.Int J Mol Sci. 2021 Aug 24;22(17):9150. doi: 10.3390/ijms22179150. Int J Mol Sci. 2021. PMID: 34502060 Free PMC article. Review.
-
Basic Helix-Loop-Helix (bHLH) Transcription Factors Regulate a Wide Range of Functions in Arabidopsis.Int J Mol Sci. 2021 Jul 1;22(13):7152. doi: 10.3390/ijms22137152. Int J Mol Sci. 2021. PMID: 34281206 Free PMC article. Review.
Cited by
-
Detection of regions of homozygosity in an unusual case of frontonasal dysplasia.Mol Cytogenet. 2024 Oct 31;17(1):25. doi: 10.1186/s13039-024-00693-1. Mol Cytogenet. 2024. PMID: 39482767 Free PMC article.
-
Systematic Dissection of Sequence Features Affecting the Binding Specificity of a Pioneer Factor Reveals Binding Synergy Between FOXA1 and AP-1.bioRxiv [Preprint]. 2023 Nov 11:2023.11.08.566246. doi: 10.1101/2023.11.08.566246. bioRxiv. 2023. Update in: Mol Cell. 2024 Aug 8;84(15):2838-2855.e10. doi: 10.1016/j.molcel.2024.06.022. PMID: 37986839 Free PMC article. Updated. Preprint.
-
Transfer learning reveals sequence determinants of the quantitative response to transcription factor dosage.bioRxiv [Preprint]. 2024 May 29:2024.05.28.596078. doi: 10.1101/2024.05.28.596078. bioRxiv. 2024. PMID: 38853998 Free PMC article. Preprint.
-
Target gene responses differ when transcription factor levels are acutely decreased by nuclear export versus degradation.Development. 2024 Nov 1;151(21):dev202775. doi: 10.1242/dev.202775. Epub 2024 Nov 8. Development. 2024. PMID: 39397716 Free PMC article.
-
ARID1A-BAF coordinates ZIC2 genomic occupancy for epithelial-to-mesenchymal transition in cranial neural crest specification.Am J Hum Genet. 2024 Oct 3;111(10):2232-2252. doi: 10.1016/j.ajhg.2024.07.022. Epub 2024 Sep 2. Am J Hum Genet. 2024. PMID: 39226899 Free PMC article.
References
MeSH terms
Substances
Grants and funding
LinkOut - more resources
Full Text Sources
Molecular Biology Databases
Research Materials
Miscellaneous
