[Preprint]. 2024 Jan 2:2024.01.02.573943.
doi: 10.1101/2024.01.02.573943.

De Novo Atomic Protein Structure Modeling for Cryo-EM Density Maps Using 3D Transformer and Hidden Markov Model

Affiliations

De Novo Atomic Protein Structure Modeling for Cryo-EM Density Maps Using 3D Transformer and Hidden Markov Model

Nabin Giri et al. bioRxiv. .

Update in

Abstract

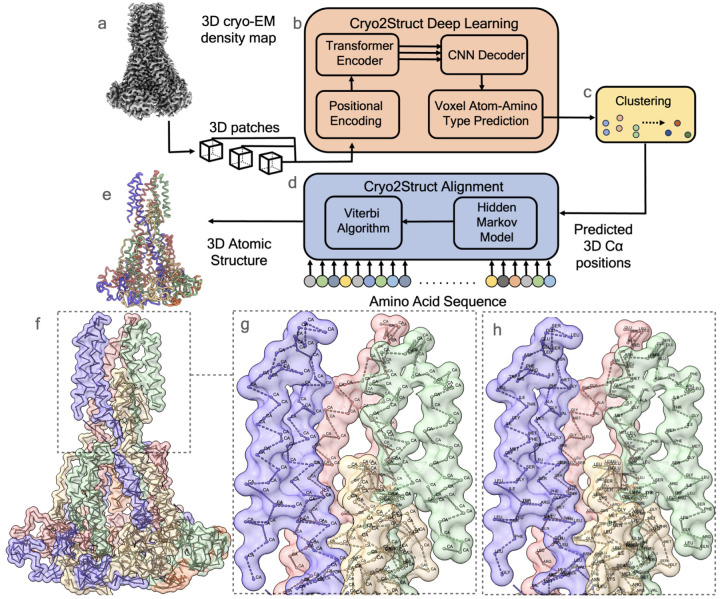
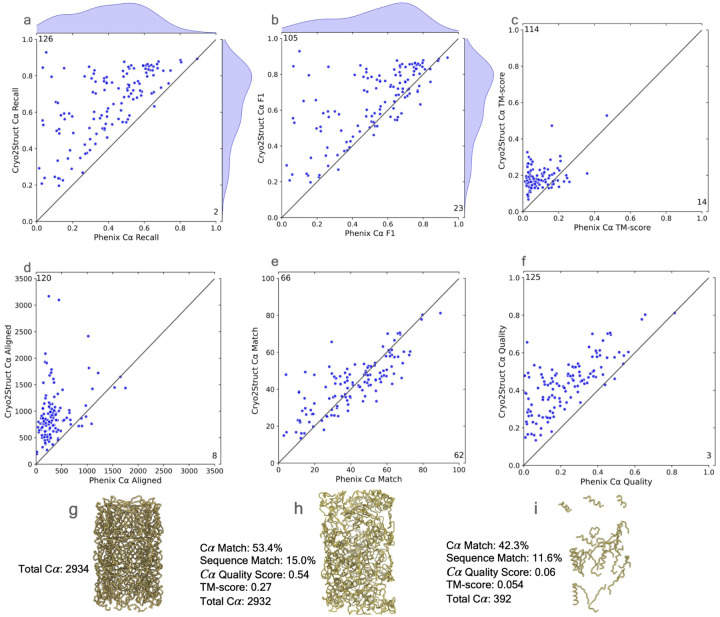
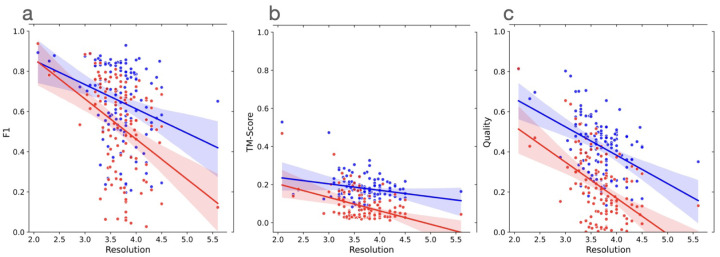
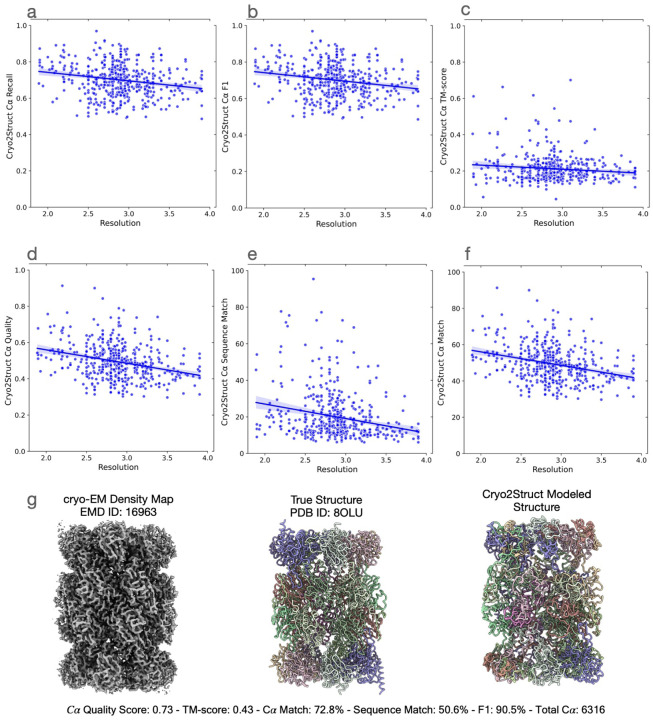
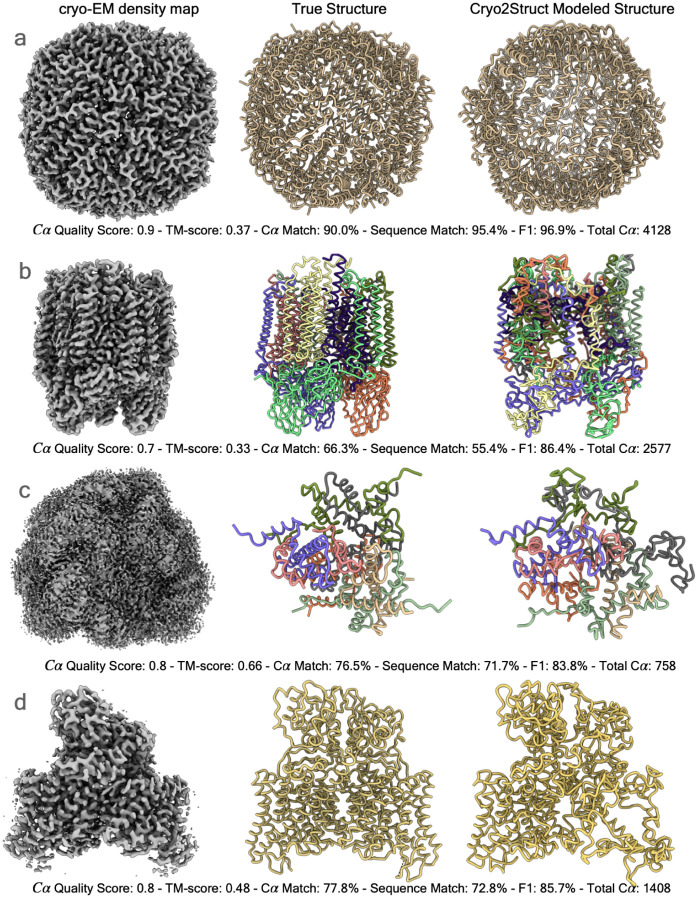
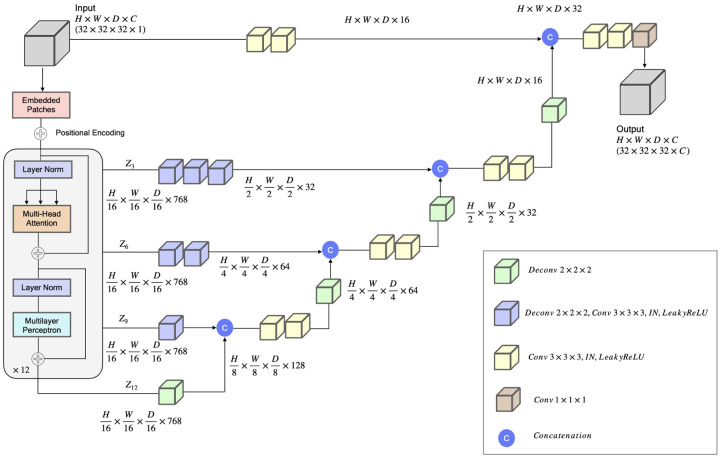
Accurately building three-dimensional (3D) atomic structures from 3D cryo-electron microscopy (cryo-EM) density maps is a crucial step in the cryo-EM-based determination of the structures of protein complexes. Despite improvements in the resolution of 3D cryo-EM density maps, the de novo conversion of density maps into 3D atomic structures for protein complexes that do not have accurate homologous or predicted structures to be used as templates remains a significant challenge. Here, we introduce Cryo2Struct, a fully automated ab initio cryo-EM structure modeling method that utilizes a 3D transformer to identify atoms and amino acid types in cryo-EM density maps first, and then employs a novel Hidden Markov Model (HMM) to connect predicted atoms to build backbone structures of proteins. Tested on a standard test dataset of 128 cryo-EM density maps with varying resolutions (2.1 - 5.6 °A) and different numbers of residues (730 - 8,416), Cryo2Struct built substantially more accurate and complete protein structural models than the widely used ab initio method - Phenix in terms of multiple evaluation metrics. Moreover, on a new test dataset of 500 recently released density maps with varying resolutions (1.9 - 4.0 °A) and different numbers of residues (234 - 8,828), it built more accurate models than on the standard dataset. And its performance is rather robust against the change of the resolution of density maps and the size of protein structures.

Keywords: Hidden Markov Model; atomic protein structure modeling; cryo-EM; deep learning; transformer.


Conflict of interest statement

Conflict of interest. The authors declare no conflict of interest.

Figures

Fig. 1
Fig. 1
An overview of the automated prediction workflow of Cryo2Struct. Given a 3D cryo-EM density map of a protein as input (a), the Deep Learning block based on a transformer (b) generates a voxel-wise prediction of Cα atoms and their amino acid type. A clustering step (c) is used to merge nearby predicted Cα atoms into one atom to remove redundancy. The predicted Cα atoms and their amino acid type probabilities are used by the Alignment block (d) to build a Hidden Markov Model (HMM), which is used by a customized Viterbi Algorithm to align the sequence of the protein with it to generate a 3D backbone atomic structure for the protein (e). (f) shows the skeleton of the Cryo2Struct modeled structure for a test cryo-EM density map released on September 13, 2023 (EMD ID: 41624; resolution 2.8Å), where each chain is colored differently. (g) depicts the connected Cα atoms, and (h) shows the amino acid types assigned to the Cα atoms; the modeled structure has 1,585 amino acid residues; and the F1 score of Cα atom prediction is 89.1%.
Fig. 2
Fig. 2
The comparative analysis of atomic models built for 128 test cryo-EM maps by CryoStruct and Phenix in terms of six metrics. In each panel of an evaluation metric, the score of the model built by CryoStruct for each map is plotted against that by Phenix for the same map. A dot above the 45 degree line indicates that CryoStruct has higher score than Phenix for the map. The number in the top-left corner represents the total number of maps on which CryoStruct has higher scores, while the number in the bottom-right corner denotes the total number of maps on which Phenix has higher scores. (a) The Cα recall of the atomic models of CryoStruct against Phenix; the recall is defined as the number of Cα atoms in the predicted model that are placed within 3Å of the correct position in the corresponding known structure, divided by the total number of Cα atoms in the known structure. (b) The F1 score of Cα, which is the harmonic mean of precision and recall of Cα; it is a balanced measure quantifying a method’s ability to make accurate Cα predictions while also capturing as many Cα atoms as possible. (c) The TM-score of the atomic models normalized by the length of the known structure; the normalized TM-score is calculated by using US-align to align the atomic models with their corresponding known structures. (d) The length of aligned Cα atoms; it is calculated by using US-align to align the predicted model and the known structure. (e) The Cα match score of the atomic models; it is calculated by using Phenix.chain comparison tool to compare them with the known structures. (f) The Cα quality score; it is the product of the Cα match score and the total number of predicted residues divided by the total number of residues in the experimental structure; the total number of predicted residues is calculated by Phenix.chain comparison tool. (g) The true structure of EMD ID: 8767 (PDB ID: 5W5F); the map was released on 2017-08-16 with resolution of 3.4 Å. (h) The Cyo2Struct model and its scores. (i) The Phenix model and its scores.
Fig. 3
Fig. 3
The plots of the scores (F1 score, global normalized TM-score, and Cα quality score) of the models built by Cryo2Struct and Phenix against the resolution of the 128 cryo-EM density maps. Blue dots denote Cryo2Struct constructed models and red dots the Phenix models. The solid lines depict linear regression lines, and the colored area represents a 95% confidence interval. The confidence interval is narrower (i.e., the linear estimation is more certain) in the resolution range [3°A- 4.5°A] where there are more data points. (a) F1 score against resolution. The equation of the regression line for Cryo2Struct (blue) is y = −0.1209x + 1.0966, while for Phenix (red), it is y = −0.1998x + 1.2618. The correlation between F1 score of Cryo2Struct and the resolution is −0.28, while for Phenix, it is −0.40. (b) The normalized global TM-score against resolution. The equation of the regression line for Cryo2Struct is y = −0.0339x + 0.3057, while for Phenix, it is −0.0706x + 0.3447. The correlation for Cryo2Struct is −0.24, while for Phenix, it is −0.43. (c) Cα quality score against resolution. The equation of the regression line for Cryo2Struct is −14.1318x + 94.8512, while for Phenix, it is −17.9190x + 88.6207. The correlation for Cryo2Struct is −0.43, while for Phenix it is −0.49.
Fig. 4
Fig. 4
The quality of atomic models built for 500 test cryo-EM maps. The solid lines depict linear regression lines, and the colored area represents a 95% confidence interval. (a) The Cα recall versus resolution; the regression equation: −0.0466x+ 0.8350; Pearson’s correlation: −0.201. (b) The F1 score versus resolution; the regression equation: −0.0468x + 0.8357; the correlation: −0.202. (c) The normalized TM-score versus resolution; the regression equation: −0.0222x + 0.2762; the correlation: −0.11. (d) The Cα quality score versus resolution; the regression equation: −0.0741x+0.7080; the correlation: −0.298. (e) The Cα sequence match score versus resolution; the regression equation: −7.9226x + 42.8422; the correlation: −0.234. (f) The Cα match score versus resolution; the regression equation: −7.4408x + 70.8924; the correlation: −0.299. (g) A modeling example. One on the left is the density map (EMD ID: 16963), in the middle is the true structure (PDB ID: 8OLU), and on the right is the model built by Cryo2Struct. The structure is a hetero 28-mer with a stoichiometry of A2B2C2D2E2F2G2H2I2J2K2L2M2N2 and a weight of 848.37 kDa. The total number of modeled Cα atoms is 6,316.
Fig. 5
Fig. 5
The high-quality models built for four test cryo-EM maps. In each panel from left to right are the cryo-EM density map, the true structure, and the model built by Cryo2Struct. The chains in both the true structure and the model are colored with distinct colors. The total Cα number shown in each panel is the total number of residues in a model. (a) The result for EMD ID: 17961 (PDB ID: 8PVC, released on 2023-11-29, and resolution of 2.6 °A). (b) The result for EMD ID: 17287 (PDB ID: 8OYI, released on 2023-11-08, and resolution of 2.2 °A. (c) The result for EMD ID: 37070 (PDB ID: 8KB5, released on 2023-10-18, and resolution of 2.26 Å). (d) The result for EMD ID: 35299 (PDB ID: 8IAB, released on 2023-08-02, resolution of 2.96 Å).
Fig. 6
Fig. 6
The deep Learning architecture for backbone atom and amino acid type classification. The network takes a 32×32×32 sub-grid of cryo-EM density map as an input with one channel representing the density value of voxels. The input is divided into a series of patches. The patches are projected into an embedding space by a 3D convolution layer, and then is added with a positional encoding. The patches are then processed by an encoder, comprising 12 identical blocks each with a normalization layer, a multi-head self-attention layer, a normalization layer, and a multi-layer perceptron (MLP). The encoded features of blocks 3, 6, 9 and 12 denoted as (z3,z6,z9,z12) and the original input are integrated into the decoders via skip connections in a U-Net fashion, each of which includes convolution and deconvolution layers with instance normalization (IN), Leaky ReLU activation, and feature concatenation. The last hidden features are used by a 1 × 1 × 1 convolution layer to generate the final 3D sub-grid output of the same size as the input, i.e., 32 × 32 × 32, with (C) output channels (i.e., 4 for the backbone atom type classification (Cα, N, C and the absence of an atom) and 21 for the amino acid type classification (20 standard amino acids and no/unknown amino acid). The amino acid-type classification model has 92.281893 million parameters, whereas the atom type classification model has 92.281604 million parameters.

Similar articles

References

    1. Giri Nabin and Cheng Jianlin. Improving protein–ligand interaction modeling with cryo-em data, templates, and deep learning in 2021 ligand model challenge. Biomolecules, 13(1):132, 2023. - PMC - PubMed
    1. Soltanikazemi Elham, Roy Raj S, Qua dir Farhan, Giri Nabin, Morehead Alex, and Cheng Jianlin. Drlcomplex: Reconstruction of protein quaternary structures using deep reinforcement learning. arXiv preprint arXiv:2205.13594, 2022.
    1. Dhakal Ashwin, McKay Cole, Tanner John J, and Cheng Jianlin. Artificial intelligence in the prediction of protein–ligand interactions: recent advances and future directions. Briefings in Bioinformatics, 23(1):bbab476, 2022. - PMC - PubMed
    1. Boadu Frimpong, Cao Hongyuan, and Cheng Jianlin. Combining protein sequences and structures with transformers and equivariant graph neural networks to predict protein function. bioRxiv, pages 2023–01, 2023. - PMC - PubMed
    1. Bai Xiao-Chen, McMullan Greg, and Scheres Sjors HW. How cryo-em is revolutionizing structural biology. Trends in biochemical sciences, 40(1):49–57, 2015. - PubMed

Publication types