[Preprint]. 2024 May 21:2024.01.01.573836.
doi: 10.1101/2024.01.01.573836.

Loss of dihydroceramide desaturase drives neurodegeneration by disrupting endoplasmic reticulum and lipid droplet homeostasis in glial cells

Affiliations

Loss of dihydroceramide desaturase drives neurodegeneration by disrupting endoplasmic reticulum and lipid droplet homeostasis in glial cells

Yuqing Zhu et al. bioRxiv. .

Abstract

Dihydroceramide desaturases convert dihydroceramides to ceramides, the precursors of all complex sphingolipids. Reduction of DEGS1 dihydroceramide desaturase function causes pediatric neurodegenerative disorder hypomyelinating leukodystrophy-18 (HLD-18). We discovered that infertile crescent (ifc), the Drosophila DEGS1 homolog, is expressed primarily in glial cells to promote CNS development by guarding against neurodegeneration. Loss of ifc causes massive dihydroceramide accumulation and severe morphological defects in cortex glia, including endoplasmic reticulum (ER) expansion, failure of neuronal ensheathment, and lipid droplet depletion. RNAi knockdown of the upstream ceramide synthase schlank in glia of ifc mutants rescues ER expansion, suggesting dihydroceramide accumulation in the ER drives this phenotype. RNAi knockdown of ifc in glia but not neurons drives neuronal cell death, suggesting that ifc function in glia promotes neuronal survival. Our work identifies glia as the primary site of disease progression in HLD-18 and may inform on juvenile forms of ALS, which also feature elevated dihydroceramide levels.

Keywords: DEGS1; ceramide; endoplasmic reticulum; glia; leukodystrophy; lipid droplet; neurodegeneration; sphingolipids.


Conflict of interest statement

Declaration of interests: G.J.P. has collaborative research agreements with Agilent Technologies and Thermo Scientific. G.J.P. is the chief scientific officer of Panome Bio. The remaining authors declare no competing interests.

Figures

Figure 1.
Figure 1.
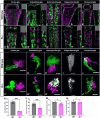
ifc regulates CNS and glial morphology. A) Ventral views of late-third instar larvae of indicated genotype showing 3xP3 RFP labeling of CNS and nerves. Arrowheads indicate nerve bulges; scale bar is 200μm. B-B’) Schematic of Ifc (B) and human DEGS1 (B’) proteins indicating location and nature of ifc mutations and 15 HLD-18-causing DEGS1 mutations.,, C) Schematic of de novo ceramide biosynthesis pathway indicating the subcellular location of ceramide synthesis and ceramide modifications. D) Chemical structure of dihydroceramide and ceramide; arrow indicates trans carbon-carbon double bond between C4 and C5 in the sphingoid backbone created by the enzymatic action of Ifc/DEGS1. E) Normalized quantification of the relative levels of dihydroceramide, ceramide, and six related sphingolipid species in the dissected CNS of wild-type and ifc−/− late-third instar larvae. F) Ventral views of Drosophila CNS and peripheral nerves in wild-type and ifc−/− mutant late-third instar larvae labeled for NCAD to mark the neuropil, HRP to label axons, RFP to label glia, Dpn to label neuroblasts, ELAV to label neurons, and FABP to label cortex glia. Anterior is up; scale bar is 100μm for whole CNS images and 20μm for peripheral nerve image. Statistics: * denotes p < 0.05, ** denotes p < 0.01, *** denotes p < 0.001, **** denotes p < 0.0001.
Figure 2.
Figure 2.
Loss of ifc disrupts glial morphology. A-E’) High magnification ventral views and X-Z and Y-Z projections of the nerve cord of wildtype and ifc−/− late third instar larvae labeled for ELAV (magenta) for neurons and Myr-GFP (green) for cell membranes of indicated glial subtype. Anterior is up; scale bar is 40μm. F-J’) High magnification views of individual glial cells of indicated glial subtype in the nerve cord of wildtype and ifc−/− larvae created by the MultiColor-FlpOut method. Anterior is up; scale bar is 20μm. K-N) Quantification of total number of indicated glial subtype in the nerve cord of wildtype and ifc−/− late third instar larvae (n = 7 for K, L, N; n = 6 for M). Statistics: * denotes p < 0.05, **** denotes p < 0.0001, and ns, not significant.
Figure 3.
Figure 3.
ifc acts in glia to regulate CNS structure and glial morphology. A-I) Ventral views of photomontages of the CNS of late third instar larvae labeled for FABP (greyscale) to mark cortex glia in late third instar larvae of indicated genotype. Neuronal-specific transgene expression was achieved by using elav-GAL4 combined with repo-GAL80; glial-specific transgene expression was achieved by using repo-GAL4. J-K) Quantification of the number of swollen cortex glia in the abdominal segments of the CNS of late-third instar larvae of the indicated genotype for the RNAi (J) and gene rescue assays (K). Statistics: * denotes p < 0.05, ** denotes p < 0.01, *** denotes p < 0.001, **** denotes p < 0.0001, and ns, not significant.
Figure 4.
Figure 4.
Loss of ifc drives ER expansion in cortex glia. A-E) Dorsal (A, B-B’’, and C-C’’) and ventral (D-D’’ and E-E’’) views of the CNS of late-third instar wild-type larvae labeled for ifc RNA (grey in A; magenta in B’), ifc-GAL4>nRFP (magenta; C’-E’), EBONY to mark astrocytes (green; B and C), REPO to mark glia (green; D), and ELAV to mark neurons (green; E). Panels D-D’’ and E-E’’ show surface and interior views, respectively, along the Z-axis on the ventral side of the nerve cord. Arrowheads in E-E’’ identify neurons with low level ifc-GAL4 expression. F-G) High magnification ventral views of thoracic segments in the CNS of wild-type late third instar larvae labeled for GFP (green; F and G), CNX99A (magenta; F’), ESYT (magenta; G’). H-M) Late third instar larvae of indicated genotype labeled for 3xP3-RFP (green; H’-M’), CNX99A (magenta; H and K), GOLGIN84 (magenta; I and L), and LAMP (magenta; J and M). Anterior is up; scale bar is 100μm for panel A and 30μm for panels B-M.
Figure 5.
Figure 5.
Loss of ifc leads to internal membrane accumulation and lipid droplet loss in cortex glia. A-E’) TEM images of cortex glia cell body (A-A’ and B-B’) and neuronal cell bodies (C-C’ and D-D’) at low (A-A’) and high (B-B’, C-C’, and D-D’) magnification in the nerve cord of wildtype (A-D) and ifc−/− (A’-D’ and E-E’) late third instar larvae. (A-A’) Dotted lines demarcate cell boundary of cortex glia; yellow squares highlight regions magnified in B, B’, and E’. Scale bar is 3μm for A and A’ and 1μm for B-B’. (B-B’) Cy denotes cytoplasm; Nu denotes nucleus. Solid white arrows highlight the layered internal membranes that occupy the cytoplasm of ifc−/− cortex glia. (C-C’ and D-D’) Black arrows highlight cortex glia membrane extensions that enwrap neuronal cell bodies; hollow white arrows denote the absence of cortex glia membrane extensions; white asterisk denotes lipid droplets. Scale bar is 2μm. E-E’) An additional example of membrane-filled cortex glia cell body in ifc−/− larvae. Scale bar is 2μm for E and 1μm for E’. F) Cortex glia in ifc mutant larvae labeled for Myr-GFP (green) to label membranes and CNX99A to label ER membranes. Scale bar is 30μm. G-H) Black and white and colored TEM cross-sections of peripheral nerves in wild type and ifc−/− late-third instar larvae. Blue marks perineurial glia; purple marks subperineurial glia; pink marks wrapping glia. Scale bar: 2μm. I-I’) High magnification ventral views of abdominal segments in the ventral nerve cord of wild-type (I) and ifc mutant (I’) third instar larvae labeled for BODIPY (green) to mark lipid droplets and FABP (magenta) to label cortex glia. Anterior is up; scale bar is 30μm. J) Graph of log-fold change of transcription of five genes that promote membrane lipid synthesis in ifc−/− larvae relative to wildtype. K-M) Quantification of the number (G) and area of lipid droplets (H and I) in the dissected CNS of wildtype and ifc−/− larvae. Statistics: * denotes p < 0.05, ** denotes p < 0.01, *** denotes p < 0.001, **** denotes p < 0.0001, and ns, not significant.
Figure 6.
Figure 6.
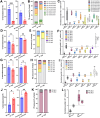
PC, PE, PS, and TG exhibit higher saturation levels in a CNS-specific manner in ifc mutant late third instar larvae. A-C) Quantification of total (A) and species-specific (B and C) TGs in whole larvae (A and C) and dissected CNS (A, B, and C) of wildtype and ifc−/− larvae. D-F). Quantification of total (D) and species-specific (E and F) PCs in whole larvae (D and F) and dissected CNS (D, E, and F) of wildtype and ifc−/− larvae. G-I) Quantification of total (G) and species-specific (H and I) PEs in whole larvae (G and H) and dissected CNS (G, H, and I) of wild-type and ifc−/− larvae. J-L) Quantification of total (J) and species-specific (K and L) PSs in the whole larvae (J and L) and dissected CNS (J, K, and L) of wild-type and ifc−/− larvae. Statistics: * denotes p < 0.05, ** denotes p < 0.01, *** denotes p < 0.001, **** denotes p < 0.0001, and ns, not significant.
Figure 7.
Figure 7.
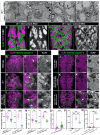
Glial-specific knockdown of ifc triggers neuronal cell death. A-D) TEM images of cortex glia cell body (A and B) and neuronal cell bodies (C and D) at low (A) and high (B, C, and D) magnifications in the nerve cord of ifc−/−; repo>schlank RNAi late third instar larvae. Dotted lines demarcate cell boundary of cortex glia; yellow squares highlight regions magnified in A. Scale bar: 3μm for A, 1μm for B, and 2μm for C and D. (B) Cy denotes cytoplasm; Nu denotes nucleus. (C-D) Black asterisk denotes lipid droplets. E-F) Ventral views of abdominal sections of CNS of ifc−/−; UAS-schlank RNAi/+ larvae (E) and ifc−/−; repoGAL4/UAS-schlank RNAi larvae (F) labeled for neurons (ELAV, Green) and cortex glia (FABP, magenta/grey). Scale bar is 30μm for E-F. G-L) Low (G-L) and high (G’-L’ and G’’-L’’) magnification views of the brain (G-I) and nerve cord (J-L) of late-third instar larvae of the indicated genotypes labeled for ELAV (magenta or greyscale) and Caspase-3 (green). Arrows indicate regions of high Caspase-3 signal and/or apparent neuronal cell death identified by perforations in the neuronal cell layer. Scale bar is 50μm for panels G-L and 10μm for panels G’-L’’. M-N) Quantification of CNS elongation (M) and 3xP3 RFP intensity (N) in ifc mutants alone, ifc mutants with one copy of schlank[G0365] loss-of-function allele, or ifc mutants in which schlank function is reduced via RNAi in glial cells. O) Quantification of the area of lipid droplets in dissected CNS of ifc mutants and ifc mutants in which schlank function is reduced via RNAi in glial cells. Anterior is up in all panels. P-Q) Quantification of Cleaved Caspase-3 neurons for panels G-I (P) and J-L (Q). Statistics: * denotes p < 0.05, ** denotes p < 0.01, *** denotes p < 0.001, **** denotes p < 0.0001, and ns, not significant.

Similar articles

References

    1. Jackman N., Ishii A., & Bansal R. (2009). Oligodendrocyte development and myelin biogenesis: parsing out the roles of glycosphingolipids. Physiology, 24(5), 290–297. - PMC - PubMed
    1. Ghosh A., Kling T., Snaidero N., Sampaio J. L., Shevchenko A., Gras H., … & Simons M. (2013). A global in vivo Drosophila RNAi screen identifies a key role of ceramide phosphoethanolamine for glial ensheathment of axons. PLoS genetics, 9(12), e1003980. - PMC - PubMed
    1. Vacaru A. M., van den Dikkenberg J., Ternes P., & Holthuis J. C. (2013). Ceramide Phosphoethanolamine Biosynthesis in Drosophila Is Mediated by a Unique Ethanolamine Phosphotransferase in the Golgi Lumen. Journal of Biological Chemistry, 288(16), 11520–11530. - PMC - PubMed
    1. Hannun Y. A., & Obeid L. M. (2018). Sphingolipids and their metabolism in physiology and disease. Nature reviews Molecular cell biology, 19(3), 175–191. - PMC - PubMed
    1. Li L., Tang X., Taylor K. G., DuPré D. B., & Yappert M. C. (2002). Conformational characterization of ceramides by nuclear magnetic resonance spectroscopy. Biophysical journal, 82(4), 2067–2080. - PMC - PubMed

Publication types