Dissecting tumor microenvironment heterogeneity in syngeneic mouse models: insights on cancer-associated fibroblast phenotypes shaped by infiltrating T cells
- PMID: 38259467
- PMCID: PMC10800379
- DOI: 10.3389/fimmu.2023.1320614
Dissecting tumor microenvironment heterogeneity in syngeneic mouse models: insights on cancer-associated fibroblast phenotypes shaped by infiltrating T cells
Abstract
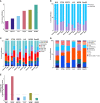
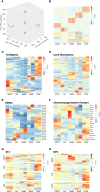
Murine syngeneic tumor models have been used extensively for cancer research for several decades and have been instrumental in driving the discovery and development of cancer immunotherapies. These tumor models are very simplistic cancer models, but recent reports have, however, indicated that the different inoculated cancer cell lines can lead to the formation of unique tumor microenvironments (TMEs). To gain more knowledge from studies based on syngeneic tumor models, it is essential to obtain an in-depth understanding of the cellular and molecular composition of the TME in the different models. Additionally, other parameters that are important for cancer progression, such as collagen content and mechanical tissue stiffness across syngeneic tumor models have not previously been reported. Here, we compare the TME of tumors derived from six common syngeneic tumor models. Using flow cytometry and transcriptomic analyses, we show that strikingly unique TMEs are formed by the different cancer cell lines. The differences are reflected as changes in abundance and phenotype of myeloid, lymphoid, and stromal cells in the tumors. Gene expression analyses support the different cellular composition of the TMEs and indicate that distinct immunosuppressive mechanisms are employed depending on the tumor model. Cancer-associated fibroblasts (CAFs) also acquire very different phenotypes across the tumor models. These differences include differential expression of genes encoding extracellular matrix (ECM) proteins, matrix metalloproteinases (MMPs), and immunosuppressive factors. The gene expression profiles suggest that CAFs can contribute to the formation of an immunosuppressive TME, and flow cytometry analyses show increased PD-L1 expression by CAFs in the immunogenic tumor models, MC38 and CT26. Comparison with CAF subsets identified in other studies shows that CAFs are skewed towards specific subsets depending on the model. In athymic mice lacking tumor-infiltrating cytotoxic T cells, CAFs express lower levels of PD-L1 and lower levels of fibroblast activation markers. Our data underscores that CAFs can be involved in the formation of an immunosuppressive TME.
Keywords: PD-L1; cancer-associated fibroblasts; immunosuppressive mechanisms; immunotherapy; stroma; syngeneic mouse cancer models; tissue stiffness; tumor microenvironment.
Copyright © 2024 Carretta, Thorseth, Schina, Agardy, Johansen, Baker, Khan, Rømer, Fjæstad, Linder, Kuczek, Donia, Grøntved and Madsen.
Conflict of interest statement
The authors declare that the research was conducted in the absence of any commercial or financial relationships that could be construed as a potential conflict of interest.
Figures


Similar articles
-
IR-780 Dye-based Targeting of Cancer-associated Fibroblasts Improves Cancer Immunotherapy by Increasing Intra-tumoral T Lymphocytes Infiltration.Curr Cancer Drug Targets. 2024;24(6):642-653. doi: 10.2174/0115680096261142231018104854. Curr Cancer Drug Targets. 2024. PMID: 38310462
-
Immune checkpoint inhibitors as mediators for immunosuppression by cancer-associated fibroblasts: A comprehensive review.Front Immunol. 2022 Oct 5;13:996145. doi: 10.3389/fimmu.2022.996145. eCollection 2022. Front Immunol. 2022. PMID: 36275750 Free PMC article. Review.
-
Fibroblast Isolation from Mammary Gland Tissue and Syngeneic Murine Breast Cancer Models.Methods Mol Biol. 2023;2614:171-185. doi: 10.1007/978-1-0716-2914-7_12. Methods Mol Biol. 2023. PMID: 36587126
-
Crosstalk between cancer-associated fibroblasts and immune cells in the tumor microenvironment: new findings and future perspectives.Mol Cancer. 2021 Oct 11;20(1):131. doi: 10.1186/s12943-021-01428-1. Mol Cancer. 2021. PMID: 34635121 Free PMC article. Review.
-
Comparing syngeneic and autochthonous models of breast cancer to identify tumor immune components that correlate with response to immunotherapy in breast cancer.Breast Cancer Res. 2021 Aug 5;23(1):83. doi: 10.1186/s13058-021-01448-1. Breast Cancer Res. 2021. PMID: 34353349 Free PMC article.
References
Publication types
MeSH terms
Substances
Grants and funding
LinkOut - more resources
Full Text Sources
Molecular Biology Databases
Research Materials

