. 2024 Jan 5;25(2):714.
doi: 10.3390/ijms25020714.

Proline Dehydrogenase (PRODH) Is Expressed in Lung Adenocarcinoma and Modulates Cell Survival and 3D Growth by Inducing Cellular Senescence

Affiliations

Proline Dehydrogenase (PRODH) Is Expressed in Lung Adenocarcinoma and Modulates Cell Survival and 3D Growth by Inducing Cellular Senescence

Sarah Grossi et al. Int J Mol Sci. .

Abstract

The identification of markers for early diagnosis, prognosis, and improvement of therapeutic options represents an unmet clinical need to increase survival in Non-Small Cell Lung Cancer (NSCLC), a neoplasm still characterized by very high incidence and mortality. Here, we investigated whether proline dehydrogenase (PRODH), a mitochondrial flavoenzyme catalyzing the key step in proline degradation, played a role in NSCLC tumorigenesis. PRODH expression was investigated by immunohistochemistry; digital PCR, quantitative PCR, immunoblotting, measurement of reactive oxygen species (ROS), and functional cellular assays were carried out. PRODH expression was found in the majority of lung adenocarcinomas (ADCs). Patients with PRODH-positive tumors had better cancer-free specific and overall survival compared to those with negative tumors. Ectopic modulation of PRODH expression in NCI-H1299 and the other tested lung ADC cell lines decreased cell survival. Moreover, cell proliferation curves showed delayed growth in NCI-H1299, Calu-6 and A549 cell lines when PRODH-expressing clones were compared to control clones. The 3D growth in soft agar was also impaired in the presence of PRODH. PRODH increased reactive oxygen species production and induced cellular senescence in the NCI-H1299 cell line. This study supports a role of PRODH in decreasing survival and growth of lung ADC cells by inducing cellular senescence.

Keywords: adenocarcinoma cell lines; cell-based assays; cellular senescence; immunohistochemical analysis; lung cancer; proline dehydrogenase.


Conflict of interest statement

The authors declare no conflicts of interest.

Figures

Figure 1
Figure 1
Proline dehydrogenase (PRODH) is expressed in the majority of lung adenocarcinomas (ADC) and represents a prognostically favorable factor. (A) Representative results of PRODH immunostaining. Lung ADC: (a) Acinar ADC (hematoxylin–eosin, 200×) with (b) abundant and intense cytoplasmic granular PRODH immunoreactivity (diaminebenzidine (DAB)-hematoxylin, 100×, particular 400×); (c) Acinar ADC (hematoxylin–eosin, 200×) with (d) weak cytoplasmic PRODH immunoreactivity (DAB-hematoxylin, 400×); (e) predominantly solid lung ADC (hematoxylin–eosin, 200×) with (f) no PRODH immunoreactivity (DAB-hematoxylin, 200×). Lung squamocellular carcinoma (SCC): (g) SCC (hematoxylin–eosin, 200×) displaying (h) weak, diffuse cytoplasmic PRODH staining (DAB-hematoxylin, 200×, inset 400×); (i) SCC devoid of PRODH immunoreactivity (DAB-hematoxylin, 200×). (j) Healthy lung parenchyma, showing rare PRODH-positive cells, corresponding to type II pneumocytes and Clara cells (black arrows, DAB-hematoxylin, 400×). The bars indicate 100 μm. (B) The increase in PRODH protein levels in immunohistochemistry is paralleled by an increase in transcript levels in quantitative PCR (qPCR). Positive: lung ADC cases with elevated expression of PRODH protein; negative: lung ADC cases with low or no expression of PRODH protein. A small Delta Ct (cycle threshold) value indicates high transcript levels (Ct for PRODH similar to that of the reference gene). Horizontal lines indicate the mean value. Asterisks indicate that there is a significant difference (** p-value = 0.0099, ANOVA test). (C) Kaplan–Meier curves reporting cancer-specific survival for the cohort under study. Cancer-specific survival for ADC samples with high or low PRODH expression levels from this study (cutoff value was 25%, p-value = 0.0595, chi-squared test). (D) Kaplan–Meier curves reporting overall survival from the KMplotter database for lung ADC samples. Overall survival for ADC samples with high or low PRODH expression (p-value = 0.00048, chi-squared test) [27].
Figure 2
Figure 2
Evaluation of endogenous PRODH expression in a panel of lung ADC cell lines. Expression analysis was carried out at the transcript level using droplet digital PCR. Results are expressed as copies of transcript/microliter of PCR reaction. As the same RNA (ribonucleic acid) and cDNA (complementary deoxyribonucleic acid) volumes were used for all cell lines, these data are directly comparable. Western blots of extracts from the indicated cell lines were detected with PRODH antibody and with alpha-tubulin for normalization. The graph below the Western blots represents the relative expression of PRODH protein in percentage after normalization (ratio PRODH/alpha-tubulin × 100). The uncropped original western blots have been submitted in the Supplementary Materials as Figures S1 and S2.
Figure 3
Figure 3
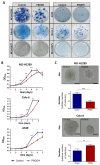
PRODH modulation affects survival and growth of lung ADC cell lines. (A) Clonogenic assays. The pictures show representative clonogenic assays carried out in the NCI-H1299, A549, Calu-6, SK LU-1, NCI-H1437 and NCI-H1975 cell lines. Petri dishes with 60 mm diameter were used for the experiments. Control: cells were transfected with pcDNA3.1 vector; PRODH: pcDNA3.1-PRODH (PRODH overexpression). (B) Growth curves. 3-(4,5-dimethylthiazol-2-yl)-2,5-diphenyltetrazolium bromide (MTT) assay was used to evaluate cell growth of PRODH-expressing or control clones from the indicated cell lines. The curves are the average of four PRODH-expressing clones and two control clones from the NCI-H1299 cell line, one PRODH-expressing and one control clone from the A549 and Calu-6 cell lines. Asterisks indicate significant differences in the growth of the two types of clones (Student’s t-test; * indicates p-value < 0.05; *** indicates p-value < 0.001; **** indicates p-value < 0.0001). (C) Soft agar assay. Representative pictures of colonies obtained with control or PRODH-expressing clones. The bar indicates 150 µm. For each clone tested, cells were plated at very low seeding density (5 × 10² cells/mL) and grown in soft agar for 16 days. The colonies were counted for each clone and each replicate and the average number of colonies obtained from PRODH-expressing clones was plotted relative to the number of colonies obtained for control clones. The data represent the mean of triplicates ± standard error of the mean (SEM) of two independent experiments, using seven PRODH-expressing clones and seven control clones for NCI-H1299, or two PRODH-expressing and two control pools for Calu-6 cells. Results were analyzed by two-tailed Student’s t-test. Asterisks indicate significant differences (*** p-value < 0.001); “ns” indicates not significant difference.
Figure 4
Figure 4
PRODH expression increases reactive oxygen species (ROS) production in NCI-H1299 cells. ROS measurement by 2′,7′-dichlorofluorescein diacetate (DCFDA) assay in PRODH-expressing and control clones from the NCI-H1299 lung ADC cell line. Four PRODH-expressing clones and two control clones were used. The average ± SEM of ROS level of each type of clone (PRODH-expressing and control clones) was calculated. ROS production by PRODH-expressing clones is shown relative to control clones. N-acetylcysteine (NAC) treatment neutralized the ROS increase observed in PRODH-expressing clones compared to control clones. H2O2 treatment was used as a positive control. Results were obtained from three independent experiments. Asterisks indicate significant differences in the relative ROS levels under the different conditions (Student’s t-test; ** indicates p-value < 0.01; *** indicates p-value < 0.001; **** indicates p-value < 0.0001).
Figure 5
Figure 5
PRODH does not induce apoptosis in the NCI-H1299 cell line. (A) Analysis of caspase 3 and cleaved caspase 3 in PRODH-expressing and control clones. Analysis of caspase 3 and cleaved caspase 3 was carried out by immunoblotting. Levels were normalized to glyceraldehyde-3-phosphate dehydrogenase (GAPDH), using ImageJ software. (B) Quantification of Western blot data. Graph showing the average of caspase 3 protein normalized levels ± SEM in four PRODH-expressing clones relative to two control clones. The difference between control and PRODH-expressing clones was not significant (Student’s t-test). (C) Vital count with Trypan blue. The relative ratio of the average of Trypan blue stained cells ± SEM of four PRODH-expressing clones compared to the average of two control clones is shown. The difference between control and PRODH clones was not significant (chi-squared test). (D) Flow cytometric analysis of Annexin V/Propidium iodide (PI)-stained cells. The relative ratio of apoptotic cells (Annexin V+-Annexin V+/PI+) ± SEM of three PRODH-expressing clones relative to a control clone is shown. The difference between control and PRODH-expressing clones was not significant (Student’s t-test); “ns” indicates not significant difference. The uncropped original western blot has been submitted in the Supplementary Materials as Figure S3.
Figure 6
Figure 6
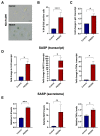
PRODH expression has a role in the induction of cellular senescence and senescence-associated secretory phenotype (SASP) in the NCI-H1299 lung ADC cell line. (A) Representative images of senescence-associated-β-galactosidase (SA-β-gal) staining in a control (up caption) and a PRODH-expressing clone (down caption). Magnification 400×. The bar indicates 14 μm. (B) Bar graph showing the percentage of SA-β-gal-positive cells. Average of the percentage of senescent cells ± SEM in the two control clones and the four PRODH-expressing clones is shown. Asterisks indicate significant differences in the two types of clones (chi-squared test; **** indicates p-value < 0.0001). (C) Analysis of p21 (cell cycle inhibitor) expression by qPCR. The graph shows the average ± SEM of qPCR results obtained in three experiments for three PRODH-expressing clones; the values are expressed relative to the average results of two control clones. Asterisks indicate significant differences between the two types of clones (Student’s t-test; * indicates p-value < 0.05). (D) Transcript levels of SASP genes. Transcript levels of interleukin-8 (IL-8), monocyte chemoattractant protein-1 (MCP-1) and tumor necrosis factor alpha (TNFα), in control and PRODH-expressing clones in NCI-H1299 cell line as detected by qPCR. The graphs show the average ± SEM of qPCR results obtained for three PRODH-expressing clones in three experiments for IL-8 and TNFα and in two experiments for MCP1, and the reported values are relative to the average results of two control clones. Asterisks indicate significant differences in the expression levels (Student’s t-test; * indicates p-value < 0.05). (E) Secreted levels of SASP soluble factors. Secreted protein levels of IL-8, MCP-1, and TNFα in control and PRODH-expressing clones of the NCI-H1299 cell line, as detected by secretome analysis. The graphs show the average ± SEM of secretome results obtained from two PRODH-expressing clones and two control clones, in NCI-H1299 cells. Asterisks indicate significant differences between the two types of clones (Student’s t-test; * indicates p-value < 0.05; *** indicates p-value < 0.001); “ns” indicates not significant difference. The uncropped original blots relative to secretome analysis and their elaboration have been submitted in the Supplementary Materials as Figures S5–S7.

Similar articles

Cited by

References

    1. Siegel R.L., Miller K.D., Wagle N.S., Jemal A. Cancer statistics, 2023. CA Cancer J. Clin. 2023;73:17–48. doi: 10.3322/caac.21763. - DOI - PubMed
    1. Jantus-Lewintre E., Uso M., Sanmartin E., Camps C. Update on biomarkers for the detection of lung cancer. Lung Cancer. 2012;3:21–29. - PMC - PubMed
    1. Chen Z., Fillmore C.M., Hammerman P.S., Kim C.F., Wong K.K. Non-small-cell lung cancers: A heterogeneous set of diseases. Nat. Rev. Cancer. 2014;14:535–546. doi: 10.1038/nrc3775. - DOI - PMC - PubMed
    1. Wilde L., Roche M., Domingo-Vidal M., Tanson K., Philp N., Curry J., Martinez-Outschoorn U. Metabolic coupling and the Reverse Warburg Effect in cancer: Implications for novel biomarker and anticancer agent development. Semin. Oncol. 2017;44:198–203. doi: 10.1053/j.seminoncol.2017.10.004. - DOI - PMC - PubMed
    1. Phang J.M. Proline Metabolism in Cell Regulation and Cancer Biology: Recent Advances and Hypotheses. Antioxid. Redox Signal. 2019;30:635–649. doi: 10.1089/ars.2017.7350. - DOI - PMC - PubMed

MeSH terms