

Chitotriose Enhanced Antitumor Activity of Doxorubicin through Egr1 Upregulation in MDA-MB-231 Cells
- PMID: 38248651
- PMCID: PMC10821154
- DOI: 10.3390/md22010026
Chitotriose Enhanced Antitumor Activity of Doxorubicin through Egr1 Upregulation in MDA-MB-231 Cells
Abstract
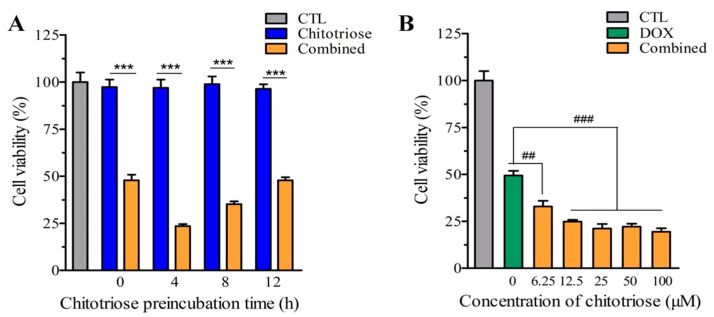
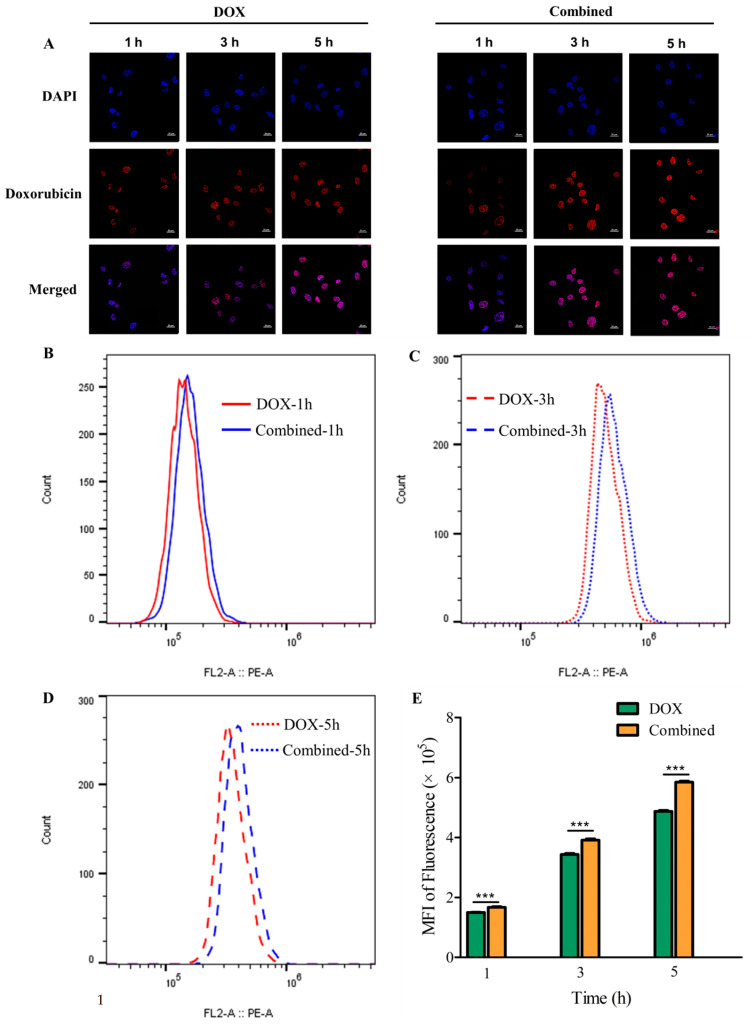
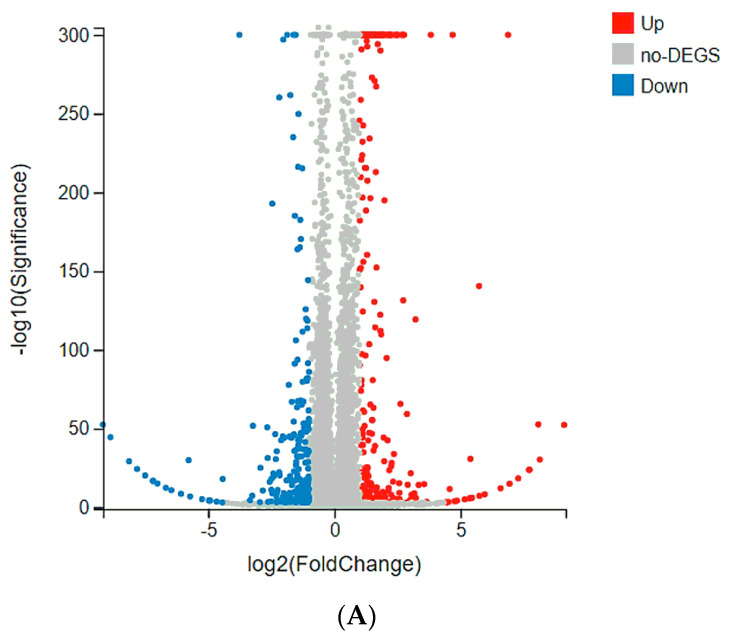
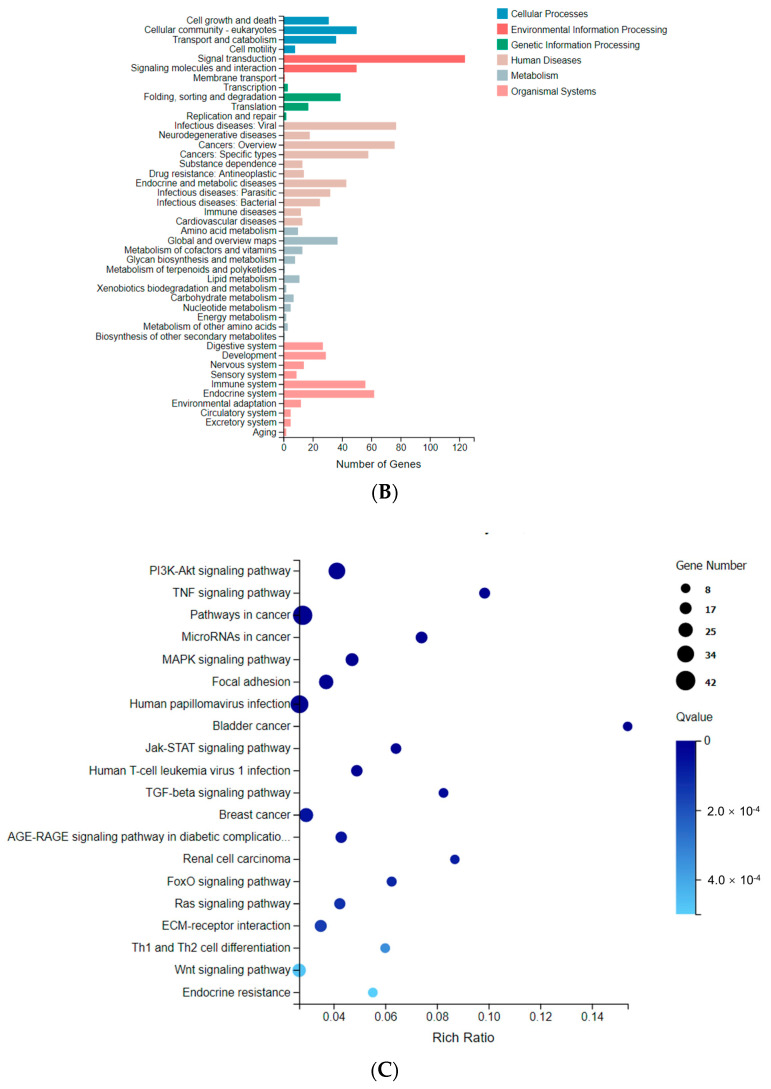
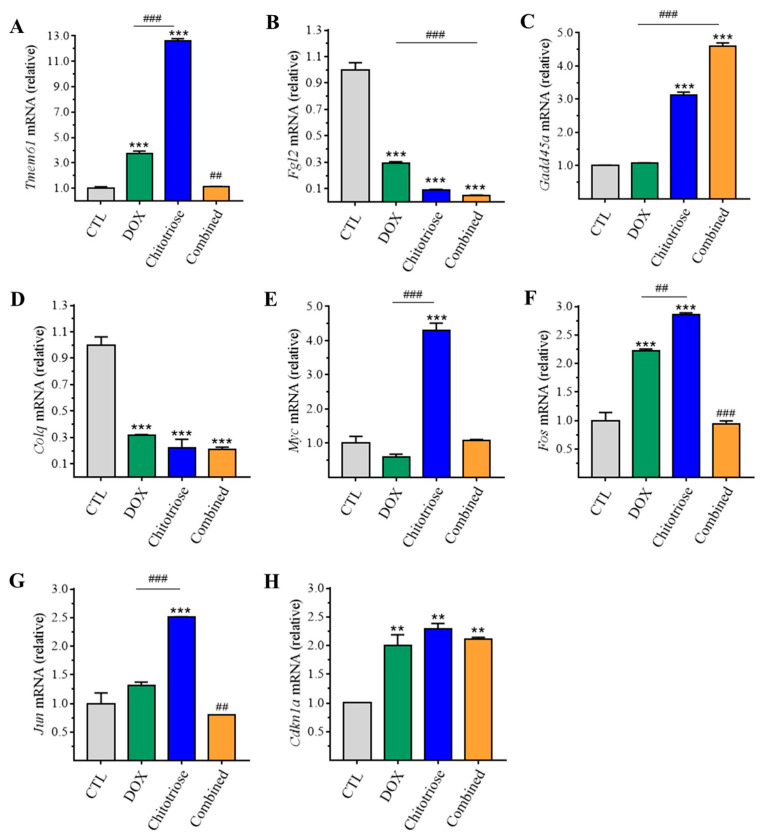
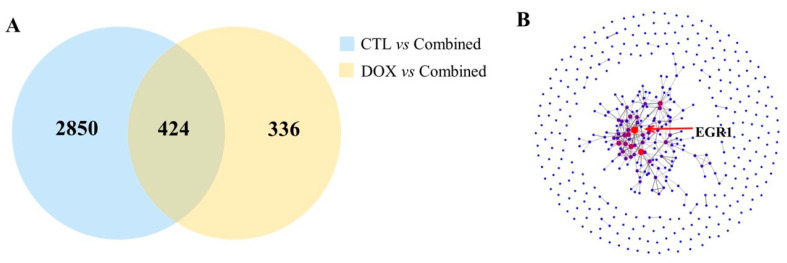
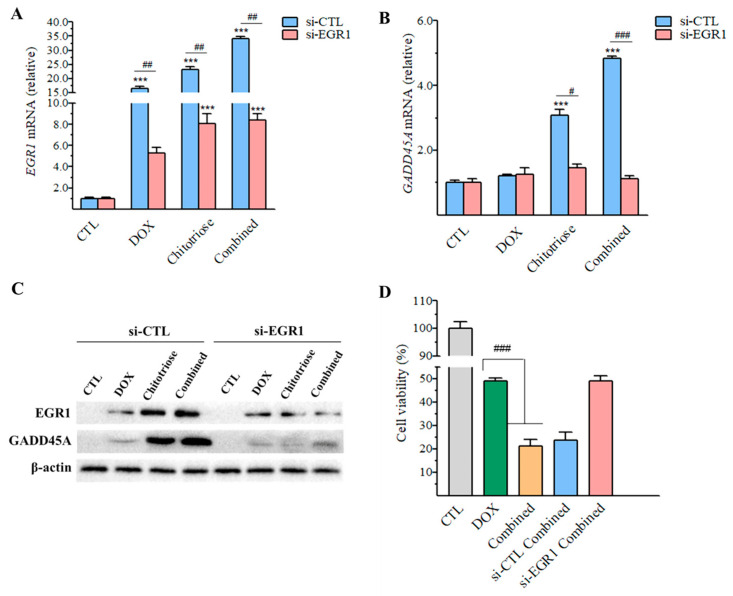
Dietary supplementation is proposed as a strategy to reduce the side effects of conventional chemotherapy for triple-negative breast cancer (TNBC). Chitosan oligosaccharides (COS), a functional carbohydrate, have been identified to potentially inhibit cancer cell proliferation. However, a detailed investigation is required to fully understand its exact influence, particularly in terms of COS composition. The antitumor activities of COS oligomers and its monomer of glucosamine, when combined with doxorubicin separately, were evaluated in MDA-MB-231 cells. Chitotriose was identified to have the most significant synergistic effect. Preincubation with chitotriose was observed to promote the entry of doxorubicin into the cell nuclei and induce morphological changes in the cells. Mechanism analysis at the transcriptional level revealed that the early growth response 1 (Egr1) gene was a key regulator in enhancing the suppressive effect. This gene was found to modulate the activity of its downstream gene, growth arrest, and DNA damage-inducible alpha (Gadd45a). The role of Egr1 was confirmed through a small interfering RNA test and function assay. These findings provide insight into the effect and underlying mechanism of chitotriose supplementation for TNBC therapy.
Keywords: RNA sequencing; antitumor activity; chitotriose; early growth response 1 (Egr1); triple-negative breast cancer (TNBC).
Conflict of interest statement
C.Z. and Z.D. are employed by the Yangzhou Rixing Bio-Tech Co., Ltd. The remaining authors declare that the research was conducted in the absence of any commercial or financial relationships that could be construed as a potential conflict of interest.
Figures

Similar articles
-
Baicalein sensitizes triple negative breast cancer MDA-MB-231 cells to doxorubicin via autophagy-mediated down-regulation of CDK1.Mol Cell Biochem. 2023 Jul;478(7):1519-1531. doi: 10.1007/s11010-022-04597-9. Epub 2022 Nov 21. Mol Cell Biochem. 2023. PMID: 36413334
-
Sulforaphene inhibits triple negative breast cancer through activating tumor suppressor Egr1.Breast Cancer Res Treat. 2016 Jul;158(2):277-86. doi: 10.1007/s10549-016-3888-7. Epub 2016 Jul 4. Breast Cancer Res Treat. 2016. PMID: 27377973
-
Enhancing chemosensitivity of wild-type and drug-resistant MDA-MB-231 triple-negative breast cancer cell line to doxorubicin by silencing of STAT 3, Notch-1, and β-catenin genes.Breast Cancer. 2020 Sep;27(5):989-998. doi: 10.1007/s12282-020-01098-9. Epub 2020 Apr 23. Breast Cancer. 2020. PMID: 32328816
-
FRZB is Regulated by the Transcription Factor EGR1 and Inhibits the Growth and Invasion of Triple-Negative Breast Cancer Cells by Regulating the JAK/STAT3 Pathway.Clin Breast Cancer. 2022 Oct;22(7):690-698. doi: 10.1016/j.clbc.2022.05.010. Epub 2022 Jun 2. Clin Breast Cancer. 2022. PMID: 35787980
-
Sulforaphane induces autophagy by inhibition of HDAC6-mediated PTEN activation in triple negative breast cancer cells.Life Sci. 2018 Nov 15;213:149-157. doi: 10.1016/j.lfs.2018.10.034. Epub 2018 Oct 20. Life Sci. 2018. PMID: 30352240
Cited by
-
WTAP/IGF2BP3 mediated m6A modification of the EGR1/PTEN axis regulates the malignant phenotypes of endometrial cancer stem cells.J Exp Clin Cancer Res. 2024 Jul 23;43(1):204. doi: 10.1186/s13046-024-03120-w. J Exp Clin Cancer Res. 2024. PMID: 39044249 Free PMC article.
References
MeSH terms
Substances
Grants and funding
LinkOut - more resources
Full Text Sources
Miscellaneous
