

A granularity-level information fusion strategy on hypergraph transformer for predicting synergistic effects of anticancer drugs
- PMID: 38243692
- PMCID: PMC10796255
- DOI: 10.1093/bib/bbad522
A granularity-level information fusion strategy on hypergraph transformer for predicting synergistic effects of anticancer drugs
Abstract
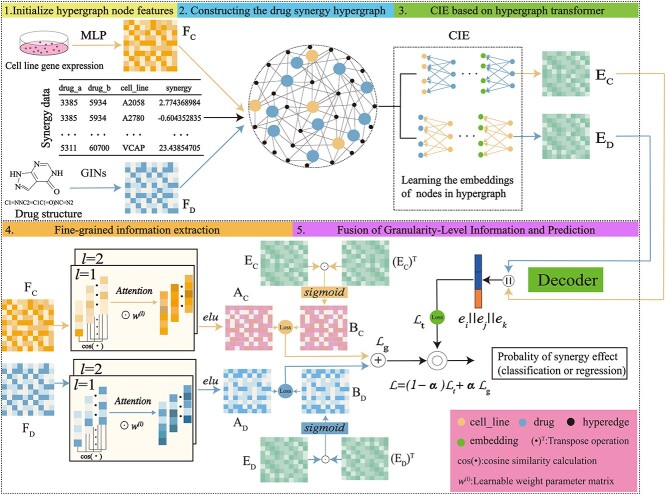
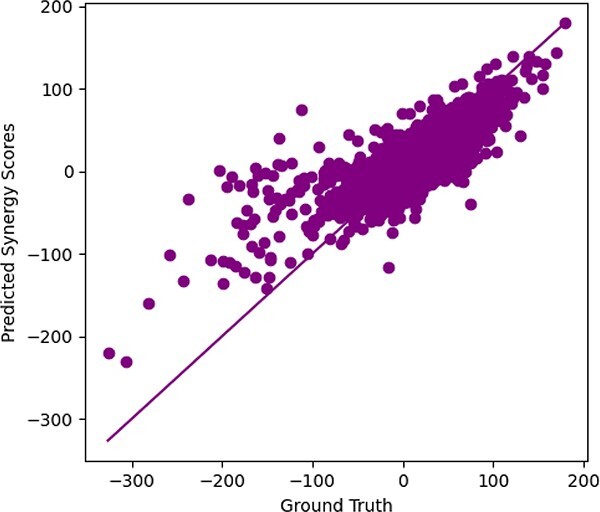
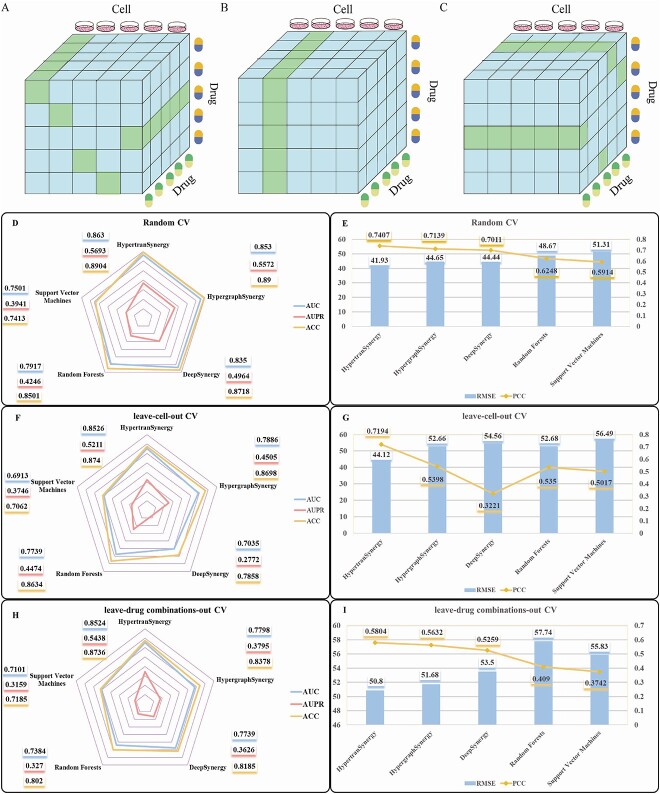
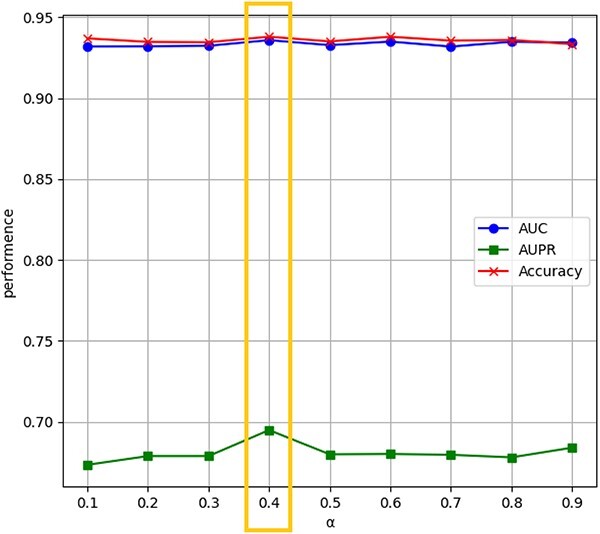
Combination therapy has exhibited substantial potential compared to monotherapy. However, due to the explosive growth in the number of cancer drugs, the screening of synergistic drug combinations has become both expensive and time-consuming. Synergistic drug combinations refer to the concurrent use of two or more drugs to enhance treatment efficacy. Currently, numerous computational methods have been developed to predict the synergistic effects of anticancer drugs. However, there has been insufficient exploration of how to mine drug and cell line data at different granularity levels for predicting synergistic anticancer drug combinations. Therefore, this study proposes a granularity-level information fusion strategy based on the hypergraph transformer, named HypertranSynergy, to predict synergistic effects of anticancer drugs. HypertranSynergy introduces synergistic connections between cancer cell lines and drug combinations using hypergraph. Then, the Coarse-grained Information Extraction (CIE) module merges the hypergraph with a transformer for node embeddings. In the CIE module, Contranorm is a normalization layer that mitigates over-smoothing, while Gaussian noise addresses local information gaps. Additionally, the Fine-grained Information Extraction (FIE) module assesses fine-grained information's impact on predictions by employing similarity-aware matrices from drug/cell line features. Both CIE and FIE modules are integrated into HypertranSynergy. In addition, HypertranSynergy achieved the AUC of 0.93${\pm }$0.01 and the AUPR of 0.69${\pm }$0.02 in 5-fold cross-validation of classification task, and the RMSE of 13.77${\pm }$0.07 and the PCC of 0.81${\pm }$0.02 in 5-fold cross-validation of regression task. These results are better than most of the state-of-the-art models.
Keywords: anticancer drugs; granularity-level information fusion; hypergraph; predicting synergistic effects; transformer.
© The Author(s) 2024. Published by Oxford University Press.
Figures


Similar articles
-
Multi-way relation-enhanced hypergraph representation learning for anti-cancer drug synergy prediction.Bioinformatics. 2022 Oct 14;38(20):4782-4789. doi: 10.1093/bioinformatics/btac579. Bioinformatics. 2022. PMID: 36000898
-
SNRMPACDC: computational model focused on Siamese network and random matrix projection for anticancer synergistic drug combination prediction.Brief Bioinform. 2023 Jan 19;24(1):bbac503. doi: 10.1093/bib/bbac503. Brief Bioinform. 2023. PMID: 36418927
-
DTSyn: a dual-transformer-based neural network to predict synergistic drug combinations.Brief Bioinform. 2022 Sep 20;23(5):bbac302. doi: 10.1093/bib/bbac302. Brief Bioinform. 2022. PMID: 35915050
-
Synergistic enhancement of anticancer effects on numerous human cancer cell lines treated with the combination of EGCG, other green tea catechins, and anticancer compounds.J Cancer Res Clin Oncol. 2015 Sep;141(9):1511-22. doi: 10.1007/s00432-014-1899-5. Epub 2014 Dec 28. J Cancer Res Clin Oncol. 2015. PMID: 25544670 Review.
-
Liposomes Co- encapsulating Anticancer Drugs in Synergistic Ratios as an Approach to Promote Increased Efficacy and Greater Safety.Anticancer Agents Med Chem. 2019;19(1):17-28. doi: 10.2174/1871520618666180420170124. Anticancer Agents Med Chem. 2019. PMID: 29692263 Review.
Cited by
-
Prediction of miRNA-disease association based on multisource inductive matrix completion.Sci Rep. 2024 Nov 11;14(1):27503. doi: 10.1038/s41598-024-78212-w. Sci Rep. 2024. PMID: 39528650 Free PMC article.
-
DCDA: CircRNA-Disease Association Prediction with Feed-Forward Neural Network and Deep Autoencoder.Interdiscip Sci. 2024 Mar;16(1):91-103. doi: 10.1007/s12539-023-00590-y. Epub 2023 Nov 17. Interdiscip Sci. 2024. PMID: 37978116
-
Integration of the bulk transcriptome and single-cell transcriptome reveals efferocytosis features in lung adenocarcinoma prognosis and immunotherapy by combining deep learning.Cancer Cell Int. 2024 Nov 23;24(1):388. doi: 10.1186/s12935-024-03571-3. Cancer Cell Int. 2024. PMID: 39580462 Free PMC article.
-
Anti-inflammatory effects of resveratrol in treating interstitial cystitis/bladder pain syndrome: a multi-faceted approach integrating network pharmacology, molecular docking, and experimental validation.Mol Divers. 2024 Oct 14. doi: 10.1007/s11030-024-11004-6. Online ahead of print. Mol Divers. 2024. PMID: 39400868
-
Pan-cancer integrated analysis of ANKRD1 expression, prognostic value, and potential implications in cancer.Sci Rep. 2024 Mar 4;14(1):5268. doi: 10.1038/s41598-024-56105-2. Sci Rep. 2024. PMID: 38438492 Free PMC article.
References
Publication types
MeSH terms
Substances
Grants and funding
- 212300410367/Natural Science Foundation of Henan Province
- 21A520023/Science and Technology Research Key Project of Educational Department of Henan Province
- 62072160/National Natural Science Foundation of China
- 212102310381/Science and Technology Department of Henan Province
- 2018JK19/Educational Science Research Foundation of Henan Normal University
