. 2024 Jan 16;7(1):104.
doi: 10.1038/s42003-024-05783-9.

The adhesion GPCR GPR116/ADGRF5 has a dual function in pancreatic islets regulating somatostatin release and islet development

Affiliations

The adhesion GPCR GPR116/ADGRF5 has a dual function in pancreatic islets regulating somatostatin release and islet development

Juliane Röthe et al. Commun Biol. .

Abstract

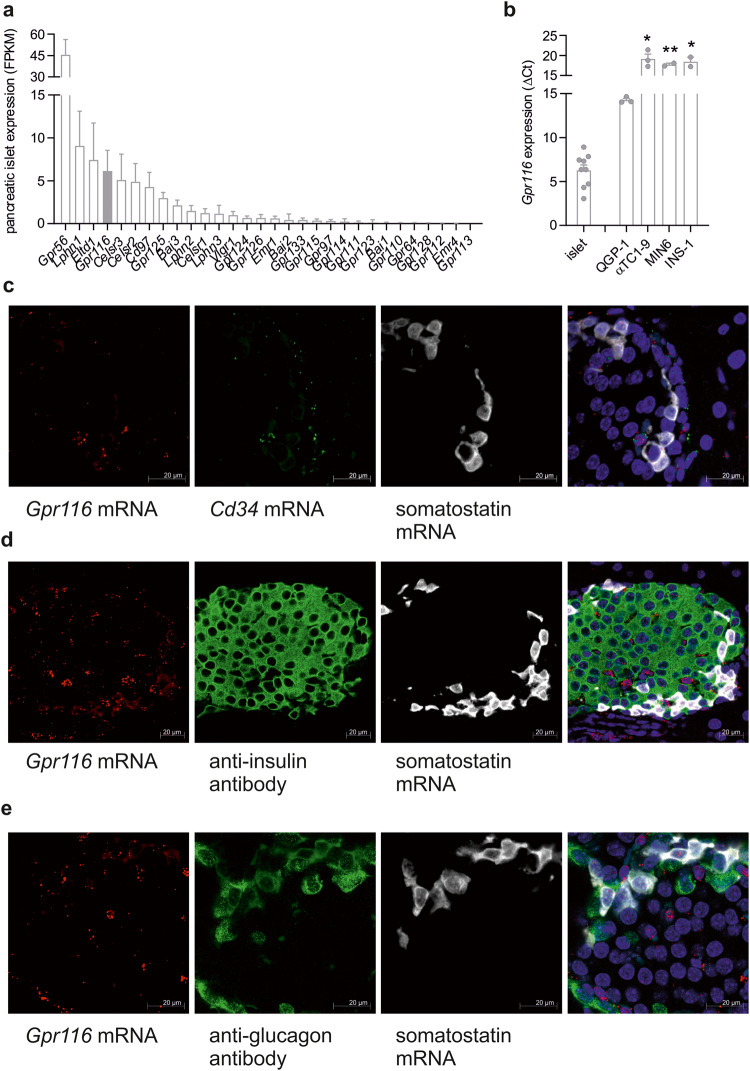
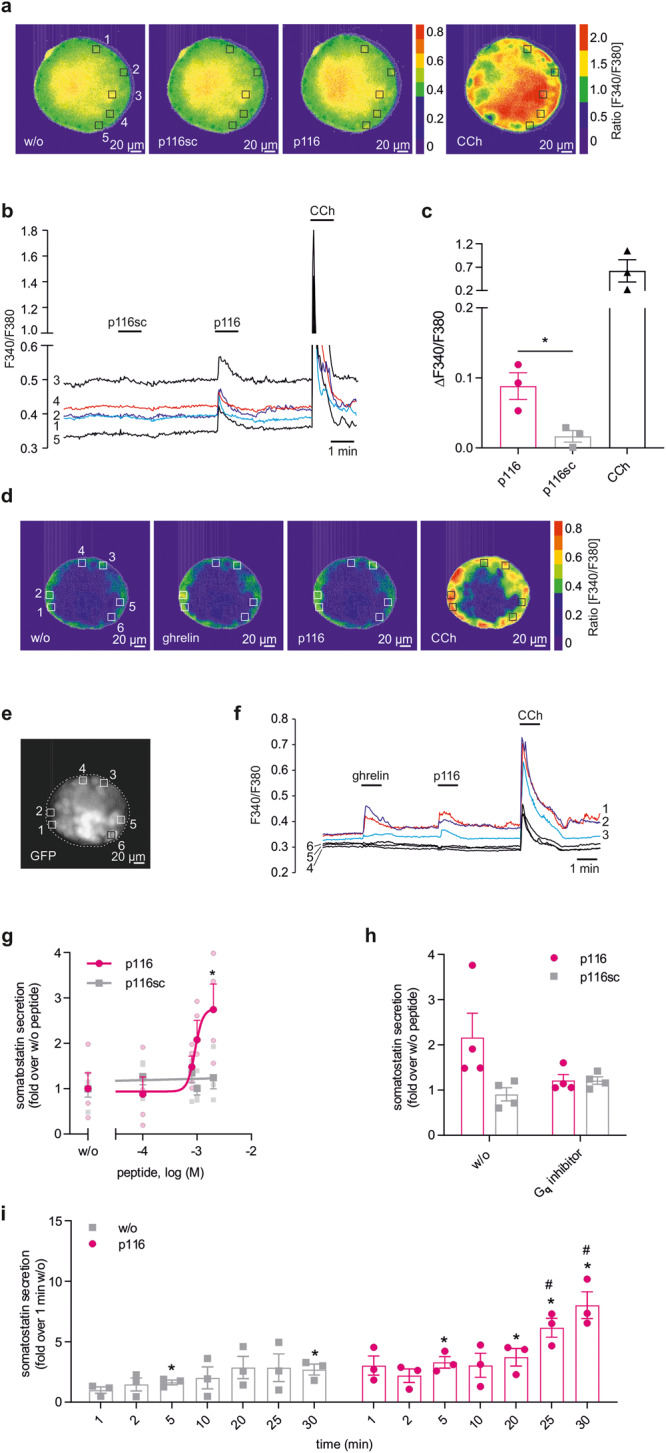
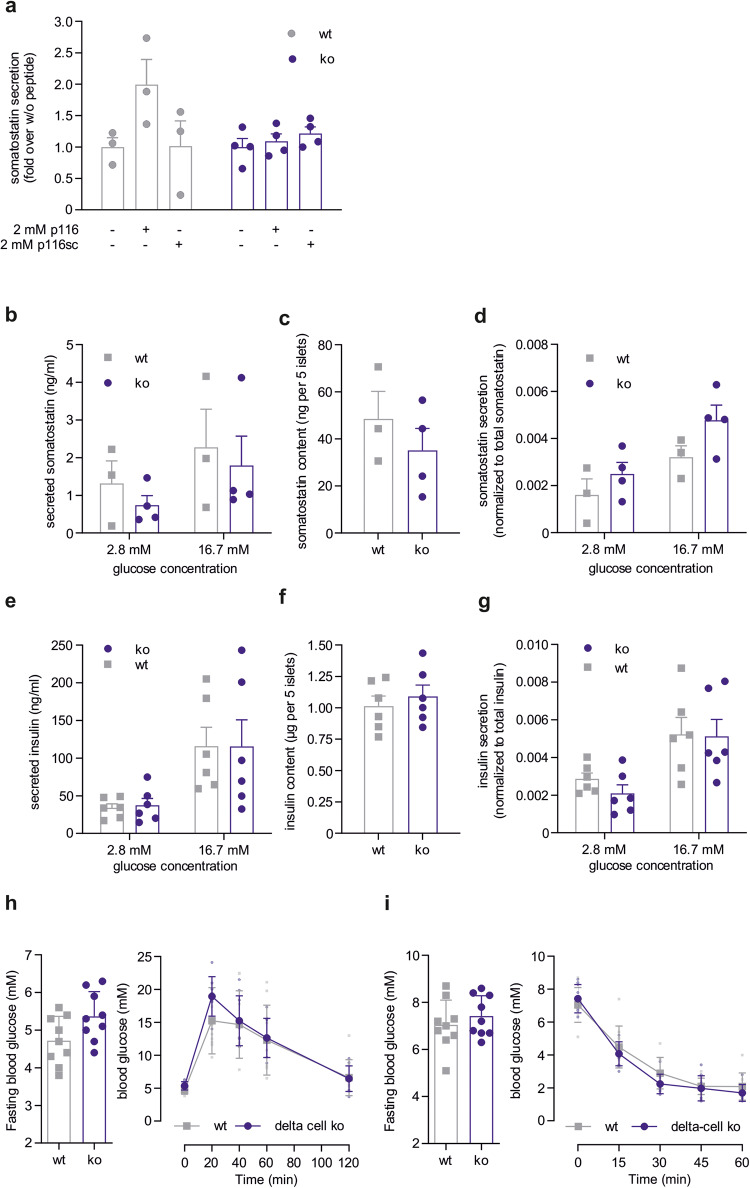
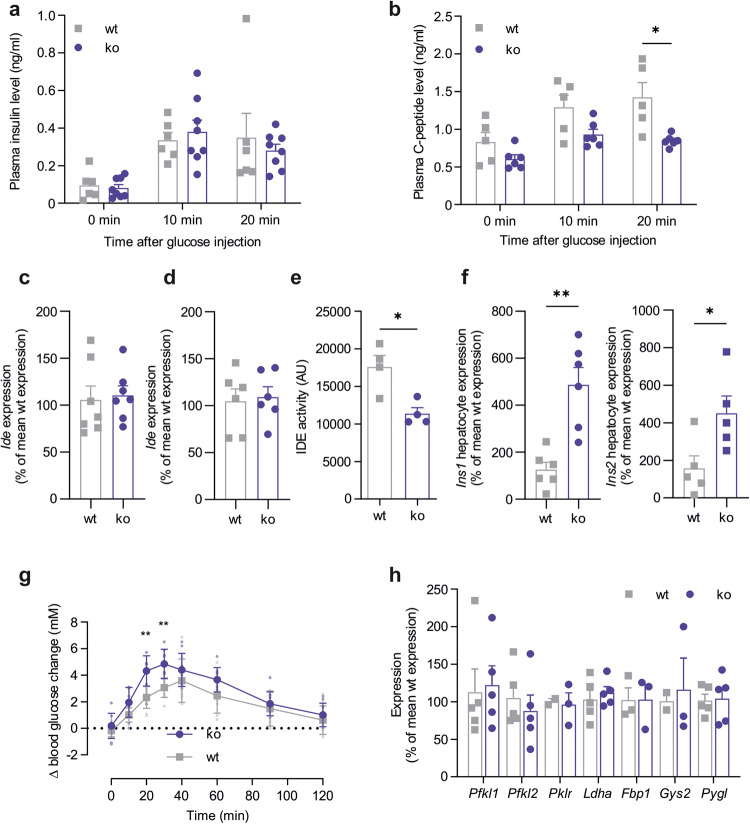
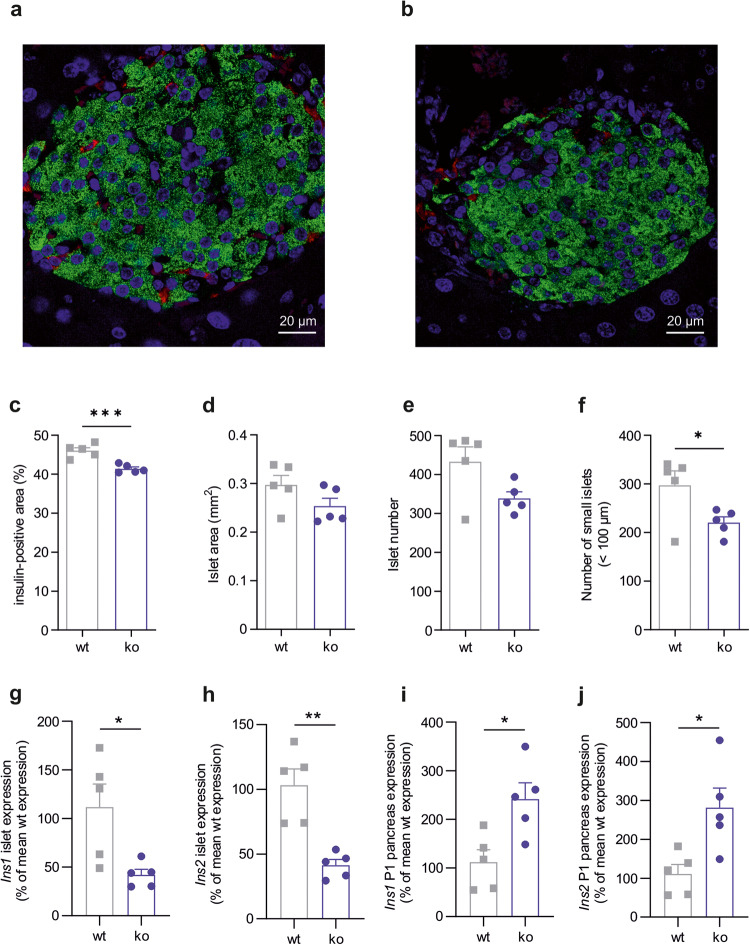
Glucose homeostasis is maintained by hormones secreted from different cell types of the pancreatic islets and controlled by manifold input including signals mediated through G protein-coupled receptors (GPCRs). RNA-seq analyses revealed expression of numerous GPCRs in mouse and human pancreatic islets, among them Gpr116/Adgrf5. GPR116 is an adhesion GPCR mainly found in lung and required for surfactant secretion. Here, we demonstrate that GPR116 is involved in the somatostatin release from pancreatic delta cells using a whole-body as well as a cell-specific knock-out mouse model. Interestingly, the whole-body GPR116 deficiency causes further changes such as decreased beta-cell mass, lower number of small islets, and reduced pancreatic insulin content. Glucose homeostasis in global GPR116-deficient mice is maintained by counter-acting mechanisms modulating insulin degradation. Our data highlight an important function of GPR116 in controlling glucose homeostasis.


Conflict of interest statement

The authors declare the following competing interests: M.G.L. is employed by and shareholder of Novartis Pharma AG. All other authors declare no competing interests.

Figures

Fig. 1
Fig. 1. Expression of GPR116 and structurally related aGPCRs in pancreatic islet cells.
a Pancreatic islet RNAseq analysis was re-analyzed to determine the expression of aGPCRs. Here, we observe high expression of aGPCRs with an already described function in islets such as Gpr56 or Lphn1. Among the highly expressed receptors we also detected Gpr116. Given is the mean ± SD of 10 animals. b qPCR analysis was performed to confirm high expression of Gpr116 in pancreatic islets. Furthermore, we also detected expression in specific cell lines mimicking delta (QGP-1), alpha (αTC1-9) and beta (MIN6, INS-1) cells. Given is the relative expression of GPR116 normalized to β-actin as reference gene as mean ± SEM of 2 (INS-1, MIN6), 3 (QGP-1, αTC1-9), or 9 (islets) independent experiments carried out in triplicates. Statistical differences in expression were determined in the cell lines αTC1-9, MIN6, and INS-1 in comparison to QGP-1 cells using Student’s t test (*P ≤ 0.05; **P ≤ 0.01). ce To detect cell-type specific expression of Gpr116 mRNA in situ hybridization studies combined with immunofluorescence was performed on sections of mouse pancreas. Probes for Gpr116 (red) and somatostatin (white) as well as Gpr116 (red) and Cd34 (green) showed a partially overlapping expression (c), while Gpr116 mRNA was hardly detected in insulin- (d), or glucagon-positive (e) cells shown in green.
Fig. 2
Fig. 2. GPR116 signaling in mouse pancreatic islets.
a Ca2+ imaging experiments were performed on single pancreatic islets from C57BL6/N mice loaded with fura-2 AM. Images show the fluorescence ratio (F340/F380) of one representative islet before and after application of 1 mM p116sc, 1 mM p116, and 100 µM carbachol (CCh). b Time course of Ca2+ responses in five representative regions (1–5) within the islet is shown and corresponds to c. c Changes in intracellular Ca2+ concentration induced by p116 (1 mM), p116sc (1 mM), and CCh (100 µM) in pancreatic islets. Relative changes in the Ca2+ concentration are presented as mean delta ratio (F340/F380) ± SEM from three islets containing five to seven regions of interest (defined as squares of 13 µm side length). Statistical significance was tested using a two-tailed unpaired t test (*P ≤ 0.05). d Fura-2-based Ca2+ imaging experiments were performed on single pancreatic islets from MIP-GFP mice, expressing Enhanced Green Fluorescent Protein (EGFP) under the control of the mouse insulin 1 promoter. Images show the fluorescence ratio (F340/F380) of one representative islet before and after application of ghrelin (300 nM), p116 (1 mM), and carbachol (CCh, 100 µM). e Six representative regions (1–6) within the islet were chosen showing EGFP fluorescence of low (regions 1–3) or moderate (regions 4–6) intensity. These regions correspond to those shown in d. f Time course of Ca2+ responses in regions 1–3 (colored) and 4–6 (black) within the islet corresponds to d. g Somatostatin secretion from pancreatic islets of wt C57BL6/N mice was measured after incubation (30 min) with different concentrations of GPR116 agonist p116 and inactive peptide p116sc (control) under high-glucose (16.7 mM) conditions. Given is the mean ± SEM as fold over non-stimulated islets (1.9 ± 0.5 ng/ml) of four independent experiments performed in duplicates. Statistical significance was tested using one-way ANOVA with Dunnet’s multiple comparison test. *P ≤ 0.05 compared with non-stimulated islets. h After pre-incubation with the Gq inhibitor FR900359 pancreatic islets were incubated with 2 mM p116 or 2 mM p116sc and somatostatin secretion was measured under high-glucose conditions after 30 min. Data are shown as fold over somatostatin secretion of non-stimulated islets (w/o Gq inhibitor: 2.0 ± 0.6 ng/ml; Gq inhibitor: 1.4 ± 0.2 ng/ml), given as mean ± SEM of four independent experiments carried out in duplicates. i Somatostatin secretion from wt pancreatic islets (C57BL6/N) was measured under high-glucose conditions with and without 2 mM p116 at different time points. Shown is the mean ± SEM as fold over 1 min glucose-stimulated islets (basal somatostatin secretion: 0.6 ± 0.2 ng/ml) of three independent experiments performed in duplicates. P values were determined using one-way ANOVA. *compared to non-stimulated islets 1 min after incubation; # compared to p116 stimulated islets 1 min after incubation (*P ≤ 0.05).
Fig. 3
Fig. 3. Constitutive GPR116 ko mice show reduced insulin secretion and decreased insulin content in pancreatic islets.
a Somatostatin secretion from pancreatic islets of wt and ko mice was measured after incubation with different concentrations of p116 (agonist) and p116sc (control). Given is the mean ± SEM fold over non-stimulated islets (wt: 2.7 ± 1.0 ng/ml; ko: 2.8 ± 1.7 ng/ml) of n = 3 (1 mM peptide) or n = 7 or 8 (non-stimulated and 2 mM peptide of ko and wt, respectively) performed in duplicates. P values were determined using one-way ANOVA in comparison to the respective non-stimulated incubation (**P ≤ 0.01). bd Analysis of glucose-induced somatostatin secretion. Secreted somatostatin (b) as well as somatostatin content (c) from wt and ko pancreatic islets were quantified at low (2.8 mM) and high (16.7 mM) glucose conditions. d For each sample, ratios for glucose-induced somatostatin secretion were calculated as a percentage of total somatostatin content. Data are presented as mean ± SEM performed in duplicates of n = 8 wt and n = 7 ko and 5 islets per sample. eg Analysis of glucose-induced insulin secretion. Secreted insulin (e) as well as insulin content (f) from wt and ko pancreatic islets were quantified at low (2.8 mM) and high (16.7 mM) glucose conditions. g For each sample, ratios for glucose-induced insulin secretion were calculated as a percentage of total somatostatin content. Data are presented as mean ± SEM performed in duplicates of n = 9 and 5 islets per sample. P values were determined using an unpaired multiple t test (Holm-Šídák method) (*P ≤ 0.05). h Blood glucose was measured in overnight fasted ko and wt mice. Given is the mean glucose level ± SD performed in triplicates for n = 9 mice. Statistical significance was tested using a two-tailed unpaired t test (**P ≤ 0.01). Glucose tolerance test was performed by measuring blood glucose levels at different time points after peritoneal glucose injection. Data represent mean ± SD of 9 mice per genotype. i Blood glucose was measured after 6-hour fasting in ko and wt mice. Given is the mean glucose level ± SD for 6 animals per genotype. Statistical significance was tested using a two-tailed unpaired t test (*P ≤ 0.05). Insulin tolerance test was performed in by measuring blood glucose levels at different time points after peritoneal insulin injection. Data represent mean ± SD of 6 mice per genotype.
Fig. 4
Fig. 4. Characterization of delta cell-specific Gpr116 ko mice.
a Somatostatin secretion from pancreatic islets of wt and delta cell-specific ko mice was measured after incubation with p116 (agonist) or p116sc (control). Given is the mean ± SEM fold over non-stimulated islets of n = 4 (wt) or 4 (ko) performed in duplicates. Statistical significance was tested using a two-tailed unpaired t test (*P ≤ 0.05). bd Analysis of glucose-induced somatostatin secretion. Secreted somatostatin (b) as well as somatostatin content (c) from wt and delta cell-specific ko pancreatic islets were quantified at low (2.8 mM) and high (16.7 mM) glucose conditions. d For each sample, ratios for glucose-induced somatostatin secretion were calculated as a percentage of total somatostatin content. Data are presented as mean ± SEM performed in duplicates of n = 3 (wt) or 4 (ko). eg Analysis of glucose-induced insulin secretion. Secreted insulin (e) as well as insulin content (f) from wt and delta cell-specific ko pancreatic islets were quantified at low (2.8 mM) and high (16.7 mM) glucose conditions. g For each sample, ratios for glucose-induced insulin secretion were calculated as a percentage of total somatostatin content. Data are presented as mean ± SEM performed in duplicates of n = 6 and 5 islets per sample. h Blood glucose was measured in overnight fasted delta cell-specific ko and wt mice. Given is the mean glucose level ± SD performed in triplicates for n = 9 mice. Glucose tolerance test was performed by measuring blood glucose levels at different time points after peritoneal glucose injection. Data represent mean ± SD of 9 mice per genotype. i Blood glucose was measured after 6-hour fasting in delta cell-specific ko and wt mice. Given is the mean glucose level ± SD for 9 animals per genotype. Insulin tolerance test was performed in by measuring blood glucose levels at different time points after peritoneal insulin injection. Data represent mean ± SD of 9 mice per genotype.
Fig. 5
Fig. 5. Analysis of insulin metabolism in constitutive GPR116 ko mice.
a Plasma insulin concentration in samples of wt (n = 6) and ko (n = 8) mice was determined at different time points after peritoneal glucose injection with the mouse insulin ELISA. Given are plasma insulin concentrations as mean ± SEM performed in duplicates. b C-peptide concentration in samples of wt (n = 5) and ko (n = 6) mice was determined at different time points after peritoneal glucose injection with the mouse C-peptide ELISA. Given are plasma concentrations as mean ± SEM performed in duplicates. P values were determined using an unpaired multiple t test (Holm-Šídák method) (*P ≤ 0.05). c, d Expression of insulin degrading enzyme Ide is not changed by Gpr116 ko neither in liver (c) nor in hepatocytes (d). Given is the percentage of wt expression in reference to Actb expression as mean ± SEM of n = 7 (wt) or n = 6 (ko) each performed in triplicates. e IDE activity was analyzed in hepatocytes isolated from wt and constitutive GPR116 ko mice using a SensoLyte IDE activity assay. Given is the mean ± SEM of 4 independent experiments each performed in duplicates. Statistical significance was tested using a two-tailed unpaired t test (*P ≤ 0.05). f Expression levels of Ins1 and Ins2 were determined in isolated hepatocytes from wt and ko mice. Data are presented as percentage of wt expression in reference to Actb expression and given is the mean ± SEM of n = 6 (Ins1) and n = 5 (Ins2) each performed in triplicates. Statistical significance was tested using a two-tailed unpaired t test (*P ≤ 0.05; **P ≤ 0.01). g Pyruvate tolerance test was performed in BALB/c wt and ko mice by measuring blood glucose levels at different time points after peritoneal pyruvate injection. Data represent mean ± SD of 9 mice per genotype. P values were determined using an unpaired multiple t test (Holm-Šídák method) (**P ≤ 0.01). h Expression analysis of key enzymes of glycolysis, gluconeogenesis or glycogen metabolism in hepatocytes reveals no differences between wt and ko animals. Data were obtained using qPCR, are normalized to Actb expression, and are shown as percentage of wt expression. Given is the mean ± SEM of 2–5 wt and ko mice.
Fig. 6
Fig. 6. GPR116 deficiency affects islet number, insulin-positive area, and insulin expression.
a, b Immunofluorescence staining of mouse pancreatic islets of wt (a) and ko (b) mice. Shown are representative images of wt and ko islets with insulin-positive cells (green), somatostatin-positive cells (red), and DAPI-stained nuclei (blue). c Beta-cell amount was calculated as percentage of insulin-positive cell area relative to the total pancreatic islet area in pancreatic sections of wt and GPR116 ko mice. Shown is the mean ± SEM of all sections of five wt and ko mice. d The islet area was quantified in all analyzed sections of five wt and ko BALB/c animals. Data is given as mean ± SEM. e The total number of islets was counted in all pancreatic sections and is shown as mean ± SD of n = 5 per genotype. f The diameter of stained islets was calculated to classify islet size. Number of islets (<100 µm) were counted and are displayed as mean ± SD of all sections of n = 5 per genotype. g, h Insulin expression (Ins1 and Ins2) was determined in adult islets from 5 wt and ko animals. Data is given as percentage of wt expression (mean ± SEM) normalized to expression of Actb as reference gene. i, j Insulin expression (Ins1 and Ins2) was determined in pancreas of P1 animals (n = 5 per genotype). Data is given as percentage of wt expression (mean ± SEM) normalized to expression of Actb as reference gene. Statistical significance was tested using a two-tailed unpaired t test (*P ≤ 0.05; **P ≤ 0.01; ***P ≤ 0.001).

Similar articles

Cited by

References

    1. Arrojo e Drigo R, et al. New insights into the architecture of the islet of Langerhans. A focused cross-species assessment. Diabetologia. 2015;58:2218–2228. doi: 10.1007/s00125-015-3699-0. - DOI - PubMed
    1. Adriaenssens AE, et al. Transcriptomic profiling of pancreatic alpha, beta and delta cell populations identifies delta cells as a principal target for ghrelin in mouse islets. Diabetologia. 2016;59:2156–2165. doi: 10.1007/s00125-016-4033-1. - DOI - PMC - PubMed
    1. DiGruccio MR, et al. Comprehensive alpha, beta and delta cell transcriptomes reveal that ghrelin selectively activates delta cells and promotes somatostatin release from pancreatic islets. Mol. Metab. 2016;5:449–458. doi: 10.1016/j.molmet.2016.04.007. - DOI - PMC - PubMed
    1. Brereton MF, Vergari E, Zhang Q, Clark A. Alpha-, delta- and PP-cells. Are they the architectural cornerstones of islet structure and co-ordination? J. Histochem. Cytochem. 2015;63:575–591. doi: 10.1369/0022155415583535. - DOI - PMC - PubMed
    1. Grube D, Bohn R. The microanatomy of human islets of Langerhans, with special reference to somatostatin (D-) cells. Arch. Histol. Jpn. 1983;46:327–353. doi: 10.1679/aohc.46.327. - DOI - PubMed

Publication types

LinkOut - more resources